Employee Benefits Administrators (EBA) specializes in benefits administration outsourcing for small to medium-sized companies. Based in Morgantown, Pennsylvania, the office is now open for business.
Many employers today choose to outsource non-income generating functions within their business, such as Human Resources Administration. Outsourcing is a proactive approach that improves productivity and reduces costs. EBA aims to provide high-quality benefits administration and customer service, enabling clients to focus on their core competencies.
Initially, EBA will target clients with 10 to 500 employees. Clients can choose from four levels of service tailored to their needs: COBRA and HIPAA Administration, Flexible Spending Account Administration, Basic Benefits Administration for health and welfare plans (including a call center), and an "All-Inclusive" level combining the first three.
To market its services, EBA will work with business associates, insurance brokers, local businesses, and professional associations. EBA also plans to become certified as a Women’s Business Enterprise in Pennsylvania, enabling it to do business at the federal, state, and local government levels.
Employee Benefits Administrators is an LLC founded by Cindy Wells and Diane Davis, who have over 25 years of combined experience in corporate benefits administration, employee relations and communications, legal compliance, and customer service. Their extensive experience sets them apart from competitors.
This business plan includes financial projections for three years and aims to secure initial funding. It covers start-up costs and operating expenses for the first year. EBA expects substantial revenue by the end of year one and phenomenal revenue by the end of year two.
Contents
1.1 Objectives
- Achieve substantial first year revenue with phenomenal growth in the next year
- Acquire one new client/month for COBRA services, and one new client/quarter for basic and all inclusive services
- Grow the staff from three employees at the beginning of Year 2 to seven employees by the end of Year 3
- Expand services from providing benefits administration to include payroll and other HR services as requested by clients
1.2 Mission
Employee Benefits Administrators provides high quality benefits administration and customer service for small to medium sized companies, allowing them to focus on their strategic initiatives.
1.3 Keys to Success
- Deliver excellent communication and customer service skills — completely confidential, reliable, and trustworthy expertise and information
- Utilize one of the best Human Resources Information software modules on the market
- Possess thorough knowledge of benefits administration issues
Company Summary
EBA is a privately held Pennsylvania Limited Liability Company (LLC) co-owned by Diane Davis and Cindy Wells. The office is located on Main Street, Morgantown, PA, which was chosen due to its rapid suburban growth and proximity to the Pennsylvania Turnpike for easy access to surrounding areas.
2.1 Start-up Summary
The partners of EBA have spent almost a year planning this business venture. They have opened the office and invested time, energy, and personal funds to bring the business this far.
The initial investment was used to purchase IBM laptop computers, software licensing fees for the Human Resources Information System, computer accessories and docking stations, small business education, seminars on current employee benefit trends, memberships in organizations, rent and security deposit for an office, and various other start-up costs.
Considering the forecasted overall loss for the first year of business, EBA will explore options for obtaining a small business loan, preferably one guaranteed by the Small Business Association.
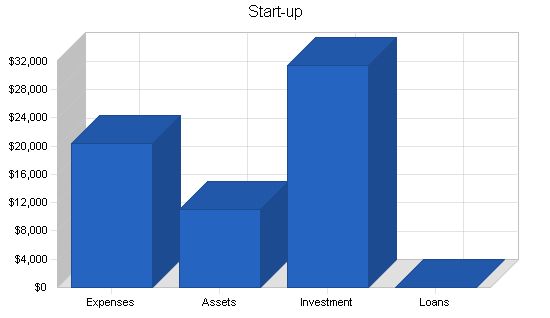
Start-up Funding Requirements:
– Start-up Expenses: $20,428
– Start-up Assets: $11,000
– Total Funding Required: $31,428
Services:
– Administration of COBRA and HIPAA
– Administration of Flexible Spending Accounts
– Administration of Basic Employee Benefits programs
– All-inclusive service level
Service Description:
1. COBRA and HIPAA administration:
– COBRA is a federal mandate where employers must offer terminated employees and their dependents the option to continue group health plan coverage.
– HIPAA is a federal mandate where employers must provide verification of group health insurance coverage to terminated employees and dependents.
2. Flexible Spending Accounts administration:
– Two types of accounts: medical and dependent care.
– Employees sign salary reduction agreements to establish pre-tax contributions.
– Expenses are reimbursed from pre-tax accounts.
3. Basic Benefits Administration for Group Health Plans:
– EBA handles eligibility tracking, plan enrollments/deletions, billing reconciliation, and employee call center support.
– Monthly provider billings are reconciled with employee coverage and options.
4. All-inclusive service level: Bundled services provided by EBA.
Competitive Comparison:
– Companies such as Benefit Concepts, Trion, The Javers Group, Arbor, ADP, and Ceridian offer partial outsourcing services or target larger clients.
– EBA offers a call center and 25 years of experience in the industry, which sets them apart from the competition.
Sales Literature:
– Brochure outlining services and benefits of outsourcing benefits administrative functions.
– Quarterly newsletter with legal updates, term definitions, and a Q&A section.
– PowerPoint presentation and informational folder for sales presentations.
– Website with benefits information and links to other HR websites.
Fulfillment:
– Client data sheet completed to establish client-specific requirements.
– Relationships initiated with benefit providers.
– Employee data collected and audited against client and provider databases.
Technology:
– EBA uses ASP technology for immediate access to employee data.
– HR software for tracking employee information and generating reports.
– Laptops, DSL access, and high-speed internet crucial for quick data access.
Future Services:
– EBA plans to expand services to include payroll processing and other HR programs.
– Website automation for employee enrollments and changes.
– Broker and agent licenses for additional services.
– National market expansion with a focus on small to medium-sized employers.
Market Analysis Summary:
– Outsourcing benefits administration benefits companies of all sizes.
– EBA targets small to medium-sized employers experiencing changing government regulations and a mobile workforce.
– HR departments face increasing transaction volumes and choose outsourcing to focus on strategic issues.
Target Market Segment Strategy:
– EBA focuses on companies with 10-500 employees and strives to provide high-quality administration and customer service.
– Growing companies must comply with employment laws regardless of their size, necessitating expertise offered by outsourcing.
Market Needs:
– HR transactions expected to increase by 224% by 2006.
– IDC predicts spending on HR outsourcing to reach $10.2 billion by 2003.
– Outsourcing delivers improved services and cost savings.
Human Resource professionals must become strategic partners to help their companies thrive and become employers of choice. Although automation can help with administrative functions, employees still require the personal service of an HR department. As HR departments become swamped with administrative tasks, EBA can step in and provide personal service to employees.
The current trend is for HR professionals to assist companies in basic survival and growth. With low unemployment rates, companies need to focus on recruiting, hiring, and retaining the right people to stay competitive. HR is the key. Once employees are hired, HR needs to prioritize staying competitive by addressing work and life issues and offering up-to-date benefits such as time off and flexible work arrangements. Employee retention is essential for a good return on investment, and HR departments can use outsourcing to handle administrative tasks, freeing them up to focus on more critical functions.
Companies are realizing the strategic value that HR professionals bring to their business. HR must attract, obtain, and retain the workforce to ensure the company’s success. However, with a projected increase in HR administrative transactions of over 200%, HR’s strategic value is at risk. To demonstrate a good return on investment, HR departments must not be bogged down by administration concerns; instead, they should focus on strategic initiatives.
Outsourcing benefits administration can save companies significant time and money. By outsourcing, companies can use their HR professionals for more strategic areas like attracting and retaining qualified employees. Outsourcing also allows companies to provide high-quality services while saving costs. Employee Benefits Administrators (EBA) offers cost-effective benefits administration services that can help companies save both time and money.
EBA’s main focus for marketing will be small to medium-sized employers with under 500 employees. The industry or type of business does not matter. EBA will network with HR professional organizations, attend meetings, and sponsor events to educate companies about their services and build relationships. They will also use direct mailings, informational packets, and brochures to reach potential clients. Additionally, EBA will leverage their website and online presence to market their services to a wider audience.
EBA offers different pricing packages based on each level of service and charges on a per employee per month basis. They also have start-up fees depending on the number of employees. Each level of service is priced comparably to industry standards. By offering a call center to answer employee questions, EBA sets itself apart from competitors and emphasizes the importance of customer service.
A key part of EBA’s value proposition is saving companies both time and money through outsourcing. By outsourcing administrative functions, companies can use their HR professionals for more strategic initiatives. In the Philadelphia region, the average salary of a Benefits Administrator is around $45,000 annually, plus benefits. In comparison, EBA can administer benefit plans for a company with 250 employees for approximately $36,000 annually and a $2,000 start-up fee, resulting in significant cost savings.
EBA’s sales strategy involves prioritizing customer support for clients’ employees and ensuring client satisfaction. By listening to the client’s needs and providing tailored services and reports, EBA aims to make the client’s job easier. They emphasize the bottom-line savings and advantages of outsourcing to sell their services.
The sales forecast is based on obtaining a certain number of clients for each level of service. EBA predicts steady growth in client acquisition for each service offering. As the company grows, marketing strategies will include radio time and advertisements in HR trade journals. EBA will also build relationships with larger HR consulting firms and subcontract its services.
EBA’s value proposition lies in helping companies save both time and money through outsourcing. By contracting with EBA, companies can allocate their HR professionals to more strategic areas and avoid the costs associated with turnover and retraining. EBA’s services are designed to make clients’ jobs easier and provide bottom-line savings.
The sales strategy is focused on customer support and satisfaction. EBA aims to listen to client needs, provide tailored services and reports, and ensure client satisfaction. The forecasted sales figures are based on obtaining a certain number of clients for each service offering. As the company grows, EBA plans to invest in software to track and manage their services, further enhancing their customer support capabilities.
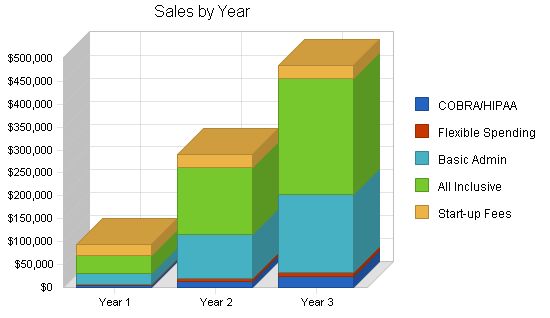
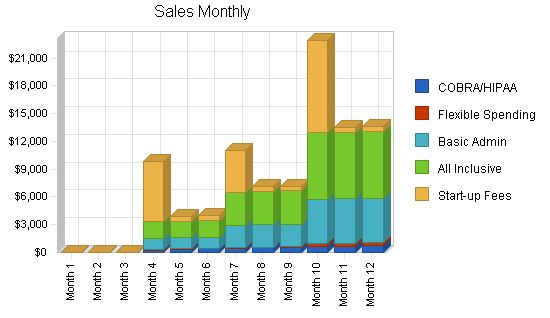
| Sales Forecast | |||
| Year 1 | Year 2 | Year 3 | |
| Unit Sales | |||
| COBRA/HIPAA | 360 | 1,110 | 1,830 |
| Flexible Spending | 180 | 660 | 1,380 |
| Basic Admin | 2,100 | 8,100 | 14,100 |
| All Inclusive | 2,100 | 8,100 | 14,100 |
| Start-up Fees | 240 | 290 | 290 |
| Total Unit Sales | 4,980 | 18,260 | 31,700 |
| Unit Prices | Year 1 | Year 2 | Year 3 |
| COBRA/HIPAA | $12.75 | $12.75 | $12.75 |
| Flexible Spending | $7.50 | $7.50 | $7.50 |
| Basic Admin | $12.00 | $12.00 | $12.00 |
| All Inclusive | $18.00 | $18.00 | $18.00 |
| Start-up Fees | $100.00 | $100.00 | $100.00 |
| Sales | |||
| COBRA/HIPAA | $4,590 | $14,153 | $23,333 |
| Flexible Spending | $1,350 | $4,950 | $10,350 |
| Basic Admin | $25,200 | $97,200 | $169,200 |
| All Inclusive | $37,800 | $145,800 | $253,800 |
| Start-up Fees | $24,000 | $29,000 | $29,000 |
| Total Sales | $92,940 | $291,103 | $485,683 |
| Direct Unit Costs | Year 1 | Year 2 | Year 3 |
| COBRA/HIPAA | $2.75 | $2.75 | $2.75 |
| Flexible Spending | $0.00 | $0.00 | $0.00 |
| Basic Admin | $2.75 | $2.75 | $2.75 |
| All Inclusive | $2.75 | $2.75 | $2.75 |
| Start-up Fees | $0.00 | $0.00 | $0.00 |
| Direct Cost of Sales | |||
| COBRA/HIPAA | $990 | $3,053 | $5,033 |
| Flexible Spending | $0 | $0 | $0 |
| Basic Admin | $5,775 | $22,275 | $38,775 |
| All Inclusive | $5,775 | $22,275 | $38,775 |
| Start-up Fees | $0 | $0 | $0 |
| Subtotal Direct Cost of Sales | $12,540 | $47,603 | $82,583 |
5.5 Strategic Alliances
EBA will depend on alliances with:
- Group Insurance Brokers who provide group benefit plans to employers with less than 500 employees. These brokers speak with clients daily and listen to their needs. Partnering with group brokers is a great strategy, for they can market our services initially without our presence.
- EBA’s Application Service Provider is an outsource provider for Accounting Services. Their clients could possibly become EBA’s clients.
- Accounting Firms — Many small to medium size companies use outside accounting firms to handle their financial transactions and reporting. By affiliating with these firms, EBA can obtain referrals if their clients are in need of employee benefits administration services.
- Chambers of Commerce and other Business Associations — These associations mainly deal with the same size client EBA is targeting. Speaking engagements and networking is a very big marketing and sales tool.
In addition to the strategic alliances, EBA will also be a referral source and advocate of these companies and associations.
5.6 Milestones
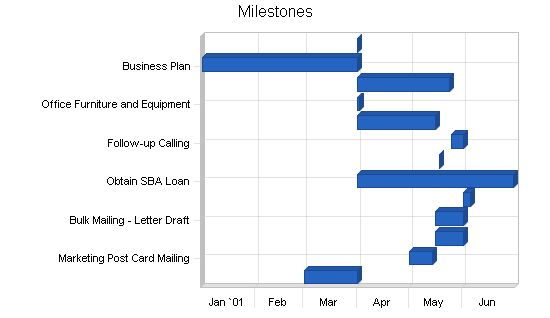
As described in the business plan’s affiliated table, both principals have responsibilities with the milestones which have been set. Most of the initial milestones have been met, with the marketing and follow-up calls still to take place. Both principals are accountable for these milestones.
It should be noted that most of the milestones have been omitted which had a commitment date prior to the office opening in April of 2001. The principals had been talking, planning, and preparing for this for almost a year.
Review:
– Remove the repeated table header.
– Consolidate the table by removing redundant empty cells.
– Remove unnecessary line breaks.
Review:
– Remove redundant information about the principals’ HR backgrounds.
– Remove repetitive mentions of the principals’ professional associations.
– Merge the information about Diane Davis’ HR career into one paragraph.
– Remove redundant information about Ms. Davis’ HR certifications.
Review:
– Remove redundant information about coaching sessions attended by the principals.
Review:
– Remove redundant information about the staffing plan.
– Remove redundant information about staffing preferences.
Review:
– Remove repetitive information about start-up expenses.
– Combine the information about EBA’s financial investments.
– Remove redundant information about obtaining a small business loan.
– Remove repetitive information about sales forecasts.
Review:
– Remove repetitive descriptions of employee levels.
– Reorganize the list of sales forecasts to improve clarity.
Review:
– Remove repetitive explanation of the financial indicators.
Revised text:
Milestones:
| Milestones | |||||
| Milestone | Start Date | End Date | Budget | Manager | Department |
| Obtaining Office Space | 3/1/2001 | 4/1/2001 | $1,200 | Wells | Principal |
| Marketing Post Card Mailing | 5/1/2001 | 5/14/2001 | $75 | Davis | Principal |
| Bulk Mailing – Obtaining Leads | 5/16/2001 | 6/1/2001 | $0 | Wells | Principal |
| Bulk Mailing – Letter Draft | 5/16/2001 | 6/1/2001 | $0 | Wells | Principal |
| Bulk Mailing – Mail Merge and Mailing | 6/1/2001 | 6/5/2001 | $400 | Davis | Principal |
| Obtain SBA Loan | 4/1/2001 | 6/30/2001 | $1,000 | Davis/Wells | Principals |
| Speaking Engagement | 5/18/2001 | 5/18/2001 | $150 | Davis/Wells | Principals |
| Follow-up Calling | 5/25/2001 | 6/1/2001 | $0 | Davis/Wells | Principals |
| Brochures | 4/1/2001 | 5/16/2001 | $500 | Wells | Principal |
| Office Furniture and Equipment | 4/1/2001 | 4/2/2001 | $500 | Wells | Principal |
| Supplies | 4/1/2001 | 5/24/2001 | $400 | Davis/Wells | Principals |
| Business Plan | 1/1/2001 | 4/1/2001 | $150 | Davis | Principal |
| Success | 4/1/2001 | 4/1/2001 | $0 | Davis/Wells | Principals |
| Totals | $4,375 | ||||
Management Summary:
The principals of EBA, Diane Davis and Cindy Wells, have over 25 years of experience in corporate benefits administration, employee relations and communications, and legal compliance. They understand the challenges faced by HR professionals and the importance of knowledge and effective communication in this field.
Cindy Wells has 18 years of experience in Human Resources, including positions in employee benefits, payroll, employee relations, and legal compliance. She has designed and implemented benefit programs in various areas.
Ms. Wells has extensive experience in contract negotiations and supporting employees in multiple locations.
Diane Davis has diverse HR experience since 1989, including senior employee benefits positions. She has a PHR certification and has expanded her HR focus to include generalist duties.
Both Ms. Wells and Ms. Davis have a deep understanding of employee benefits and are committed to providing excellent customer support.
6.1 Management Team Gaps:
The present management team requires professional support for accounting functions, specifically for filing company taxes. An accounting firm has not yet been contracted.
The team plans to obtain administrative and marketing support as the company grows.
6.2 Personnel Plan:
The two principals will initially staff EBA. In 2002, an administrative assistant will be hired in January, a marketer in July, and a benefits administrator in October.
EBA is committed to hiring qualified people with backgrounds in Human Resources and/or Customer Service.
| Personnel Plan | |||
| Year 1 | Year 2 | Year 3 | |
| Production Personnel | |||
| Name or title | $0 | $0 | $0 |
| Name or title | $0 | $0 | $0 |
| Name or title | $0 | $0 | $0 |
| Other | $0 | $0 | $0 |
| Subtotal | $0 | $0 | $0 |
| Sales and Marketing Personnel | |||
| Marketer Part Time | $0 | $18,750 | $25,000 |
| Name or title | $0 | $0 | $0 |
| Name or title | $0 | $0 | $0 |
| Other | $0 | $0 | $0 |
| Subtotal | $0 | $18,750 | $25,000 |
| General and Administrative Personnel | |||
| Cindy Wells | $30,000 | $30,000 | $30,000 |
| Diane Davis | $30,000 | $30,000 | $30,000 |
| Administrative Assistant Part Time | $3,252 | $13,000 | $13,000 |
| Benefits Administrator | $0 | $6,250 | $25,000 |
| Receptionist Part Time | $0 | $0 | $9,750 |
| Benefits Administrator | $0 | $0 | $12,500 |
| Subtotal | $63,252 | $79,250 | $120,250 |
| Other Personnel | |||
| Name or title | $0 | $0 | $0 |
| Name or title | $0 | $0 | $0 |
| Name or title | $0 | $0 | $0 |
| Other | $0 | $0 | $0 |
| Subtotal | $0 | $0 | $0 |
| Total People | 3 | 5 | 7 |
| Total Payroll | $63,252 | $98,000 | $145,250 |
Initially, the principals of Employee Benefits Administrators invested in the business to cover start-up expenses, including office space, equipment, and professional development. Ongoing expenses are currently funded by the principals.
EBA will seek a small business loan to support its growth, preferably guaranteed by the Small Business Association.
EBA is forecasting sales based on its expertise in group benefits, market research, and strategic alliances with brokers and professional associations.
7.1 Important Assumptions:
The financials are based on projected sales figures for four services provided by Employee Benefits Administrators, each with an average client size.
The sales forecast is based on obtaining new clients at a consistent rate for each service.
The direct cost of goods sold is the data storage fee paid to the Application Service Provider.
EBA plans to purchase software to track employee benefits, which will reduce the cost of goods sold for certain clients.
EBA has identified start-up expenses, including advertising, equipment, insurance, software, and various other costs.
Taxes include payroll tax burdens.
| General Assumptions | |||
| Year 1 | Year 2 | Year 3 | |
| Plan Month | 1 | 2 | 3 |
| Current Interest Rate | 9.00% | 9.00% | 9.00% |
| Long-term Interest Rate | 8.
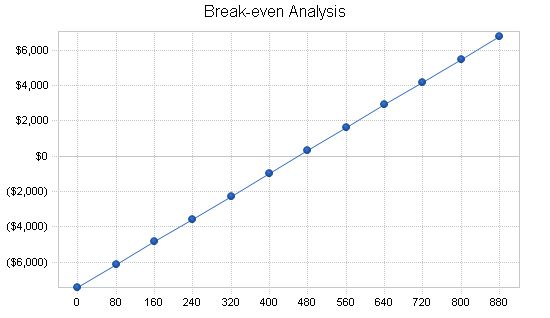
Break-even Analysis The break-even point is determined by estimates and projections in the financials. It is calculated using the average fixed monthly cost, average charge per unit, and variable cost per unit. The table and chart below illustrate this point. It should be noted that the cost of goods sold, which increases with the number of units sold, is included in the fixed monthly cost.
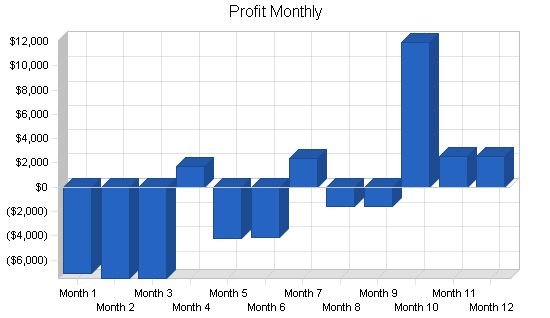
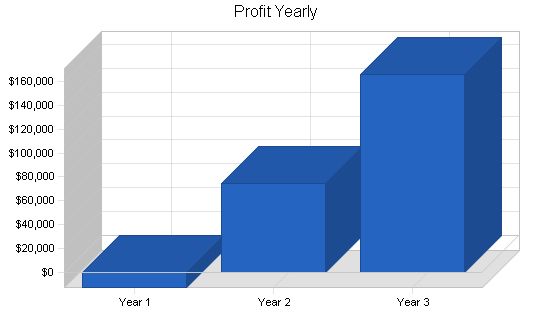
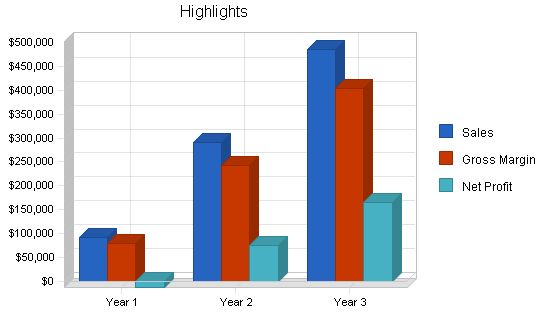
Break-even Analysis Monthly Units Break-even: 460 Monthly Revenue Break-even: $8,586 Assumptions: Average Per-Unit Revenue: $18.66 Average Per-Unit Variable Cost: $2.52 Estimated Monthly Fixed Cost: $7,428 Projected Profit and Loss The projected Profit and Loss for the first three years is shown on the following table. In the first year in business, EBA is expecting a loss. Please note that this first twelve months shows no sales in the first three months as the company is becoming established. Year two shows a net profit, and year three shows a significant increase in profit. These projections are conservative considering this is a service business and can greatly depend on the economy and the level of benefits employers can afford.
Pro Forma Profit and Loss |
||
| Pro Forma Profit and Loss | |||
| Year 1 | Year 2 | Year 3 | |
| Sales | $92,940 | $291,103 | $485,683 |
| Direct Cost of Sales | $12,540 | $47,603 | $82,583 |
| Production Payroll | $0 | $0 | $0 |
| Other | $0 | $0 | $0 |
| Total Cost of Sales | $12,540 | $47,603 | $82,583 |
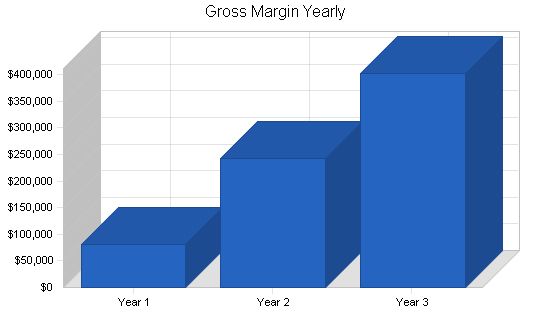
| Gross Margin | $80,400 | $243,500 | $403,100 |
| Gross Margin % | 86.51% | 83.65% | 83.00% |
| Operating Expenses | |||
| Sales and Marketing Expenses | |||
| Sales and Marketing Payroll | $0 | $18,750 | $25,000 |
| Advertising/Promotion | $1,200 | $1,200 | $1,200 |
| Travel | $0 | $0 | $0 |
| Miscellaneous | $600 | $600 | $600 |
| Total Sales and Marketing Expenses | $1,800 | $20,550 | $26,800 |
| Sales and Marketing % | 1.94% | 7.06% | 5.52% |
| General and Administrative Expenses | |||
| General and Administrative Payroll | $63,252 | $79,250 | $120,250 |
| Sales and Marketing and Other Expenses | $0 | $0 | $0 |
| Depreciation | $1,020 | $1,020 | $1,020 |
| Dues and Subscriptions | $1,800 | $1,800 | $1,800 |
| Professional Fees | $600 | $600 | $600 |
| Rent | $7,200 | $7,200 | $7,200 |
| Software Purchases | $0 | $14,000 | $0 |
| Insurance | $1,200 | $1,200 | $1,200 |
| Telephone and Internet Access | $2,400 | $2,400 | $2,400 |
| Utilities | $2,400 | $2,400 | $2,400 |
| Miscellaneous | $2,400 | $2,400 | $2,400 |
| Payroll Taxes | $5,060 | $7,840 | $11,620 |
| Other General and Administrative Expenses | $0 | $0 | $0 |
| Total General and Administrative Expenses | $87,332 | $120,110 | $150,890 |
| General and Administrative % | 93.97% | 41.26% | 31.07% |
| Other Expenses: | |||
| Other Payroll | $0 | $0 | $0 |
| Consultants | $0 | $0 | $0 |
| Contract/Consultants | $0 | $0 | $0 |
| Total Other Expenses | $0 | $0 | $0 |
| Other % | 0.00% | 0.00% | 0.00% |
| Total Operating Expenses | $89,132 | $140,660 | $177,690 |
| Profit Before Interest and Taxes | ($8,732) | $102,840 | $225,410 |
| EBITDA | ($7,712) | $103,860 | $226,430 |
| Interest Expense | $3,897 | $3,632 | $2,957 |
| Taxes Incurred | $0 | $24,802 | $56,540 |
| Net Profit | ($12,629) | $74,406 | $165,913 |
| Net Profit/Sales | -13.59% | 25.56% | 34.16% |
7.5 Projected Cash Flow
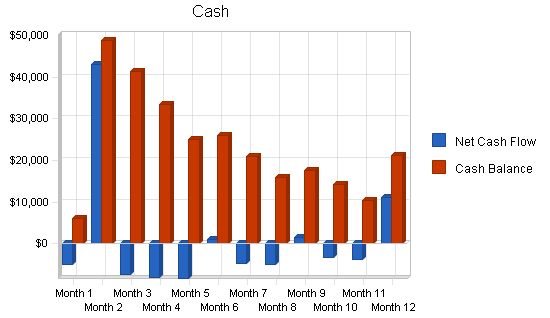
Cash flow projections are demonstrated by the following table and charts. Operating capital is needed and shown as a Current Borrowing capital loan. Cash flow is negative until the projected loan is received in May.
Pro Forma Cash Flow
Year 1 Year 2 Year 3
Cash Received
Cash from Operations
Cash Sales $0 $0 $0
Cash from Receivables $66,324 $234,353 $429,959
Subtotal Cash from Operations $66,324 $234,353 $429,959
Additional Cash Received
Sales Tax, VAT, HST/GST Received $0 $0 $0
New Current Borrowing $50,000 $0 $0
New Other Liabilities (interest-free) $0 $0 $0
New Long-term Liabilities $0 $0 $0
Sales of Other Current Assets $0 $0 $0
Sales of Long-term Assets $0 $0 $0
New Investment Received $0 $0 $0
Subtotal Cash Received $116,324 $234,353 $429,959
Expenditures
Year 1 Year 2 Year 3
Expenditures from Operations
Cash Spending $63,252 $98,000 $145,250
Bill Payments $36,627 $112,674 $168,911
Subtotal Spent on Operations $99,879 $210,674 $314,161
Additional Cash Spent
Sales Tax, VAT, HST/GST Paid Out $0 $0 $0
Principal Repayment of Current Borrowing $6,150 $7,000 $8,000
Other Liabilities Principal Repayment $0 $0 $0
Long-term Liabilities Principal Repayment $0 $0 $0
Purchase Other Current Assets $0 $0 $0
Purchase Long-term Assets $0 $0 $0
Dividends $0 $0 $0
Subtotal Cash Spent $106,029 $217,674 $322,161
Net Cash Flow $10,295 $16,679 $107,798
Cash Balance $21,295 $37,973 $145,771
7.6 Projected Balance Sheet
The projected balance sheet follows.
Pro Forma Balance Sheet
Year 1 Year 2 Year 3
Assets
Current Assets
Cash $21,295 $37,973 $145,771
Accounts Receivable $26,616 $83,366 $139,090
Other Current Assets $0 $0 $0
Total Current Assets $47,911 $121,340 $284,861
Long-term Assets
Long-term Assets $0 $0 $0
Accumulated Depreciation $1,020 $2,040 $3,060
Total Long-term Assets ($1,020) ($2,040) ($3,060)
Total Assets $46,891 $119,300 $281,801
Liabilities and Capital
Year 1 Year 2 Year 3
Current Liabilities
Accounts Payable $4,670 $9,672 $14,260
Current Borrowing $43,850 $36,850 $28,850
Other Current Liabilities $0 $0 $0
Subtotal Current Liabilities $48,520 $46,522 $43,110
Long-term Liabilities $0 $0 $0
Total Liabilities $48,520 $46,522 $43,110
Paid-in Capital $31,428 $31,428 $31,428
Retained Earnings ($20,428) ($33,057) $41,350
Earnings ($12,629) $74,406 $165,913
Total Capital ($1,629) $72,778 $238,691
Total Liabilities and Capital $46,891 $119,300 $281,801
Net Worth ($1,629) $72,778 $238,691
7.7 Business Ratios
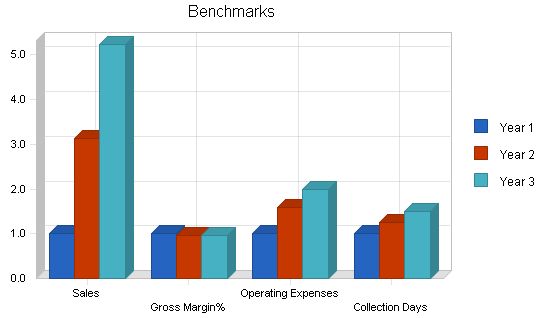
Table of business ratios follows. A comparison of Industry standard ratios is provided based on Standard Industrial Classification code, 8741, Management Services.
Ratio Analysis
Year 1 Year 2 Year 3 Industry Profile
Sales Growth 0.00% 213.22% 66.84% 8.50%
Percent of Total Assets
Accounts Receivable 56.76% 69.88% 49.36% 25.80%
Other Current Assets 0.00% 0.00% 0.00% 46.60%
Total Current Assets 102.18% 101.71% 101.09% 76.40%
Long-term Assets -2.18% -1.71% -1.09% 23.60%
Total Assets 100.00% 100.00% 100.00% 100.00%
Current Liabilities
Accounts Payable 103.47% 39.00% 15.30% 44.00%
Long-term Liabilities 0.00% 0.00% 0.00% 17.30%
Total Liabilities 103.47% 39.00% 15.30% 61.30%
Net Worth -3.47% 61.00% 84.70% 38.70%
Percent of Sales
Sales 100.00% 100.00% 100.00% 100.00%
Gross Margin 86.51% 83.65% 83.00% 0.00%
Selling, General & Administrative Expenses 100.10% 58.17% 48.80% 82.30%
Advertising Expenses 1.29% 0.41% 0.25% 1.30%
Profit Before Interest and Taxes -9.40% 35.33% 46.41% 2.40%
Main Ratios
Current 0.99 2.61 6.61 1.56
Quick 0.99 2.61 6.61 1.21
Total Debt to Total Assets 103.47% 39.00% 15.30% 61.30%
Pre-tax Return on Net Worth 775.34% 136.32% 93.20% 3.90%
Pre-tax Return on Assets -26.92% 83.16% 78.94% 10.20%
Additional Ratios
Year 1 Year 2 Year 3
Net Profit Margin -13.59% 25.56% 34.16% n.a
Return on Equity 0.00% 102.24% 69.51% n.a
Activity Ratios
Accounts Receivable Turnover 3.49 3.49 3.49 n.a
Collection Days 56 69 84 n.a
Accounts Payable Turnover 8.84 12.17 12.17 n.a
Payment Days 27 22 25 n.a
Total Asset Turnover 1.98 2.44 1.72 n.a
Debt Ratios
Year 1 Year 2 Year 3
Debt to Net Worth 0.00 0.64 0.18 n.a
Current Liab. to Liab. 1.00 1.00 1.00 n.a
Liquidity Ratios
Year 1 Year 2 Year 3
Net Working Capital ($609) $74,818 $241,751 n.a
Interest Coverage -2.24 28.32 76.24 n.a
Additional Ratios
Year 1 Year 2 Year 3
Assets to Sales 0.50 0.41 0.58 n.a
Current Debt/Total Assets 103% 39% 15% n.a
Acid Test 0.44 0.82 3.38 n.a
Sales/Net Worth 0.00 4.00 2.03 n.a
Dividend Payout 0.00 0.00 0.00 n.a
Appendix
Sales Forecast
| Month 1 | Month 2 | Month 3 | Month 4 | Month 5 | Month 6 | Month 7 | Month 8 | Month 9 | Month 10 | Month 11 | Month 12 | |
| 0 | 0 | 0 | 20 | 25 | 30 | 35 | 40 | 45 | 50 | 55 | 60 | |
| 0 | 0 | 0 | 10 | 10 | 10 | 10 | 10 | 10 | 40 | 40 | 40 | |
| 0 | 0 | 0 | 100 | 100 | 100 | 200 | 200 | 200 | 400 | 400 | 400 | |
| 0 | 0 | 0 | 100 | 100 | 100 | 200 | 200 | 200 | 400 | 400 | 400 | |
| 0 | 0 | 0 | 65 | 5 | 5 | 45 | 5 | 5 | 100 | 5 | 5 | |
| Total Unit Sales | 0 | 0 | 0 | 295 | 240 | 245 | 490 | 455 | 460 | 990 | 900 | 905 |
Unit Prices
| Month 1 | Month 2 | Month 3 | Month 4 | Month 5 | Month 6 | Month 7 | Month 8 | Month 9 | Month 10 | Month 11 | Month 12 |
| $12.75 | $12.75 | $12.75 | $12.75 | $12.75 | $12.75 | $12.75 | $12.75 | $12.75 | $12.75 | $12.75 | $12.75 |
| $7.50 | $7.50 | $7.50 | $7.50 | $7.50 | $7.50 | $7.50 | $7.50 | $7.50 | $7.50 | $7.50 | $7.50 |
| $12.00 | $12.00 | $12.00 | $12.00 | $12.00 | $12.00 | $12.00 | $12.00 | $12.00 | $12.00 | $12.00 | $12.00 |
| $18.00 | $18.00 | $18.00 | $18.00 | $18.00 | $18.00 | $18.00 | $18.00 | $18.00 | $18.00 | $18.00 | $18.00 |
| $100.00 | $100.00 | $100.00 | $100.00 | $100.00 | $100.00 | $100.00 | $100.00 | $100.00 | $100.00 | $100.00 | $100.00 |
Sales
| Month 1 | Month 2 | Month 3 | Month 4 | Month 5 | Month 6 | Month 7 | Month 8 | Month 9 | Month 10 | Month 11 | Month 12 | |
| $0 | $0 | $0 | $255 | $319 | $383 | $446 | $510 | $574 | $638 | $701 | $765 | |
| $0 | $0 | $0 | $75 | $75 | $75 | $75 | $75 | $75 | $300 | $300 | $300 | |
| $0 | $0 | $0 | $1,200 | $1,200 | $1,200 | $2,400 | $2,400 | $2,400 | $4,800 | $4,800 | $4,800 | |
| $0 | $0 | $0 | $1,800 | $1,800 | $1,800 | $3,600 | $3,600 | $3,600 | $7,200 | $7,200 | $7,200 | |
| $0 | $0 | $0 | $6,500 | $500 | $500 | $4,500 | $500 | $500 | $10,000 | $500 | $500 | |
| Total Sales | $0 | $0 | $0 | $9,830 | $3,894 | $3,958 | $11,021 | $7,085 | $7,149 | $22,938 | $13,501 | $13,565 |
Personnel Plan
| Month 1 | Month 2 | Month 3 | Month 4 | Month 5 | Month 6 | Month 7 | Month 8 | Month 9 | Month 10 | Month 11 | Month 12 | |
| $0 | $0 | $0 | ||||||||||
| Month 1 | Month 2 | Month 3 | Month 4 | Month 5 | Month 6 | Month 7 | Month 8 | Month 9 | Month 10 | Month 11 | Month 12 | |
| Plan Month | 1 | 2 | 3 | 4 | 5 | 6 | 7 | 8 | 9 | 10 | 11 | 12 |
| Current Interest Rate | 9.00% | 9.00% | 9.00% | 9.00% | 9.00% | 9.00% | 9.00% | 9.00% | 9.00% | 9.00% | 9.00% | 9.00% |
| Long-term Interest Rate | 8.00% | 8.00% | 8.00% | 8.00% | 8.00% | 8.00% | 8.00% | 8.00% | 8.00% | 8.00% | 8.00% | 8.00% |
| Tax Rate | 30.00% | 25.00% | 25.00% | 25.00% | 25.00% | 25.00% | 25.00% | 25.00% | 25.00% | 25.00% | 25.00% | 25.00% |
| Other | 0 | 0 | 0 | 0 | 0 | 0 | 0 | 0 | 0 | 0 | 0 | 0 |
| Pro Forma Profit and Loss | ||||||||||||
| Month 1 | Month 2 | Month 3 | Month 4 | Month 5 | Month 6 | Month 7 | Month 8 | Month 9 | Month 10 | Month 11 | Month 12 | |
| Sales | $0 | $0 | $0 | $9,830 | $3,894 | $3,958 | $11,021 | $7,085 | $7,149 | $22,938 | $13,501 | $13,565 |
| Direct Cost of Sales | $0 | $0 | $0 | $605 | $619 | $633 | $1,196 | $1,210 | $1,224 | $2,338 | $2,351 | $2,365 |
| Production Payroll | $0 | $0 | $0 | $0 | $0 | $0 | $0 | $0 | $0 | $0 | $0 | $0 |
| Other | $0 | $0 | $0 | $0 | $0 | $0 | $0 | $0 | $0 | $0 | $0 | $0 |
| Total Cost of Sales | $0 | $0 | $0 | $605 | $619 | $633 | $1,196 | $1,210 | $1,224 | $2,338 | $2,351 | $2,365 |
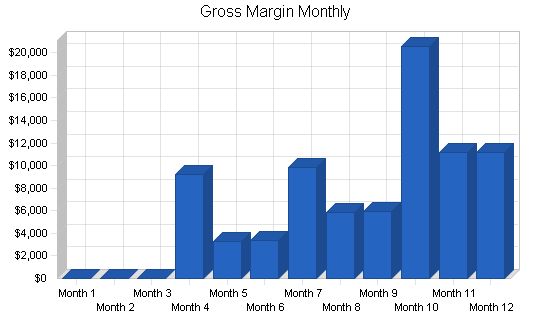
| Gross Margin | $0 | $0 | $0 | $9,225 | $3,275 | $3,325 | $9,825 | $5,875 | $5,925 | $20,600 | $11,150 | $11,200 |
| Gross Margin % | 0.00% | 0.00% | 0.00% | 93.85% | 84.11% | 84.02% | 89.15% | 82.92% | 82.88% | 89.81% | 82.58% | 82.57% |
| Operating Expenses | ||||||||||||
| Sales and Marketing Expenses | ||||||||||||
| Sales and Marketing Payroll | $0 | $0 | $0 | $0 | $0 | $0 | $0 | $0 | $0 | $0 | $0 | $0 |
| Advertising/Promotion | $100 | $100 | $100 | $100 | $100 | $100 | $100 | $100 | $100 | $100 | $100 | $100 |
| Travel | $0 | $0 | $0 | $0 | $0 | $0 | $0 | $0 | $0 | $0 | $0 | $0 |
| Miscellaneous | $50 | $50 | $50 | $50 | $50 | $50 | $50 | $50 | $50 | $50 | $50 | $50 |
| Total Sales and Marketing Expenses | $150 | $150 | $150 | $150 | $150 | $150 | $150 | $150 | $150 | $150 | $150 | $150 |
| Sales and Marketing % | 0.00% | 0.00% | 0.00% | 1.53% | 3.85% | 3.79% | 1.36% | 2.12% | 2.10% | 0.65% | 1.11% | 1.11% |
| General and Administrative Expenses | ||||||||||||
| General and Administrative Payroll | $5,000 | $5,000 | $5,000 | $5,000 | $5,000 | $5,000 | $5,000 | $5,000 | $5,000 | $6,084 | $6,084 | $6,084 |
| Sales and Marketing and Other Expenses | $0 | $0 | $0 | $0 | $0 | $0 | $0 | $0 | $0 | $0 | $0 | $0 |
| Depreciation | $85 | $85 | $85 | $85 | $85 | $85 | $85 | $85 | $85 | $85 | $85 | $85 |
| Dues and Subscriptions | $150 | $150 | $150 | $150 | $150 | $150 | $150 | $150 | $150 | $150 | $150 | $150 |
| Professional Fees | $50 | $50 | $50 | $50 | $50 | $50 | $50 | $50 | $50 | $50 | $50 | $50 |
| Rent | $600 | $600 | $600 | $600 | $600 | $600 | $600 | $600 | $600 | $600 | $600 | $600 |
| Software Purchases | $0 | $0 | $0 | $0 | $0 | $0 | $0 | $0 | $0 | $0 | $0 | $0 |
| Insurance | $100 | $100 | $100 | $100 | $100 | $100 | $100 | $100 | $100 | $100 |
Cash Received Cash from Operations Cash Sales Cash from Receivables Subtotal Cash from Operations Additional Cash Received Sales Tax, VAT, HST/GST Received New Current Borrowing New Other Liabilities (interest-free) New Long-term Liabilities Sales of Other Current Assets Sales of Long-term Assets New Investment Received Subtotal Cash Received Expenditures Expenditures from Operations Cash Spending Bill Payments Subtotal Spent on Operations Additional Cash Spent Sales Tax, VAT, HST/GST Paid Out Principal Repayment of Current Borrowing Other Liabilities Principal Repayment Long-term Liabilities Principal Repayment Purchase Other Current Assets Purchase Long-term Assets Dividends Subtotal Cash Spent Net Cash Flow Cash Balance Pro Forma Balance Sheet Assets Starting Balances Current Assets Cash Accounts Receivable Other Current Assets Total Current Assets Long-term Assets Long-term Assets Accumulated Depreciation Total Long-term Assets Total Assets Liabilities and Capital Current Liabilities Accounts Payable Current Borrowing Other Current Liabilities Subtotal Current Liabilities Long-term Liabilities Total Liabilities Paid-in Capital Retained Earnings Earnings Total Capital Total Liabilities and Capital Net Worth
Business Plan Outline– Services – Market Analysis Summary – Strategy and Implementation Summary – Management Summary – Financial Plan – Appendix |
Hello!
I’m Andrew Brooks, a seasoned finance consultant from the USA and the mind behind phonenumber247.com.
My career is built on a foundation of helping individuals and businesses thrive financially in an ever-changing economic landscape. At phonenumber247.com, my aim is to demystify the complex world of finance, providing clear, actionable advice that can help you navigate your financial journey with confidence. Whether it’s personal finance management, investment strategies, or understanding the nuances of market dynamics, I’m here to share insights and tools that can propel you towards your financial goals.
Welcome to my digital space, where every piece of advice is a step closer to financial clarity and success!

