Call Center Business Plan
Vashon Solicitation Services aims to provide clients with high-quality call center services 24/7. Our goal is to maximize communication between our clients and their customers. Our services cover both B2B and B2C interactions, handling inbound and outbound calls. With a team of well-trained customer support specialists, we consistently deliver excellent and cost-effective services, catering to various customer relations objectives such as lead generation, order taking, ad response, market research, and general information requests.
The Company:
Vashon Solicitation Services is a limited liability partnership registered in Delaware. Our founder, Mr. Martin Gibbs, has gathered a group of highly respected telemarketing and customer relations specialists with a combined 35 years of experience in the industry. Our main offices are located in Gig Harbor, Washington, equipped with office spaces, conference rooms, and a phone center. We plan to commence operations in June of Year 1, with a select group of private investors and no plans for going public.
The Services:
Vashon offers a wide range of call center services, providing bilingual support in English and Spanish. We specialize in:
– Sales lead generation
– Appointment setting
– Market research
– Surveys (including statistical analysis and political surveys)
– First-level help desk
– Database and mailing list information
– Business development
– Point-of-sale product promotion
– Seminar and conference invitations
We emphasize that we are not a telemarketing company and do not create marketing campaigns for our clients. Many companies prefer to develop their own campaigns due to existing marketing personnel and industry expertise.
The Market:
The telemarketing industry is experiencing growth, with annual industry growth rates ranging from 6.5% to 8%. This growth is driven by businesses recognizing the importance of market information and the need to reduce customer turnover rates in a challenging economy. A significant trend is the increasing number of companies outsourcing telemarketing functions to specialized firms rather than building in-house infrastructure. This presents a promising opportunity for Vashon Solicitation Services. However, long-term analysis reveals cyclical patterns in industry growth rates, and we anticipate a reduction in the current high growth rate.
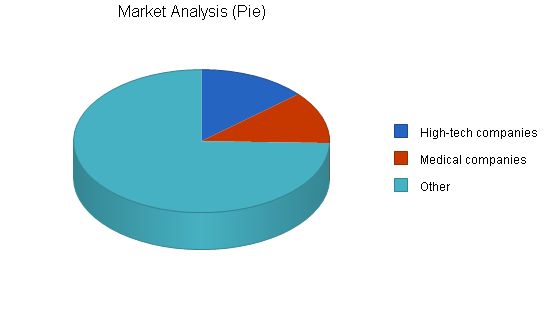
Vashon plans to target two market segments: the medical services industry, which requires constant patient communication, and small high-tech companies in need of a first-level help desk. Additionally, we will undertake short-term projects such as surveys for small clients.
Financial Considerations:
Please refer to the tables accompanying the Start-up Summary section for an overview of the start-up assets and expenses required. The company’s liabilities primarily consist of investments from private investors and management. We have secured borrowing from Bank of America Commercial Investments, with principal repayment scheduled over two years. A long-term loan through Charter Bank of Tillamook will be repaid over ten years. Furthermore, we have a line of credit from Viking Bank available if needed. We expect profitability to be achieved in year two and do not foresee significant cash flow difficulties. We conservatively estimate that three ongoing contracts per month during the initial three years will ensure a break-even point.
Contents
1.1 Keys to Success
Vashon’s keys to long-term survivability and profitability are:
- Create long-term contracts that require constant monitoring or on-call services.
- Keep close contact with clients and establish a well-functioning long-term relationship with them to generate repeat business and obtain a top-notch reputation.
- Establish a comprehensive service experience for our clients that includes consultation, progress reports, and post-program feedback.
1.2 Mission
The mission of VSS is to provide top-quality call center services 24/7 that have the greatest chance of communicating with end customers. We offer B2B and B2C services, including both inbound and outbound calls. Our customer support specialists are dedicated and well-trained, consistently delivering excellent services in a timely and cost-effective manner.
Whatever a client’s customer relations goals may be, such as quantifying sales leads, taking orders, responding to ad inquiries, conducting market research, or handling general information requests, VSS has the expertise to professionally service those needs.
1.3 Objectives
The three-year goals for Vashon Solicitation Services LLC (VSS) are:
- Achieve break-even by year two.
- Establish long-term contracts with at least four clients.
- Attain a minimum 95% customer satisfaction rate to form long-term relationships with our clients and create word-of-mouth marketing.
Company Summary
VSS is a limited liability partnership registered in Delaware for tax purposes. Its founder, Mr. Martin Gibbs, is a former telemarketing head with Medfone, Inc. Mr. Gibbs has assembled a highly respected group of telemarketing and customer relations specialists who collectively possess 35 years of experience in this field.
The company has private investors and does not plan to go public. Its main offices are located in Gig Harbor, Washington, and include office spaces, conference rooms, and a phone center. The company expects to start offering its services in June of Year 1.
The company’s main clients will be businesses that require extensive communication with their clients, including medical services and companies seeking to outsource first-level help desk support. By focusing on such institutions with specialized needs, we believe we can better serve our clients and provide a superior service compared to other call center firms.
2.1 Start-up Summary
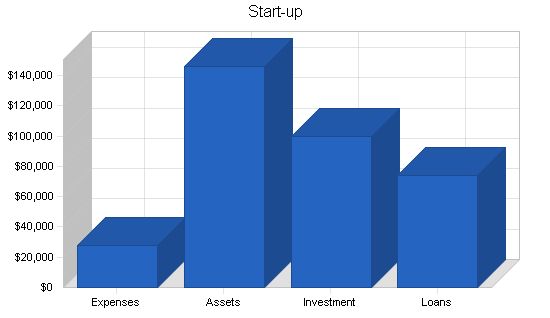
The start-up assets required are shown in the tables below. This includes expenses and the cash needed to support operations until revenues reach an acceptable level. Most of the company’s liabilities will come from outside private investors and management investment. However, we have obtained a current borrowing from Bank of America Commercial Investments, with the principal expected to be paid off in two years. We also have a long-term loan through Charter Bank of Tillamook, to be paid off in ten years. Additionally, we have a line of credit from Viking Bank that we can utilize if necessary.
START-UP
Requirements
Start-up Expenses
– Legal: $2,000
– Insurance: $1,000
– Utilities: $200
– Rent: $3,000
– Accounting and bookkeeping fees: $2,000
– Expensed equipment: $8,000
– Advertising: $3,500
– Other: $8,000
Total Start-up Expenses: $27,700
Start-up Assets
– Cash Required: $117,800
– Other Current Assets: $3,500
– Long-term Assets: $25,000
Total Assets: $146,300
Total Requirements: $174,000
Start-up Funding
Start-up Expenses to Fund: $27,700
Start-up Assets to Fund: $146,300
Total Funding Required: $174,000
Assets
– Non-cash Assets from Start-up: $28,500
– Cash Requirements from Start-up: $117,800
– Additional Cash Raised: $0
– Cash Balance on Starting Date: $117,800
Total Assets: $146,300
Liabilities and Capital
Liabilities
– Current Borrowing: $16,000
– Long-term Liabilities: $55,000
– Accounts Payable (Outstanding Bills): $3,000
– Other Current Liabilities (interest-free): $0
Total Liabilities: $74,000
Capital
– Planned Investment:
– Mr. Martin Gibbs: $25,000
– Ms. Mary Stuart: $20,000
– Mr. Henry Hannover: $20,000
– Mr. Nicolas Caput: $8,000
– Others: $27,000
Total Planned Investment: $100,000
Loss at Start-up (Start-up Expenses): ($27,700)
Total Capital: $72,300
Total Capital and Liabilities: $146,300
Total Funding: $174,000
2.2 Company Ownership
The company will have outside private investors who will own 27% of the company’s shares. The rest will be owned by the senior management, including Mr. Martin Gibbs (25%), Ms. Mary Stuart (20%), Mr. Henry Hannover (20%), and Mr. Nicholas Caput (8%). Other financing will come from loans.
Services
Vashon offers call center services, including inbound and outbound calls. We provide bilingual services in English and Spanish. The common needs for call centers are:
– Generate sales leads
– Set appointments
– Market research
– Surveys (including statistical analysis and political surveys)
– First level help desk
– Database or mailing list information
– Point-of-sale product promotion
– Seminar and conference invitations
VSS is not a telemarketing company. We do not create marketing campaigns for our clients. Many companies prefer to create their own campaigns since they have marketing personnel with industry experience. However, the costs of carrying out such a campaign can be prohibitive, and developing the infrastructure to do so diverts management and resources from primary duties. VSS connects clients with telemarketing companies or implements campaigns for clients based on their goals, scope, length, and costs.
Market Analysis Summary
The telemarketing industry is growing, with most companies experiencing annual growth between 6.5% and 8%. Businesses are increasingly aware of the need for market information and the desire to reduce customer turnover rates in a hard-hit economy. Many companies outsource telemarketing functions instead of developing infrastructure in-house. This presents an opportunity for VSS. However, long-term growth rates in this industry show a cyclical pattern, and VSS does not expect this high growth rate to continue.
The telemarketing industry is fragmented, with companies varying in size, scope, services offered, and market share. Many companies are general advertising agencies that offer telemarketing services along with other consulting services. Additionally, some companies choose to develop their own telemarketing services without realizing the advantages of outsourcing.
VSS plans to enter two market segments. We will work in the medical services industry and serve as a first-level help desk for small high-tech companies. Mr. Gibbs and Ms. Stuart have already signed contracts with Evergreen Medical and Sno-net, Inc. We will also take on short-term projects, such as surveys, from small clients.
Our ultimate goal is to service the entire west coast region and gain a dominant market share. The initial focus will be on businesses within the state of Washington for the first four to five years.
Market Analysis
4.2 Service Business Analysis
The telemarketing industry is growing, with companies experiencing annual growth between 6.5% and 8%. This is due to businesses becoming more aware of the need for market information and the desire to reduce customer turnover in a struggling economy. However, long-term growth analysis shows a cyclical pattern, and VSS does not expect this high growth rate to continue.
The telemarketing industry is fragmented, with companies varying in size, scope, services offered, and market share. Many companies are general advertising agencies that also offer telemarketing services along with other consulting services. Additionally, some companies choose to develop their own telemarketing services instead of outsourcing.
VSS believes that the greatest threat at the moment is new entrants to the market, particularly pre-existing advertising agencies looking to enter new sub-markets. However, new entrants face significant switching costs and a learning curve, as well as start-up costs associated with creating a call center.
Rivalry among call center agencies is intense, as the industry is mature with moderate long-term growth. The threat of clients backwardly integrating to have all advertising done in-house increases competition among firms. Vashon’s management must always consider this when offering services and setting prices.
4.2.1 Competition and Buying Patterns
Competition includes all potential call centers and telemarketing agencies across the country, as well as organizations that handle their telemarketing in-house. The greatest threat comes from the largest telemarketing agencies, such as Crouch & Weasley and Berman Telemarketing, which hold significant market share. The call center industry is highly fragmented, with large companies seeking contracts from major corporations and smaller companies catering to small firms. Vashon’s focused strategy aims to avoid price wars and other drawbacks present in a highly competitive environment.
Companies typically enter into contracts with call center firms based on their reputation for professionalism and effective campaigns. Price and scope are also important factors, especially for smaller companies.
Strategy and Implementation Summary
Vashon Solicitation Services’ business strategy is to focus on providing high-quality call center services, specializing in telemarketing campaigns and help desk functions. This differentiated and focused approach allows the company to charge higher profit margins.
Vashon has already secured two contracts with local companies for 24-hour call center services, providing initial revenue and the opportunity to build a reputation. Testimonials from these clients will be used to attract further contracts. The company employs various marketing methods, including flyers, cold calls, B2B contacts, and attending conventions and events.
Sales Strategy
Vashon’s management aims to leverage their established reputations and contacts in the telemarketing industry to generate contracts. Lowering costs in the first couple of years may be necessary to attract new customers. Additionally, the company is actively seeking a large contract with National Conventions & Events, which would further enhance its revenue.
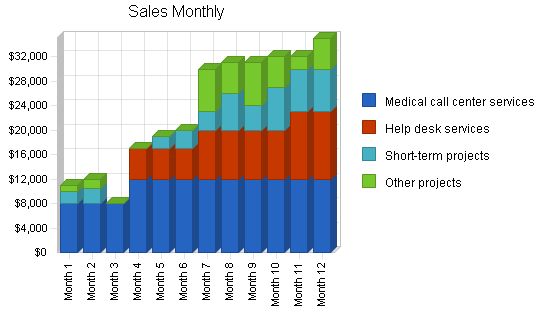
Sales are based on anticipated contracts in various market segments. Revenues are calculated based on average costs per project/contract, considering estimated time and complexity, plus an undisclosed profit margin. The company does not have significant direct costs of sales. The most attractive target markets, medical services, and help desk clients, are expected to provide significant early revenue, with an increasing percentage of short-term and other projects over time.
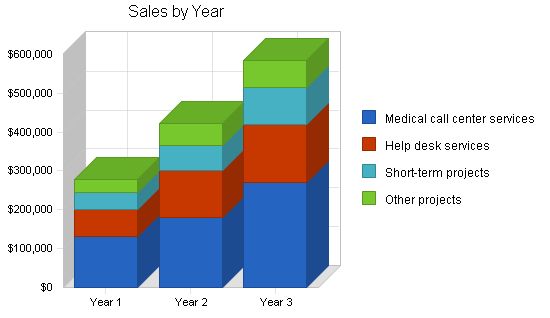
Sales Forecast
| Sales Forecast | |||
| Year 1 | Year 2 | Year 3 | |
| Sales | |||
| Medical call center services | $132,000 | $180,000 | $270,000 |
| Help desk services | $69,000 | $120,000 | $150,000 |
| Short-term projects | $43,500 | $65,000 | $96,000 |
| Other projects | $33,500 | $58,000 | $69,000 |
| Total Sales | $278,000 | $423,000 | $585,000 |
Management Summary
The company will have four officers: President Mr. Martin Gibbs, Head of Operations Mr. Nicholas Caput, and Ms. Stuart who will handle finances and general admin. Additionally, 12 customer service representatives will be employed. As we continue to secure more contracts, the company intends to hire more service representatives and administrative personnel.
6.1 Personnel
Vashon’s management brings strong capabilities in contract negotiation, project management, and telemarketing. Mr. Martin Gibbs graduated from the University of Missouri in 1971 with a business degree. He has extensive experience in marketing, telemarketing, and project management. In 1996, he obtained a graduate degree in marketing from the University of Washington. Mr. Gibbs spent the last four years as the telemarketing department head with Medfone, Inc.
Mr. Nicholas Caput graduated from Arizona State University in 1975 with a bachelors degree in marketing. From 1978-1988, he worked for Nelson Marketing Consultants, and in 1989 he joined Anderson Consulting as a project manager.
Personnel Plan
| Personnel Plan | |||
| Year 1 | Year 2 | Year 3 | |
| Mr. Martin Gibbs – President | $36,000 | $36,000 | $60,000 |
| Ms. Mary Stuart – Office Manager | $36,000 | $36,000 | $60,000 |
| Mr. Nicholas Caput – Operations | $36,000 | $36,000 | $36,000 |
| Customer service representatives | $101,050 | $203,000 | $203,000 |
| Total People | 19 | 27 | 27 |
| Total Payroll | $209,050 | $311,000 | $359,000 |
Our financial plan accounts for two years of negative profits as we establish sales volume. We have allocated sufficient investment to cover these losses and have access to a credit line if sales fall short of expectations.
7.1 Important Assumptions
Approximately 75% of our sales will be on credit, and we have calculated an average interest rate of 10%. These assumptions are considered conservative to account for potential errors in our predictions.
General Assumptions
| General Assumptions | |||
| Year 1 | Year 2 | Year 3 | |
| Plan Month | 1 | 2 | 3 |
| Current Interest Rate | 10.00% | 10.00% | 10.00% |
| Long-term Interest Rate | 10.00% | 10.00% | 10.00% |
| Tax Rate | 30.00% | 30.00% | 30.00% |
| Other | 0 | 0 | 0 |
7.2 Break-even Analysis
Our break-even analysis is based on the assumption that our gross margin is approximately 100%, resulting in negligible direct cost of sales. However, as each contract varies in scope, length, and complexity, it is challenging to determine an average revenue per unit. Nonetheless, during the first three years, we anticipate moderate profitability per month per segment, considering our initial focus on smaller companies with smaller contracts. We project that securing approximately three ongoing contracts per month will ensure a break-even point.
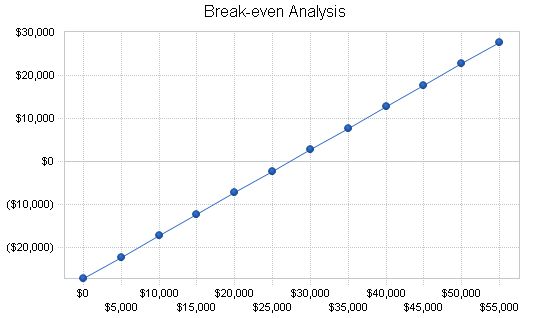
Break-even Analysis
Monthly Revenue Break-even: $27,234
Assumptions:
– Average Percent Variable Cost: 0%
– Estimated Monthly Fixed Cost: $27,234
7.3 Projected Profit and Loss
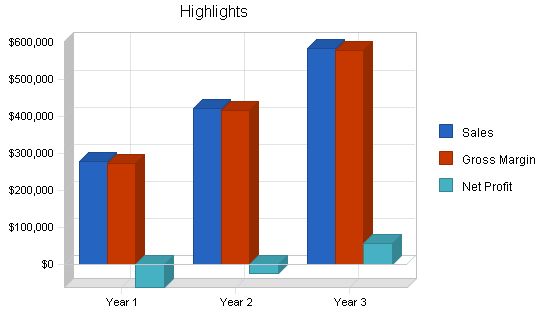
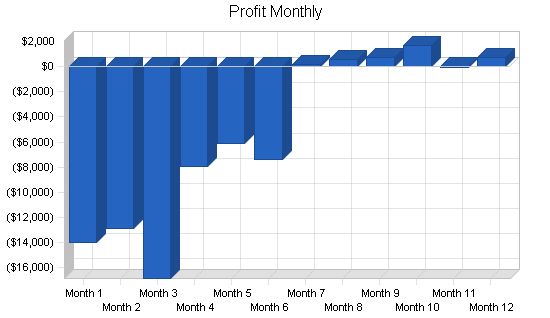
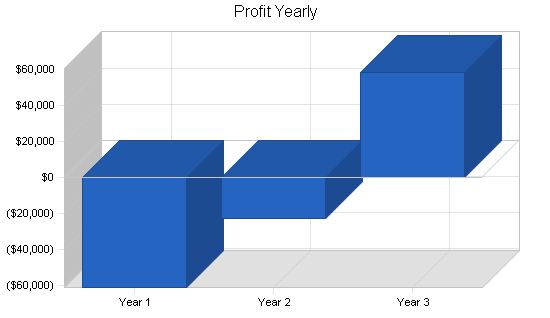
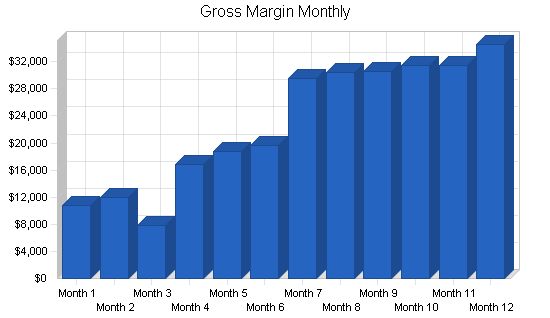
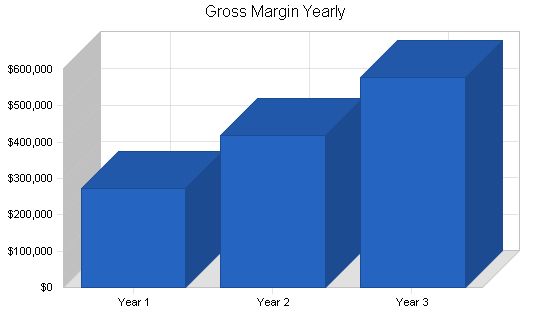
The table below outlines our revenues and costs. We anticipate higher expenses in marketing and advertising compared to our competitors, as we focus on increasing sales volume. As detailed in the table in the Appendix, we forecast monthly profits to commence in December 2003.
Pro Forma Profit and Loss
Year 1 Year 2 Year 3
Sales $278,000 $423,000 $585,000
Direct Cost of Sales $0 $0 $0
Other Costs of Sales $4,300 $6,000 $6,000
Total Cost of Sales $4,300 $6,000 $6,000
Gross Margin $273,700 $417,000 $579,000
Gross Margin % 98.45% 98.58% 98.97%
Expenses
Payroll $209,050 $311,000 $359,000
Sales and Marketing and Other Expenses $18,000 $10,000 $10,000
Depreciation $0 $0 $2,500
Rent $18,000 $18,000 $18,000
Utilities $7,200 $8,000 $9,000
Insurance $13,200 $14,000 $15,000
Payroll Taxes $31,358 $46,650 $53,850
Travel $12,000 $8,000 $4,000
Other $18,000 $15,000 $15,000
Total Operating Expenses $326,808 $430,650 $486,350
Profit Before Interest and Taxes ($53,108) ($13,650) $92,650
EBITDA ($53,108) ($13,650) $95,150
Interest Expense $8,183 $9,400 $9,100
Taxes Incurred $0 $0 $25,065
Net Profit ($61,291) ($23,050) $58,485
Net Profit/Sales -22.05% -5.45% 10.00%
7.4 Projected Cash Flow
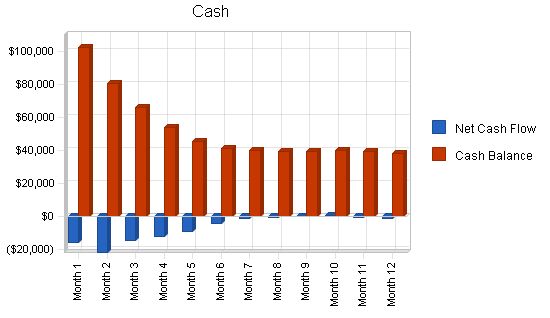
The following is our cash flow chart and diagram. We do not expect any short-term cash flow problems despite operating at a loss for the first nine months. Our short-term loan will be repaid in two equal payments in 2004-2005. Our long-term loan will be paid off in ten years.
Pro Forma Cash Flow
Year 1 Year 2 Year 3
Cash Received
Cash from Operations
Cash Sales $69,500 $105,750 $146,250
Cash from Receivables $159,050 $291,458 $409,934
Subtotal Cash from Operations $228,550 $397,208 $556,184
Additional Cash Received
Sales Tax, VAT, HST/GST Received $0 $0 $0
New Current Borrowing $20,000 $6,000 $0
New Other Liabilities (interest-free) $0 $0 $0
New Long-term Liabilities $0 $0 $0
Sales of Other Current Assets $0 $0 $0
Sales of Long-term Assets $0 $0 $0
New Investment Received $3,000 $5,000 $0
Subtotal Cash Received $251,550 $408,208 $556,184
Expenditures
Expenditures from Operations
Cash Spending $209,050 $311,000 $359,000
Bill Payments $121,806 $135,385 $162,552
Subtotal Spent on Operations $330,856 $446,385 $521,552
Additional Cash Spent
Sales Tax, VAT, HST/GST Paid Out $0 $0 $0
Principal Repayment of Current Borrowing $0 $0 $8,000
Other Liabilities Principal Repayment $0 $0 $0
Long-term Liabilities Principal Repayment $0 $0 $4,000
Purchase Other Current Assets $0 $0 $0
Purchase Long-term Assets $0 $0 $0
Dividends $0 $0 $0
Subtotal Cash Spent $330,856 $446,385 $533,552
Net Cash Flow ($79,306) ($38,177) $22,632
Cash Balance $38,494 $317 $22,949
7.5 Projected Balance Sheet
The following table shows the projected balance sheet for VSS.
Pro Forma Balance Sheet
Year 1 Year 2 Year 3
Assets
Current Assets
Cash $38,494 $317 $22,949
Accounts Receivable $49,450 $75,242 $104,058
Other Current Assets $3,500 $3,500 $3,500
Total Current Assets $91,444 $79,059 $130,507
Long-term Assets
Long-term Assets $25,000 $25,000 $25,000
Accumulated Depreciation $0 $0 $2,500
Total Long-term Assets $25,000 $25,000 $22,500
Total Assets $116,444 $104,059 $153,007
Liabilities and Capital
Current Liabilities
Accounts Payable $11,435 $11,100 $13,563
Current Borrowing $36,000 $42,000 $34,000
Other Current Liabilities $0 $0 $0
Subtotal Current Liabilities $47,435 $53,100 $47,563
Long-term Liabilities $55,000 $55,000 $51,000
Total Liabilities $102,435 $108,100 $98,563
Paid-in Capital $103,000 $108,000 $108,000
Retained Earnings ($27,700) ($88,991) ($112,041)
Earnings ($61,291) ($23,050) $58,485
Total Capital $14,009 ($4,041) $54,444
Total Liabilities and Capital $116,444 $104,059 $153,007
Net Worth $14,009 ($4,041) $54,444
7.6 Business Ratios
We have included industry standard ratios from the telemarketing solicitation services industry to compare with ours. These ratios are closely matched to our industry, but there are some significant differences, especially in sales growth, financing ratios, long-term asset investments, and net worth. However, our projections indicate a healthy company that will be able to obtain and retain long-term profitability.
Ratio Analysis
Year 1 Year 2 Year 3 Industry Profile
Sales Growth 0.00% 52.16% 38.30% 8.79%
Percent of Total Assets
Accounts Receivable 42.47% 72.31% 68.01% 28.12%
Other Current Assets 3.01% 3.36% 2.29% 44.18%
Total Current Assets 78.53% 75.98% 85.29% 76.27%
Long-term Assets 21.47% 24.02% 14.71% 23.73%
Total Assets 100.00% 100.00% 100.00% 100.00%
Current Liabilities
Accounts Payable 40.74% 51.03% 31.09% 38.61%
Long-term Liabilities 47.23% 52.85% 33.33% 13.60%
Total Liabilities 87.97% 103.88% 64.42% 52.21%
Net Worth 12.03% -3.88% 35.58% 47.79%
Percent of Sales
Sales 100.00% 100.00% 100.00% 100.00%
Gross Margin 98.45% 98.58% 98.97% 100.00%
Selling, General & Administrative Expenses 120.50% 104.03% 88.98% 82.68%
Advertising Expenses 0.00% 0.00% 0.00% 1.66%
Profit Before Interest and Taxes -19.10% -3.23% 15.84% 1.37%
Main Ratios
Current 1.93 1.49 2.74 1.59
Quick 1.93 1.49 2.74 1.22
Total Debt to Total Assets 87.97% 103.88% 64.42% 3.09%
Pre-tax Return on Net Worth -437.51% 570.43% 153.46% 60.22%
Pre-tax Return on Assets -52.64% -22.15% 54.61% 7.76%
Additional Ratios
Net Profit Margin -22.05% -5.45% 10.00% n.a
Return on Equity -437.51% 0.00% 107.42% n.a
Activity Ratios
Accounts Receivable Turnover 4.22 4.22 4.22 n.a
Collection Days 56 72 75 n.a
Accounts Payable Turnover 11.39 12.17 12.17 n.a
Payment Days 28 30 27 n.a
Total Asset Turnover 2.39 4.06 3.82 n.a
Debt Ratios
Debt to Net Worth 7.31 0.00 1.81 n.a
Current Liab. to Liab. 0.46 0.49 0.48 n.a
Liquidity Ratios
Net Working Capital $44,009 $25,959 $82,944 n.a
Interest Coverage -6.49 -1.45
| Personnel Plan | |||||||||||
| Month 1 | Month 2 | Month 3 | Month 4 | Month 5 | Month 6 | Month 7 | Month 8 | Month 9 | Month 10 | Month 11 | Month 12 |
| Mr. Martin Gibbs – President | 0% | $3,000 | |||||||||
| Ms. Mary Stuart – Office Manager | 0% | $3,000 | |||||||||
| Mr. Nicholas Caput – Operations | 0% | $3,000 | |||||||||
| Customer service representatives | 0% | $5,760 | $7,680 | $9,600 | $10,000 | $11,500 | $13,470 | ||||
| Total People | 0% | 9 | 11 | 13 | 15 | 17 | 19 | ||||
| Total Payroll | 0% | $14,760 | $16,680 | $18,600 | $19,000 | $20,500 | $22,470 |
| General Assumptions | ||||||||||||
| Month 1 | Month 2 | Month 3 | Month 4 | Month 5 | Month 6 | Month 7 | Month 8 | Month 9 | Month 10 | Month 11 | Month 12 | |
| Plan Month | 1 | 2 | 3 | 4 | 5 | 6 | 7 | 8 | 9 | 10 | 11 | 12 |
| Current Interest Rate | 10.00% | |||||||||||
| Long-term Interest Rate | 10.00% | |||||||||||
| Tax Rate | 30.00% | |||||||||||
| Other | 0 |
| Pro Forma Profit and Loss | |||||||||||
| Month 1 | Month 2 | Month 3 | Month 4 | Month 5 | Month 6 | Month 7 | Month 8 | Month 9 | Month 10 | Month 11 | Month 12 |
| Sales | $11,000 | $12,000 | $8,000 | $17,000 | $19,000 | $20,000 | $30,000 | $31,000 | $32,000 | ||
| Direct Cost of Sales | $0 | ||||||||||
| Other Costs of Sales | $200 | $100 | $300 | $500 | $600 | $500 | |||||
| Total Cost of Sales | $200 | $100 | $300 | $500 | $600 | $500 | |||||
| Gross Margin | $10,800 | $11,900 | $7,900 | $16,800 | $18,700 | $19,700 | |||||
| Gross Margin % | 98.18% | 99.17% | 98.75% | 98.82% | 98.42% | 98.50% | |||||
| Expenses | |||||||||||
| Payroll | $14,760 | $16,680 | $18,600 | $19,000 | $20,500 | $22,470 | |||||
| Sales and Marketing and Other Expenses | $1,500 | ||||||||||
| Depreciation | $0 | ||||||||||
| Rent | $1,500 | ||||||||||
| Utilities | $600 | ||||||||||
| Insurance | $1,100 | ||||||||||
| Payroll Taxes | 15% | $2,214 | $2,502 | $2,790 | $2,850 | $3,075 | |||||
| Travel | 15% | $1,000 | |||||||||
| Other | $1,500 | ||||||||||
| Total Operating Expenses | $24,174 | $26,382 | $28,590 | $29,050 | $30,775 | $33,041 | |||||
| Profit Before Interest and Taxes | ($13,374) | ($12,274) | ($16,274) | ($7,374) | $910 | $725 | |||||
| EBITDA | ($13,374) | ($12,274) | ($16,274) | ($7,374) | $910 | $725 | |||||
| Interest Expense | $592 | $675 | $717 | $758 | $758 | $758 | |||||
| Taxes Incurred | $0 | ||||||||||
| Net Profit | ($13,966) | ($12,866) | ($16,866) | ($7,966) | ($33) | $701 | |||||
| Net Profit/Sales | -126.96% | -107.21% | -210.82% | -46.86% | -0.10% | 2.00% |
Pro Forma Cash Flow
| Pro Forma Cash Flow | ||||||||||||
| Month 1 | Month 2 | Month 3 | Month 4 | Month 5 | Month 6 | Month 7 | Month 8 | Month 9 | Month 10 | Month 11 | Month 12 | |
| Cash Received | ||||||||||||
| Cash from Operations | ||||||||||||
| Cash Sales | $2,750 | $3,000 | $2,000 | $4,250 | $4,750 | $5,000 | $7,500 | $7,750 | $7,750 | $8,000 | $8,000 | $8,750 |
| Cash from Receivables | $0 | $275 | $8,275 | $8,900 | $6,225 | $12,800 | $14,275 | $15,250 | $22,525 | $23,250 | $23,275 | $24,000 |
| Subtotal Cash from Operations | $2,750 | $3,275 | $10,275 | $13,150 | $10,975 | $17,800 | $21,775 | $23,000 | $30,275 | $31,250 | $31,275 | $32,750 |
| Additional Cash Received | ||||||||||||
| Sales Tax, VAT, HST/GST Received | 0.00% | $0 | $0 | $0 | $0 | $0 | $0 | $0 | $0 | $0 | $0 | $0 |
| New Current Borrowing | $0 | $0 | $0 | $5,000 | $5,000 | $5,000 | $5,000 | $0 | $0 | $0 | $0 | |
| New Other Liabilities (interest-free) | $0 | $0 | $0 | $0 | $0 | $0 | $0 | $0 | $0 | $0 | $0 | $0 |
| New Long-term Liabilities | $0 | $0 | $0 | $0 | $0 | $0 | $0 | $0 | $0 | $0 | $0 | $0 |
| Sales of Other Current Assets | $0 | $0 | $0 | $0 | $0 | $0 | $0 | $0 | $0 | $0 | $0 | $0 |
| Sales of Long-term Assets | $0 | $0 | $0 | $0 | $0 | $0 | $0 | $0 | $0 | $0 | $0 | $0 |
| New Investment Received | $0 | $0 | $0 | $0 | $0 | $0 | $1,500 | $1,500 | $0 | $0 | $0 | $0 |
| Subtotal Cash Received | $2,750 | $3,275 | $10,275 | $13,150 | $15,975 | $22,800 | $28,275 | $29,500 | $30,275 | $31,250 | $31,275 | $32,750 |
| Expenditures | Month 1 | Month 2 | Month 3 | Month 4 | Month 5 | Month 6 | Month 7 | Month 8 | Month 9 | Month 10 | Month 11 | Month 12 |
| Expenditures from Operations | ||||||||||||
| Cash Spending | $14,760 | $14,760 | $14,760 | $14,760 | $14,760 | $16,680 | $18,600 | $19,000 | $19,000 | $19,000 | $20,500 | $22,470 |
| Bill Payments | $3,340 | $10,202 | $10,106 | $10,109 | $10,210 | $10,358 | $10,695 | $11,213 | $11,405 | $11,308 | $11,316 | $11,543 |
| Subtotal Spent on Operations | $18,100 | $24,962 | $24,866 | $24,869 | $24,970 | $27,038 | $29,295 | $30,213 | $30,405 | $30,308 | $31,816 | $34,013 |
| Additional Cash Spent | ||||||||||||
Hello!
I’m Andrew Brooks, a seasoned finance consultant from the USA and the mind behind phonenumber247.com.
My career is built on a foundation of helping individuals and businesses thrive financially in an ever-changing economic landscape. At phonenumber247.com, my aim is to demystify the complex world of finance, providing clear, actionable advice that can help you navigate your financial journey with confidence. Whether it’s personal finance management, investment strategies, or understanding the nuances of market dynamics, I’m here to share insights and tools that can propel you towards your financial goals.
Welcome to my digital space, where every piece of advice is a step closer to financial clarity and success!
