Computer Support Business Plan
I Tech Solutions is a consulting company aiming to meet the market need for a professional, customer-focused computer company. The company prioritizes service and support to distinguish itself from price-oriented computer companies. We are on the verge of entering a profitable market in a rapidly growing industry. The current trend of increasing entrepreneurs and competition among existing companies presents an opportunity for I Tech Solutions to enter this market.
Located at (location omitted), we understand that to succeed, we need to be flexible and responsive. Our goal is to delight clients by providing them with what they want, when they want it, and before the competition can offer it. We plan to achieve this through a customer-centric solutions approach that prioritizes the client’s business objectives.
Once the needs and processes are understood and described, we will use cutting-edge products and industry-leading skills to design and develop a suitable and cost-effective solution for the client’s business.
Our marketing strategy will focus on ensuring that clients are informed about the services we offer and making the right services and information available to the target clients. We will implement a market penetration strategy to establish our services as well-known and respected in our industry. Our strategy will convey quality and satisfaction in every picture, promotion, and publication. We will use traditional advertising, internet marketing, personal selling, public relations, and direct marketing to promote our services.
It is vital to recognize that our intangible resources, such as our ability to understand and meet customer needs, management style, corporate culture, and commitment, set us apart from our competitors and contribute to a sustainable competitive advantage.
In summary, our goal is not just to market and sell our products and services but to provide customized solutions that enable our clients to optimize their output and achieve their goals. However, to accomplish this, we will require funding from external investors.
Note: All currency values in the charts and tables are expressed in Botswana Pula (P).
Our business strategy revolves around providing quality products and services to our target customers. This will be accomplished through a professional team and customized services that cater to each client’s specific needs.
Our objectives include:
1. Developing a follow-up strategy to assess performance with all clients.
2. Formalizing and measuring cross-functional communication to ensure departmental collaboration in achieving company objectives.
3. Instilling a culture of continuous improvement to exceed standards of customer satisfaction and efficiency.
4. Fully supporting economic growth and development.
The success of our projects will depend on effective market segmentation and implementation strategies. Key factors for success include:
1. Excellence in fulfilling promises: delivering confidential, reliable, and trustworthy expertise and services using the latest technology and well-trained personnel.
2. Prompt response to client orders: maintaining constant communication and providing needs-based solutions.
3. Skill and knowledge: our personnel’s expertise is vital in delivering services to end-users as we operate in a relatively new market.
4. Clear product and marketing positioning: aggressively promoting our business and services to stand out from other vendors.
5. Leveraging expertise: forming alliances with technological and training partners to benefit from their skills in product support, design, system integration, and more.
Our mission statement reflects our commitment to fair and ethical treatment of employees and stakeholders. Our company values include:
– Being a responsible corporate citizen and considering social and environmental impacts in our decisions.
– Providing uncompromising quality products and services.
– Establishing honest and enduring relationships internally and externally.
– Upholding and promoting these values among our employees.
By implementing our company values, we believe we can achieve our goals and benefit all stakeholders, especially the communities we operate in. Information technology management for businesses requires outside expertise, and we aim to be a trusted ally for our clients, providing them with quality vendors for hardware, software, service, and support. Our mission is to leverage emerging technologies to deliver the highest quality products, services, customer service, and security.
I Tech Solutions, a private limited company founded in November 2000, aims to establish close relationships with clients and expand in the future.
Ownership of I Tech Solutions is held by Mr. T, Mr. S, and Mr. P, who recognize the company’s potential for market growth with adequate funding.
The start-up expenses, including legal costs, business cards, stationery, and related expenses, have been covered by initial investments from Messrs. T, S, and P, as well as a 5-year commercial loan from Bank Z. Please note that all currency values are expressed in Botswana Pula (P).
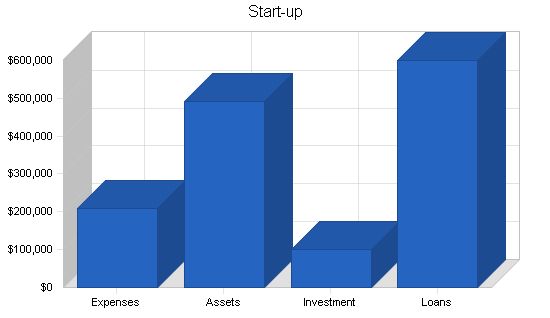
Start-up Funding:
– Start-up Expenses to Fund: P207,749
– Start-up Assets to Fund: P492,251
– Total Funding Required: P700,000
Assets:
– Non-cash Assets from Start-up: P0
– Cash Requirements from Start-up: P492,251
– Additional Cash Raised: P0
– Cash Balance on Starting Date: P492,251
– Total Assets: P492,251
Liabilities and Capital:
– Liabilities:
– Current Borrowing: P0
– Long-term Liabilities: P600,000
– Accounts Payable (Outstanding Bills): P0
– Other Current Liabilities (interest-free): P0
– Total Liabilities: P600,000
– Capital:
– Planned Investment:
– Investor 1: P40,000
– Investor 2: P30,000
– Investor 3: P30,000
– Additional Investment Requirement: P0
– Total Planned Investment: P100,000
– Loss at Start-up (Start-up Expenses): (P207,749)
– Total Capital: (P107,749)
– Total Capital and Liabilities: P492,251
– Total Funding: P700,000
Start-up Requirements:
– Start-up Expenses:
– Legal: P1,400
– Stationery etc.: P2,000
– Brochures: P5,000
– Consultants: P4,500
– Staff Engagement: P4,000
– Office Locatioin: P2,600
– Staff Training: P5,000
– Expensed equipment: P171,349
– Other: P11,900
– Total Start-up Expenses: P207,749
– Start-up Assets:
– Cash Required: P492,251
– Start-up Inventory: P0
– Other Current Assets: P0
– Long-term Assets: P0
– Total Assets: P492,251
– Total Requirements: P700,000
Products and Services:
I Tech Solutions will provide computer products and services to businesses of all sizes. We will focus on providing network systems and services, including both PC-based Land Area Networks (LAN) systems and minicomputer server-based systems. Our services will include the design, installation, training, and support of network systems.
3.1 Product and Service Description:
I Tech Solutions will offer the following services:
1. Financial Solutions
2. Network Solutions
3. Data Backup Solutions and Services
4. E-commerce Solutions
5. Hardware Supply and Technical Support
6. Paperless Office Automation Solutions
7. Training
3.2 Technology:
I Tech Solutions will stay up-to-date with the latest hardware and software capabilities to remain at the forefront of our market. We will utilize new technology within our existing framework and offer complete presentation facilities for multimedia presentations on Macintosh or Windows machines.
3.3 Macro-environment:
Our macro-environment is filled with exciting possibilities. The Internet has revolutionized information technology, and we aim to provide real value in the way we deal with information. The government’s push for a diversified economy presents an opportunity for our business to excel in our target markets. We anticipate an increasing demand for high-quality business communication solutions.
3.4 Future Products and Services:
As a technology-focused company, we must stay updated with new advancements to remain competitive. We will enhance our knowledge of cross-platform technologies and direct-connect Internet and related communications. Our aim is to meet market needs and deliver services of excellent quality, timely, and at competitive rates.
Market Analysis Summary:
The government’s emphasis on diversifying the industrial base presents an opportunity for I Tech Solutions to contribute to this goal through modern IT services and techniques. We will target proactive, market seeking organizations that desire efficient and effective IT systems. Our clients will include business executives in large, medium, and small corporations who require access to company data and information for their decision-making processes. We also offer a development alternative to companies hindered by technological limitations in new markets and segments.
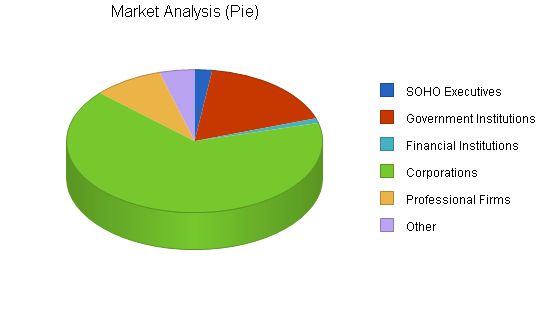
Market Analysis:
Year 1 Year 2 Year 3 Year 4 Year 5
Potential Customers Growth CAGR
SOHO Executives 100 103 106 109 112 2.87%
Government Institutions 800 896 1,004 1,124 1,259 12.00%
Financial Institutions 50 59 69 81 95 17.41%
Corporations 3,000 3,660 4,465 5,447 6,645 22.00%
Professional Firms 400 412 424 437 450 2.99%
Other 200 208 216 225 234 4.00%
Total 4,550 5,338 6,284 7,423 8,795 17.91%
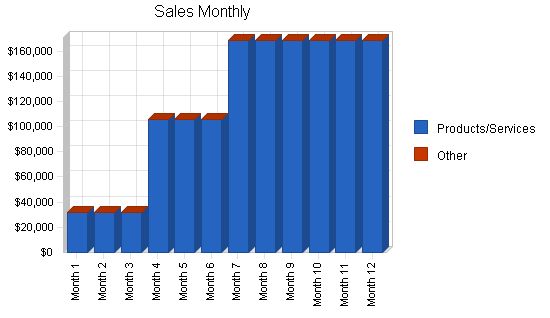
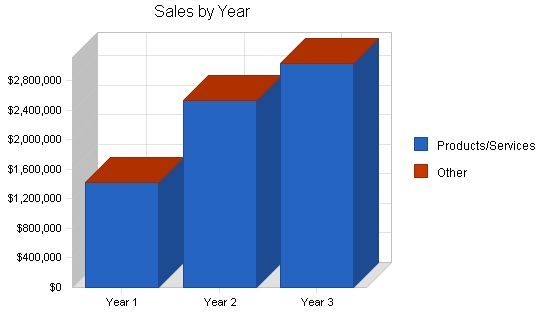
| Sales Forecast | |||
| Year 1 | Year 2 | Year 3 | |
| Sales | |||
| Products/Services | P1,422,225 | P2,528,400 | P3,034,080 |
| Other | P0 | P0 | P0 |
| Total Sales | P1,422,225 | P2,528,400 | P3,034,080 |
| Direct Cost of Sales | Year 1 | Year 2 | Year 3 |
| Products/Services | P711,114 | P1,264,200 | P1,517,040 |
| Other | P0 | P0 | P0 |
| Subtotal Direct Cost of Sales | P711,114 | P1,264,200 | P1,517,040 |
5.5 Strategic Alliances
I Tech Solutions plans to form strategic alliances with various organizations. This will reassure our customers that they are investing in superior products, technology, and service that can meet future demands effectively.
Currently, we are considering strategic partnerships with several companies, including X, based on existing interest and discussions. These alliances will allow us to focus on delivering our products and services to end-users without compromising quality or quantity.
Management Summary
Human resources are essential to delivering a comprehensive service. We aim to have enthusiastic, capable, and empowered individuals who can meet our clients’ needs. Our teams will have decision-making authority to ensure prompt handling and timely delivery of services. We will evaluate job positions and compensation packages to remain competitive in the market.
6.1 Organizational Structure
Our management philosophy is based on responsibility and mutual respect. We recognize the need for constant adaptation to the changing environment. Our flexible structure enables us to respond swiftly and smoothly. Below are the job titles and descriptions for key personnel. (Table omitted)
6.2 Management Team
In a highly volatile and competitive industry, we understand the importance of constant adaptation. Our management team possesses extensive expertise and knowledge of our products/services and markets. Well-planned utilization of their skills will help us achieve our goals and objectives.
Our management style reflects shareholder participation. We value our community and prioritize employee well-being. We aim to foster a sense of unity and flexibility due to the rapidly changing industry. Our ongoing initiatives to drive sales, increase market share, and improve productivity will provide additional motivation.
6.3 Personnel Plan
The appendix includes a detailed monthly personnel plan for the first three years. We believe that this plan strikes a balance between fairness and efficiency while aligning with our mission statement. We want to maintain a lean and flexible workforce to swiftly respond to market needs. However, as we expand, we anticipate an increase in personnel.
We will compensate our employees well to retain their expertise and provide job satisfaction. Our compensation package includes healthcare, generous profit sharing, and a minimum of 3 weeks of vacation.
Note: All currency values in the charts and tables are expressed in the Botswana Pula (P).
| Personnel Plan | |||
| Year 1 | Year 2 | Year 3 | |
| Directors | P135,000 | P180,000 | P216,000 |
| Personal Assistant | P10,800 | P13,200 | P14,520 |
| Cleaner | P3,600 | P6,000 | P7,200 |
| Total People | 5 | 5 | 5 |
| Total Payroll | P149,400 | P199,200 | P237,720 |
6.4 Training
We will provide continuous in-house training, supplemented by regular external training, particularly after new developments in the market. This ensures that we can anticipate our market’s needs proactively and maintain a competitive advantage. External training will also help us stay updated on the latest products and technology, enabling us to set high standards based on industry benchmarks.
6.5 Feedback and Control
a) We encourage employees to share suggestions to improve company functions, fostering innovation and job satisfaction.
b) We formalize and measure cross-functional communication to ensure departments work harmoniously towards corporate objectives.
c) We continuously communicate important notices and developments to promote a sense of belonging and unity within the organization.
Financial Plan
We aim to finance growth primarily through cash flow and equity, recognizing that this may result in slower growth. Collection days are crucial, and we cannot pressure clients due to their larger companies’ financial authority. Therefore, we plan to establish a system of receivables financing through established accounting systems. We seek investors who align with our growth plan, management style, and vision. Compatibility means:
- Respecting customer value and maintaining a healthy workplace
- Adhering to realistic forecasts, conservative cash flow, and financial management
- Prioritizing cash flow, growth, and profits in that order
- Contributing valuable input to strategy and implementation decisions
The last two points are flexible.
7.1 Break-even Analysis
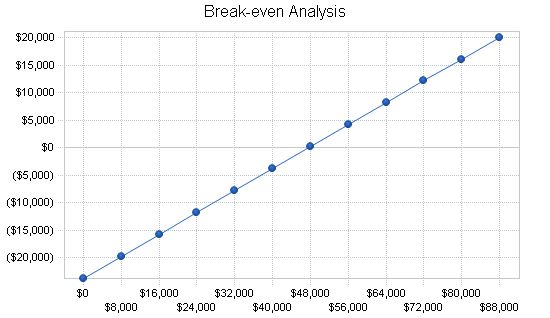
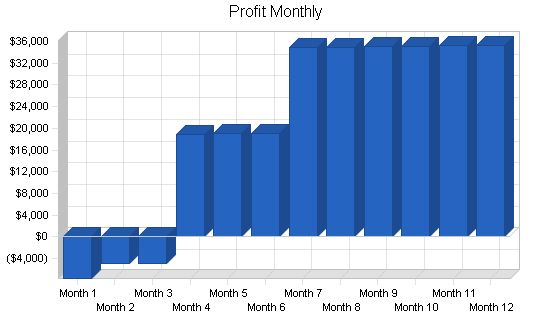
The following table and chart summarize our Break-even Analysis. We expect to reach break-even several months into the business operation, as shown in the financials.
Note: All currency values in the charts and tables are expressed in the Botswana Pula (P).
| Break-even Analysis | |
| Monthly Revenue Break-even | P47,662 |
| Assumptions: | |
| Average Percent Variable Cost | 50% |
| Estimated Monthly Fixed Cost | P23,831 |
7.2 Important Assumptions
The financial plan relies on key assumptions. Collection days are important but beyond our control. Interest rates, tax rates, and personnel burden are based on conservative estimates.
Some important assumptions are:
- We assume a strong economy with no major recession.
- We assume no unforeseen changes in economic policy that would make our products and services immediately obsolete.
Other assumptions include a 30-day average collection period, sales exclusively on an invoice basis with a favorable deposit policy, expenses mostly on a net 30-day basis, and present-day interest rates.
| General Assumptions | |||
| Year 1 | Year 2 | Year 3 | |
| Plan Month | 1 | 2 | 3 |
| Current Interest Rate | 17.00% | 17.00% | 17.00% |
| Long-term Interest Rate | 17.00% | 17.00% | 17.00% |
| Tax Rate | 25.42% | 25.00% | 25.42% |
| Other | 0 | 0 | 0 |
7.3 Key Financial Indicators
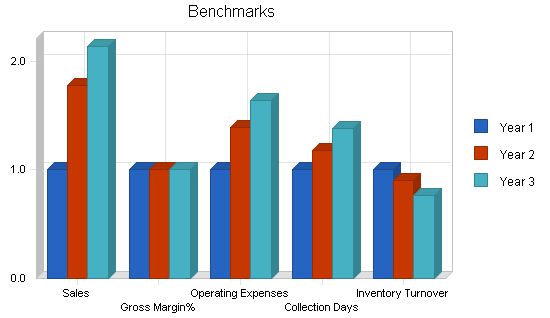
We anticipate significant sales growth and operating expenses, as well as an increase in collection days during our expansion.
Collection days are crucial. We must keep our average collection period below 30 days at all costs to avoid cash flow issues, although we recognize this may be challenging due to our client relationships.
7.4 Projected Profit and Loss
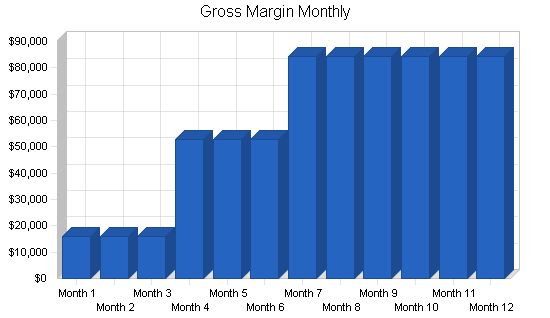
Initial marketing and training expenses will be high as we seek to become known in the market and train staff. This will involve developing sales literature, advertising, and function expenses. As our market share increases and capital is generated, we will undertake further marketing programs and expand existing ones to develop the market. Over time, these programs will start generating revenue for the business, which we will reinvest.
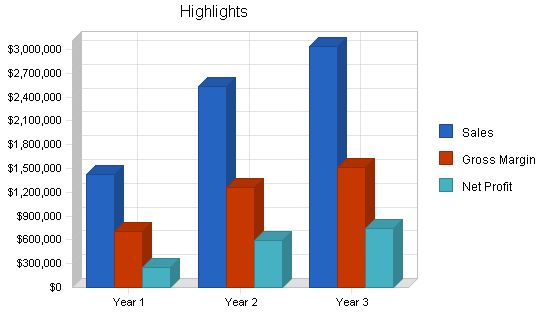
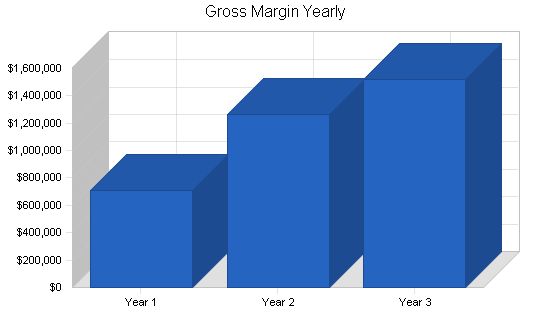
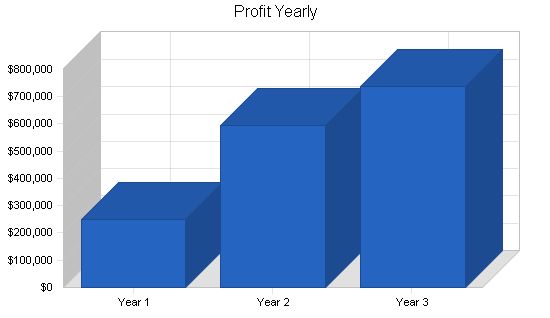
Our projected Profit and Loss is shown in the appendix, with sales increasing steadily from the first year through the second and third years. We expect to break-even in the first year of operation. Our cost of sales should be lower and gross margin higher than in this projection.
Note: All currency values in the charts and tables are expressed in Botswana Pula (P).
Pro Forma Profit and Loss
Year 1 Year 2 Year 3
Sales P1,422,225 P2,528,400 P3,034,080
Direct Cost of Sales P711,114 P1,264,200 P1,517,040
Other P0 P0 P0
Total Cost of Sales P711,114 P1,264,200 P1,517,040
Gross Margin P711,111 P1,264,200 P1,517,040
Gross Margin % 50.00% 50.00% 50.00%
Expenses
Payroll P149,400 P199,200 P237,720
Sales and Marketing and Other Expenses P95,772 P154,140 P182,196
Depreciation P0 P0 P0
Utilities P3,600 P3,960 P4,356
Telephone P6,000 P6,600 P7,260
Insurance P14,400 P15,840 P17,424
Rent P16,800 P18,480 P20,328
Insurance P0 P0 P0
Payroll Taxes P0 P0 P0
Other P0 P0 P0
Total Operating Expenses P285,972 P398,220 P469,284
Profit Before Interest and Taxes P425,139 P865,980 P1,047,756
EBITDA P425,139 P865,980 P1,047,756
Interest Expense P92,497 P75,684 P58,140
Taxes Incurred P82,612 P197,574 P251,527
Net Profit P250,030 P592,722 P738,089
Net Profit/Sales 17.58% 23.44% 24.33%
7.5 Projected Cash Flow
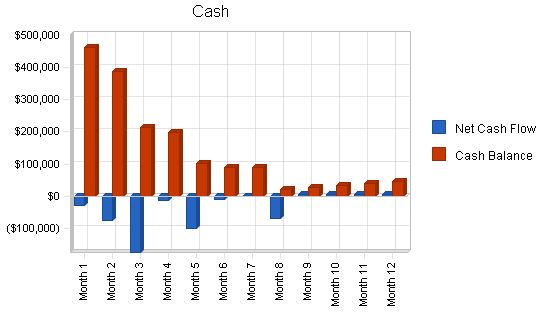
The chart and table below present the cash flow projections for I Tech Solutions.
Note: All currency values in the charts and tables are expressed in the Botswana Pula (P).
Pro Forma Cash Flow
| Pro Forma Cash Flow | |||
| Year 1 | Year 2 | Year 3 | |
| Cash Received | |||
| Cash from Operations | |||
| Cash Sales | P426,668 | P758,520 | P910,224 |
| Cash from Receivables | P763,507 | P1,589,396 | P2,041,349 |
| Subtotal Cash from Operations | P1,190,174 | P2,347,916 | P2,951,573 |
| Additional Cash Received | |||
| Sales Tax, VAT, HST/GST Received | P0 | P0 | P0 |
| New Current Borrowing | P0 | P0 | P0 |
| New Other Liabilities (interest-free) | P0 | P0 | P0 |
| New Long-term Liabilities | P0 | P0 | P0 |
| Sales of Other Current Assets | P0 | P0 | P0 |
| Sales of Long-term Assets | P0 | P0 | P0 |
| New Investment Received | P0 | P0 | P0 |
| Subtotal Cash Received | P1,190,174 | P2,347,916 | P2,951,573 |
| Expenditures | Year 1 | Year 2 | Year 3 |
| Expenditures from Operations | |||
| Cash Spending | P149,400 | P199,200 | P237,720 |
| Bill Payments | P1,002,379 | P1,773,057 | P2,068,003 |
| Subtotal Spent on Operations | P1,151,779 | P1,972,257 | P2,305,723 |
| Additional Cash Spent | |||
| Sales Tax, VAT, HST/GST Paid Out | P0 | P0 | P0 |
| Principal Repayment of Current Borrowing | P0 | P0 | P0 |
| Other Liabilities Principal Repayment | P0 | P0 | P0 |
| Long-term Liabilities Principal Repayment | P103,200 | P103,200 | P103,200 |
| Purchase Other Current Assets | P141,200 | P0 | P0 |
| Purchase Long-term Assets | P240,000 | P0 | P0 |
| Dividends | P0 | P0 | P0 |
| Subtotal Cash Spent | P1,636,179 | P2,075,457 | P2,408,923 |
| Net Cash Flow | (P446,005) | P272,459 | P542,650 |
| Cash Balance | P46,246 | P318,705 | P861,356 |
7.6 Projected Balance Sheet
The balance sheet shows healthy growth of net worth and a strong financial position. The three-year estimates are included in the appendix.
Note: All currency values in the charts and tables are expressed in the Botswana Pula (P).
| Pro Forma Balance Sheet | |||
| Year 1 | Year 2 | Year 3 | |
| Assets | |||
| Current Assets | |||
| Cash | P46,246 | P318,705 | P861,356 |
| Accounts Receivable | P232,051 | P412,535 | P495,042 |
| Inventory | P92,708 | P164,814 | P197,777 |
| Other Current Assets | P141,200 | P141,200 | P141,200 |
| Total Current Assets | P512,205 | P1,037,254 | P1,695,374 |
| Long-term Assets | |||
| Long-term Assets | P240,000 | P240,000 | P240,000 |
| Accumulated Depreciation | P0 | P0 | P0 |
| Total Long-term Assets | P240,000 | P240,000 | P240,000 |
| Total Assets | P752,205 | P1,277,254 | P1,935,374 |
| Liabilities and Capital | Year 1 | Year 2 | Year 3 |
| Current Liabilities | |||
| Accounts Payable | P113,124 | P148,651 | P171,882 |
| Current Borrowing | P0 | P0 | P0 |
| Other Current Liabilities | P0 | P0 | P0 |
| Subtotal Current Liabilities | P113,124 | P148,651 | P171,882 |
| Long-term Liabilities | P496,800 | P393,600 | P290,400 |
| Total Liabilities | P609,924 | P542,251 | P462,282 |
| Paid-in Capital | P100,000 | P100,000 | P100,000 |
| Retained Earnings | (P207,749) | P42,281 | P635,003 |
| Earnings | P250,030 | P592,722 | P738,089 |
| Total Capital | P142,281 | P735,003 | P1,473,092 |
| Total Liabilities and Capital | P752,205 | P1,277,254 | P1,935,374 |
| Net Worth | P142,281 | P735,003 | P1,473,092 |
7.7 Business Ratios
The following table shows important ratios from the computer-related services industry, as determined by the Standard Industry Classification (SIC) Index #7379, Computer Related Services.
| Ratio Analysis | ||||
| Year 1 | Year 2 | Year 3 | Industry Profile | |
Hello!
I’m Andrew Brooks, a seasoned finance consultant from the USA and the mind behind phonenumber247.com.
My career is built on a foundation of helping individuals and businesses thrive financially in an ever-changing economic landscape. At phonenumber247.com, my aim is to demystify the complex world of finance, providing clear, actionable advice that can help you navigate your financial journey with confidence. Whether it’s personal finance management, investment strategies, or understanding the nuances of market dynamics, I’m here to share insights and tools that can propel you towards your financial goals.
Welcome to my digital space, where every piece of advice is a step closer to financial clarity and success!
