Contents
Children’s Website Business Plan
InteliChild.com is a place for children to interact with each other, educators, and the world. It generates traffic, valuation for investors, and eventually profits. It is a healthy place for kids to play, parents and schools to buy, and employees to work.
The InteliChild.com e-commerce project is the next step in the company’s evolution. The site will market and sell toys, books, and software products. It will also create web products and applications to increase market share, promote name recognition, and maximize efficiency.
The present InteliChild.com is a start-up with four full-time employees. It is a California C corporation owned by its founders. (Name Omitted) Capital partners acquired 50% of the company. The initial website is at www.citruscoolkids.com.
Our competitive advantage is our in-house knowledge base. Our competitor spends five to 10 times the amount we do outsourcing services. The same will happen with the InteliChild.com website. We already have the SQL™ server and ColdFusion™ programming expertise, and we will be adding Flash™ integration to these skills.
InteliChild will offer three lines of products:
- Toys and Games: carefully selected products for the target market, parents, and educators.
- Books: a selection that appeals to parents and educators, as well as children.
- Software: carefully selected software for the target market, parents, and educators.
Our strategy for future development is to remain flexible and adapt quickly to new technologies and changes.
The InteliChild.com market has been expanding with advancements in technology in the teaching sector. Approval and support from school communities are critical for our entrance into the market.
Our primary target markets include:
- Kids
- Parents
- Educational institutions for children of the upper class
- Self-teaching families
Our initial launch will focus on the American upper class. These clients appreciate the technology we have created and have high bandwidth connections. They value first-class design.
Our start-up costs are high due to our commitment to dominate the internet market. We expect to break-even in the first year.
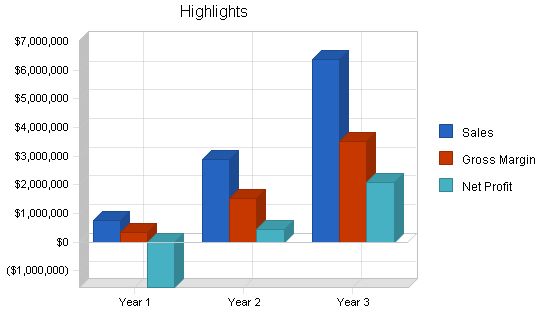
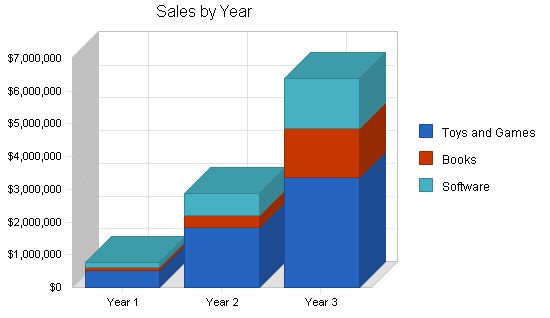
The sales forecast is based on increasing website traffic and sales per user session. Sales are projected to rise exponentially from Year 1 to Year 3. We plan to lose money for at least three years while we build traffic and establish our position for the long-term future.
Objectives
- Traffic: 100,000 unique user sessions in June, Year 1; 450,000 in December, Year 1; 3.5 million in Year 2; and 5 million in Year 3.
- Sell-through: $0.58 per unique visit in December of Year 1; increasing to $0.83 in Year 2; and $0.92 in Year 3.
- Valuation: ability to bring in additional investment at economically feasible valuations. We need to attract moderate investment this year, and an additional large infusion in Year 2, with valuation performance that yields attractive internal rate of return (IRR) to investors. The financial section indicates IRR of more than 100% for all investors, with larger IRR for seed, declining slightly for first round and then second round.
- Acquisition or Initial public offering (IPO) in Year 4, with a valuation of more than $20 million. This assumes the market valuations based on sales and earnings, which are relatively high as this plan is written.
Mission
InteliChild.com offers bright children an entertaining place to interact with each other, the Web, educators, and the world. It generates traffic, valuation for investors, and commerce and profits. It is a healthy place for kids to play, for parents and schools to buy, and a creative and fair work environment for employees.
Keys to Success
- We must retain customers. The website must be easy to use and quickly viewable. User satisfaction is a top priority.
- The project will succeed by capitalizing on InteliChild.com’s traffic and converting user sessions into dollars through the commerce site.
- The sales process must be easy to administer and flexible enough to accommodate InteliChild’s needs without increasing employee count.
- The e-commerce project should establish InteliChild.com as a technology leader, not just bringing back traffic but also attracting new visitors.
Company Summary
InteliChild.com is a start-up company with four full-time employees. We are a high-powered team of creative individuals. The company creates an Internet environment for bright kids and plans to sell toys, books, and software to kids, parents, and schools. Our products will be highly reviewed in our niche.
Start-up Summary
Our start-up costs reflect our commitment to dominate the Internet market place.
Our development costs are high, but our human resources costs are not as high as they might be since we are located in Oregon instead of the Silicon Valley. Marketing expenses are also high, but developing this site without appropriate promotion would make it difficult to gather the necessary traffic for success.
Our location leverages our partner potential, despite the premium we pay for space and talent due to development costs.
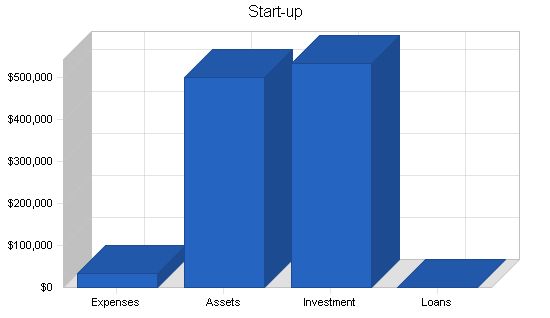
Start-up Funding:
– Start-up Expenses to Fund: $33,750
– Start-up Assets to Fund: $499,000
– Total Funding Required: $532,750
Assets:
– Non-cash Assets from Start-up: $5,000
– Cash Requirements from Start-up: $494,000
– Additional Cash Raised: $0
– Cash Balance on Starting Date: $494,000
– Total Assets: $499,000
Liabilities and Capital:
– Liabilities:
– Current Borrowing: $0
– Long-term Liabilities: $0
– Accounts Payable (Outstanding Bills): $0
– Other Current Liabilities (interest-free): $0
– Total Liabilities: $0
– Capital:
– Planned Investment:
– Owner: $0
– Investor: $0
– Additional Investment Requirement: $532,750
– Total Planned Investment: $532,750
– Loss at Start-up (Start-up Expenses): ($33,750)
– Total Capital: $499,000
– Total Capital and Liabilities: $499,000
– Total Funding: $532,750
Start-up Requirements:
– Start-up Expenses:
– Legal: $1,000
– Software: $2,500
– Design Work: $5,000
– Programming: $15,000
– Insurance: $250
– Rent: $500
– Research and Development: $1,000
– Hosting Setup: $3,500
– Other: $5,000
– Total Start-up Expenses: $33,750
– Start-up Assets:
– Cash Required: $494,000
– Start-up Inventory: $0
– Other Current Assets: $5,000
– Long-term Assets: $0
– Total Assets: $499,000
– Total Requirements: $532,750
Company Ownership:
The company was incorporated as a California C corporation owned by its principal founders at 25% ownership each. (Name Omitted) Capital partners acquired 50% of the company.
Company Locations and Facilities:
The company has a single office. The important website and Internet infrastructure situation will be explained in detail later in this plan. The initial website is at www.citruscoolkids.com.
Products:
InteliChild will offer three lines of products:
1. Toys and Games: carefully selected toys and games for the target market, parents, and educators.
2. Books: a selection of books for parents and educators of the target market, as well as books for children to read.
3. Software: carefully selected software for the target market, parents, and educators.
Product Description:
In the original plan, there was a detailed description of specific toys and games, books, and software. This level of detail was considered proprietary and was removed for purposes of illustration. Please insert a detailed list of your own products if you are using this sample plan as an example.
Competitive Comparison:
In the original plan, there was a detailed description and analysis of other channels and sources competitors where the target market, parents, and educators can purchase toys, games, books, and software. This level of detail was considered proprietary and was omitted from the plan for purposes of illustration. Please insert a detailed description of your competitors for your plan if you are using this sample plan as an example.
Sales Literature:
Our answer to sales literature is the web. Within six months, we should also have a printed catalog to send to customers who prefer a hard-copy catalog.
Sourcing:
In the real plan, this section referred in detail to distributors and the products they carried. This detail was considered proprietary and strategic and was omitted from the sample plan. Please provide a detailed discussion of how the products can be purchased from manufacturers and distributors in this section.
Technology:
The InteliChild.com e-commerce site will be built on a three-tier structure. The site will be coded mostly in ColdFusion™ and ASP™ and driven by SQL™ servers and an IIS™ Web server. Customer registration databases will be live to email updates on products and the website to customers. Customers will have the option to opt-out of the email list.
The information architecture will be based on four fundamental arenas – the free valuable information arena, the product detail arena, the final purchasing arena, and the purchase administration area.
The purchase arena will require a Verisign™ certificate and a Cybercash™ connection. The administrative arena will be hosted on mirror servers that query the live databases for migration into local databases. This server is hidden from Internet traffic and kept under high security.
The set-up will require five servers, two for in-house reasons and three for web hosting. Two of the web host servers will serve traffic through ColdFusion™ and ASP™ in cluster, and the third will be a dedicated SQL™ server.
Future Products:
The Internet reinvents itself every three months. Our strategy for future development is to remain positioned with enough flexibility to adapt to new technologies quickly.
Market Analysis Summary:
The InteliChild.com market has been expanding exponentially with the advances of technology in the teaching sectors and the acceptance of technology as a teaching aid. Approval and support from the school communities, including teachers, the PTA, and special education programs, will be crucial to our entrance into the market.
Market Segmentation:
Our primary target markets include:
1. The kids themselves: ages 5-9 and ages 10-14 (10% of the total in each category).
2. Parents: 10% of the parents, assuming an average combined income above $100,000.
3. Educational institutions for children of the upper class, including day care and private schools (107,000 schools in the U.S.).
4. Self-teaching families: a group of established customers who teach their children from home.
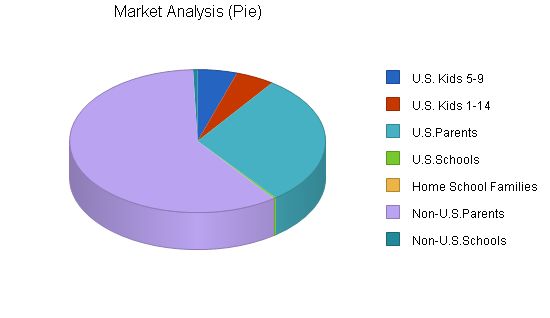
Market Analysis
Potential Customers | Growth | Year 1 | Year 2 | Year 3 | Year 4 | Year 5 | CAGR
——————— | —— | —— | —— | —— | —— | —— | ——
U.S. Kids 5-9 | 2% | 1,994,000 | 2,033,880 | 2,074,558 | 2,116,049 | 2,158,370 | 2.00%
U.S. Kids 1-14 | 2% | 1,961,200 | 2,000,424 | 2,040,432 | 2,081,241 | 2,122,866 | 2.00%
U.S. Parents | 2% | 12,000,000 | 12,240,000 | 12,484,800 | 12,734,496 | 12,989,186 | 2.00%
U.S. Schools | 1% | 107,000 | 108,070 | 109,151 | 110,243 | 111,345 | 1.00%
Home School Families | 40% | 5,000 | 7,000 | 9,800 | 13,720 | 19,208 | 40.00%
Non-U.S. Parents | 4% | 24,000,000 | 24,960,000 | 25,958,400 | 26,996,736 | 28,076,605 | 4.00%
Non-U.S. Schools | 0% | 225,000 | 225,000 | 225,000 | 225,000 | 225,000 | 0.00%
Total | 3.20% | 40,292,200 | 41,574,374 | 42,902,141 | 44,277,485 | 45,702,580 | 3.20%
Target Market Segment Strategy
Our initial launch will target the American upper class, as they appreciate our technology and have high bandwidth connections.
Market Trends
The market for technological teaching devices is growing rapidly, driven by salary increases in the technology sector, double-income households, and less leisure time. Research is increasingly happening online.
Market Growth
A strong web presence is crucial for InteliChild.com to survive and be a destination for research by double-income families in the technology sector.
Market Needs
The InteliChild.com website must be fun, easy to use, and informative, reflecting our product line. The design should promote a feeling of superior quality to appeal to parents and educators.
The website industry is experiencing significant growth.
Competition and Buying Patterns
Factors such as pricing, shipment, quality, and presentation are important in competition for website use by bright children ages 8-14.
Main Competitors
We are the second-best in dollar market share, with better reviews from industry leaders. This positions us to expand our business significantly.
Industry Participants
There are various companies addressing the same target market, selling products such as toys, books, or games.
Distribution Patterns
Multiple websites are addressing the same target market, each with its own business model and traffic.
Web Plan Summary
Our primary strategy is to build an impressive destination website that offers a great user experience. We will focus on revenue and market share growth through increased traffic.
Website Marketing Strategy
Our design and product quality will distinguish us as a dot-com company. We aim to be the best reviewed website in our category and provide a full learning center, not just a store front.
Development Requirements
We will use the latest technologies to impress visitors with excellent design and animation. The website will be built on a three-tier structure and require secure connections for purchases.
Strategy and Implementation Summary
We have developed an in-house knowledge base that gives us a competitive advantage. We will focus on sales strategies and forecast exponential growth based on increasing website traffic.
Competitive Edge
Our in-house expertise and more efficient use of resources give us a competitive advantage over our competitor.
Sales Strategy
Our sales strategy is proprietary and focused on capturing market share.
Sales Forecast
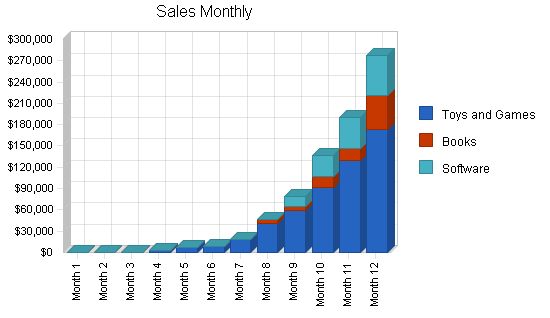
Sales are projected to rise exponentially based on increasing website traffic and sales per user session.
Sales Forecast
| Sales Forecast | |||
| Year 1 | Year 2 | Year 3 | |
| Toys and Games | 17,622 | 61,250 | 112,500 |
| Books | 4,619 | 17,500 | 50,000 |
| Software | 3,604 | 17,500 | 50,000 |
| Total Unit Sales | 25,845 | 96,250 | 212,500 |
| Unit Prices | Year 1 | Year 2 | Year 3 |
| Toys and Games | $30.00 | $30.00 | $30.00 |
| Books | $20.00 | $20.00 | $30.00 |
| Software | $40.00 | $40.00 | $30.00 |
| Sales | |||
| Toys and Games | $528,660 | $1,837,500 | $3,375,000 |
| Books | $92,380 | $350,000 | $1,500,000 |
| Software | $144,160 | $700,000 | $1,500,000 |
| Total Sales | $765,200 | $2,887,500 | $6,375,000 |
| Direct Unit Costs | Year 1 | Year 2 | Year 3 |
| Toys and Games | $12.00 | $12.00 | $12.00 |
| Books | $8.00 | $8.00 | $8.00 |
| Software | $16.00 | $16.00 | $16.00 |
| Direct Cost of Sales | |||
| Toys and Games | $211,464 | $735,000 | $1,350,000 |
| Books | $36,952 | $140,000 | $400,000 |
| Software | $57,664 | $280,000 | $800,000 |
| Subtotal Direct Cost of Sales | $306,080 | $1,155,000 | $2,550,000 |
Sales Programs
This is sample text only. The original was very proprietary, describing the company strategy in detail. This is sample text only.
Marketing Strategy
This is sample text only. The original was very proprietary, describing the company strategy in detail. This is sample text only.
Distribution Strategy
This is sample text only. The original was very proprietary, describing the company strategy in detail.
Marketing Programs
This is sample text only. The original was very proprietary, describing the company strategy in detail. This is sample text only.
This is sample text only. The original was very proprietary, describing the company strategy in detail. This is sample text only.
Pricing Strategy
This is sample text only. The original was very proprietary, describing the company strategy in detail. This is sample text only.
Promotion Strategy
This is sample text only. The original was very proprietary, describing the company strategy in detail. This is sample text only.
Strategic Alliances
This is sample text only. The original was very proprietary, describing the company strategy in detail. This is sample text only.
This is sample text only. The original was very proprietary, describing the company strategy in detail. This is sample text only.
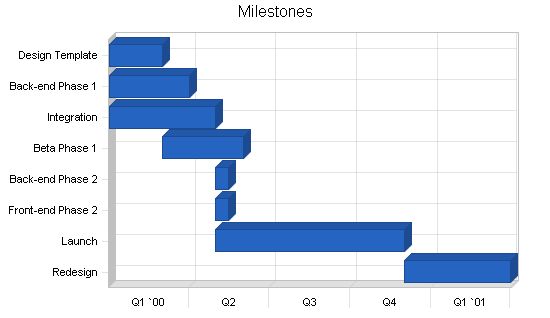
Milestones
The milestones graphic illustrates key implementation activities. The most important milestone will be the design templates. During that time we will be putting together the back-end phases, and both milestones should be achieved at the same time. After that point, integration can begin between the back-end and the front-end phases. Our next milestone will be the beta release, followed by the full launch two weeks later.
Management Summary
Sonny Cieliblu will lead the InteliChild.com project as the producer. Sonny will oversee all project activities, serving as the administrator, coordinator, and trainer for both partners and staff members. This multi-faceted role presents challenges and responsibilities as an employee, coach, and supervisor.
Organizational Structure
We require an agile organizational structure that promotes a seamless flow of ideas and implementation across sales, marketing, and website development. Rather than thinking of these functions as separate entities, we aim to foster a collaborative team environment. While maintaining clear decision-making power, we recognize the need for structure as we grow.
Management Team
Person 1: [Placeholder text describing the people involved and management structure.]
Person 2: [Placeholder text describing the people involved and management structure.]
Person 3: [Placeholder text describing the people involved and management structure.]
Person 4: [Placeholder text describing the people involved and management structure.]
Management Team Gaps
Currently, our team lacks experienced management professionals. We acknowledge this weakness and plan to recruit individuals with a wealth of expertise to strengthen our administrative and financial capabilities.
Personnel Plan
To support our growth, we have outlined a personnel plan. By the end of 2000, we aim to have 14 employees, expanding to 18 by the end of 2002.
As an internet venture, our success relies on the financial prospects of the growing online world. To ensure financial viability, we aim to increase our valuation in line with our schedule and attract substantial additional investment. The investment offering for investors is detailed in the table below:
1. The exit strategy involves acquisition in 2003, valuing the company at over $20 million.
2. The equity plan and valuations at the time of exit are explained in the "Exit Strategy" section. The plan assumes an ending valuation of $20 million, an attractive proposition with an IRR of more than 100% for every investor.
Important Assumptions
The general financial assumptions are detailed in the following table. However, critical underlying assumptions include:
1. Continued growth of internet users, estimated to increase from 4% to 11% of the world’s population by 2005.
2. No major e-commerce disasters affecting credit card authorization, shipping, etc.
3. Ongoing support from financial markets, resulting in higher valuations for internet companies, even those operating at a loss. Increasing valuations are crucial to our financial strategy.
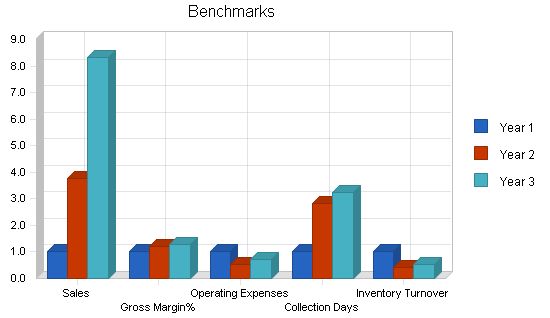
Key Financial Indicators
The following benchmarks demonstrate ambitious sales growth alongside corresponding increases in operating expenses. Our goal is to improve inventory ratios, payment terms, and collection periods. Leveraging internet technology as our primary sales and marketing channel allows for high sales growth without corresponding increases in operating expenses.
Break-even Analysis
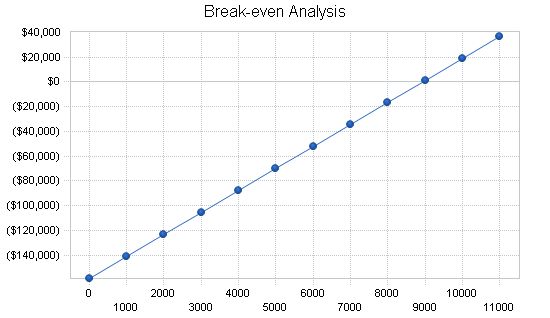
The break-even analysis is a useful financial indicator. The table and chart below illustrate break-even based on monthly sales and fixed costs. With these assumptions, we reach break-even by the end of the first year.
Break-even Analysis
—————————————-
Monthly Units Break-even: 8,948
Monthly Revenue Break-even: $264,916
Assumptions:
—————————————-
Average Per-Unit Revenue: $29.61
Average Per-Unit Variable Cost: $11.84
Estimated Monthly Fixed Cost: $158,950
Projected Profit and Loss
—————————————-
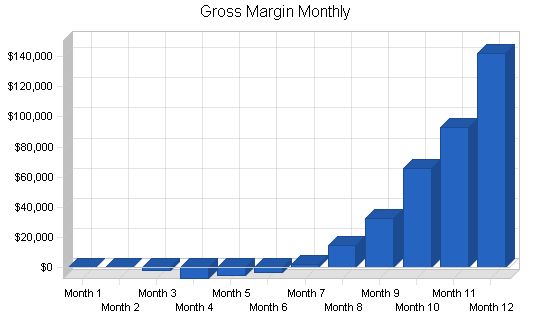
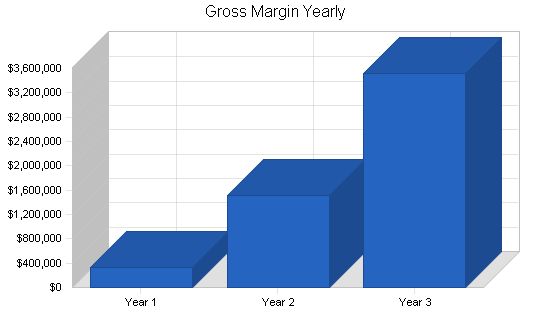
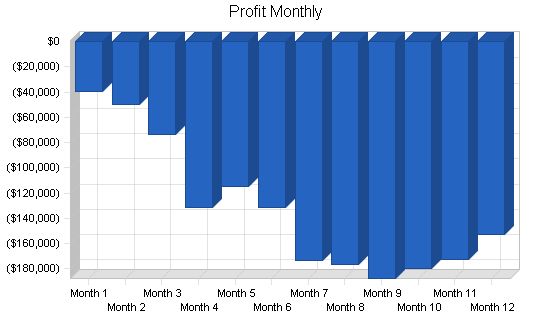
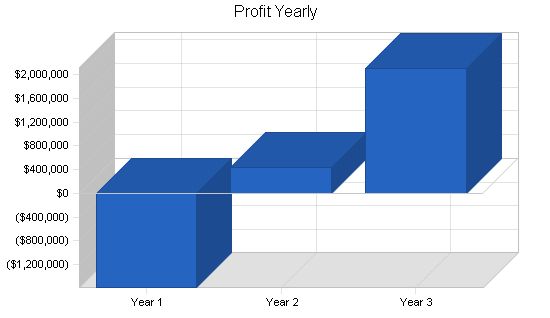
Despite the current trend of encouraging losses for website businesses, we believe that we can turn a profit by the third year. We also aim to significantly reduce losses in the second year, as shown in the following table. However, the investment in online and offline advertising is substantial, and the traffic justifies the loss.
Pro Forma Profit and Loss:
| Pro Forma Profit and Loss | |||
| Year 1 | Year 2 | Year 3 | |
| Sales | $765,200 | $2,887,500 | $6,375,000 |
| Direct Cost of Sales | $306,080 | $1,155,000 | $2,550,000 |
| Production Payroll | $81,000 | $225,000 | $305,000 |
| Fulfillment | $45,845 | $0 | $0 |
| Total Cost of Sales | $432,925 | $1,380,000 | $2,855,000 |
| Gross Margin | $332,275 | $1,507,500 | $3,520,000 |
| Gross Margin % | 43.42% | 52.21% | 55.22% |
| Operating Expenses | |||
| Sales and Marketing Expenses | |||
| Sales and Marketing Payroll | $174,100 | $315,000 | $460,000 |
| Online Advertising | $640,880 | $0 | $0 |
| Other Advertising | $444,400 | $0 | $0 |
| Collaterals | $42,000 | $0 | $0 |
| Events | $20,000 | $0 | $0 |
| Public Relations | $27,000 | $0 | $0 |
| Website Infrastructure | $90,000 | $0 | $0 |
| Other Sales and Marketing Expenses | $12,000 | $0 | $0 |
| Total Sales and Marketing Expenses | $1,450,380 | $315,000 | $460,000 |
| Sales and Marketing % | 189.54% | 10.91% | 7.22% |
| General and Administrative Expenses | |||
| General and Administrative Payroll | $176,700 | $290,000 | $370,000 |
| Marketing/Promotion | $0 | $0 | $0 |
| Depreciation | $2,000 | $0 | $0 |
| Leased Equipment | $9,000 | $0 | $0 |
| Utilities | $2,400 | $0 | $0 |
| Insurance | $500 | $0 | $0 |
| Rent | $42,000 | $0 | $0 |
| Payroll Taxes | $83,115 | $163,800 | $221,250 |
| Other General and Administrative Expenses | $0 | $0 | $0 |
| Total General and Administrative Expenses | $315,715 | $453,800 | $591,250 |
| General and Administrative % | 41.26% | 15.72% | 9.27% |
| Other Expenses: | |||
| Other Payroll | $122,300 | $262,000 | $340,000 |
| Consultants | $0 | $0 | $0 |
| Software & Equipment | $19,000 | $0 | $0 |
| Total Other Expenses | $141,300 | $262,000 | $340,000 |
| Other % | 18.47% | 9.07% | 5.33% |
| Total Operating Expenses | $1,907,395 | $1,030,800 | $1,391,250 |
| Profit Before Interest and Taxes | ($1,575,120) | $476,700 | $2,128,750 |
| EBITDA | ($1,573,120) | $476,700 | $2,128,750 |
| Interest Expense | $6,667 | $32,750 | $32,750 |
| Taxes Incurred | $0 | $0 | $0 |
| Net Profit | ($1,581,787) | $443,950 | $2,096,000 |
| Net Profit/Sales | -206.72% | 15.37% | 32.88% |
Projected Cash Flow:
In this venture, cash flow is mainly supported by new capital from additional rounds of financing.
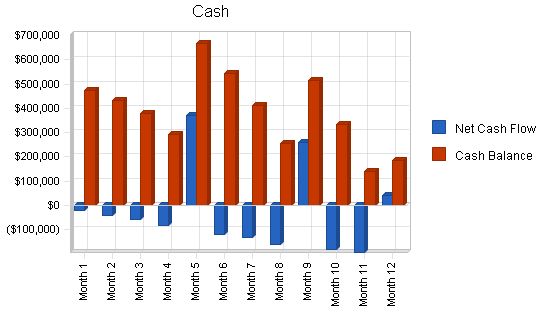
Pro Forma Cash Flow
| Pro Forma Cash Flow | |||
| Year 1 | Year 2 | Year 3 | |
| Cash Received | |||
| Cash Sales | $688,680 | $2,598,750 | $5,737,500 |
| Cash from Receivables | $30,364 | $160,735 | $427,137 |
| Subtotal Cash from Operations | $719,044 | $2,759,485 | $6,164,637 |
| Additional Cash Received | |||
| Sales Tax, VAT, HST/GST Received | $0 | $0 | $0 |
| New Current Borrowing | $0 | $15,000 | $0 |
| New Other Liabilities (interest-free) | $0 | $0 | $0 |
| New Long-term Liabilities | $400,000 | $0 | $0 |
| Sales of Other Current Assets | $0 | $0 | $0 |
| Sales of Long-term Assets | $0 | $0 | $0 |
| New Investment Received | $750,000 | $0 | $0 |
| Subtotal Cash Received | $1,869,044 | $2,774,485 | $6,164,637 |
| Expenditures | Year 1 | Year 2 | Year 3 |
| Expenditures from Operations | |||
| Cash Spending | $554,100 | $1,092,000 | $1,475,000 |
| Bill Payments | $1,543,999 | $1,864,092 | $2,814,373 |
| Subtotal Spent on Operations | $2,098,099 | $2,956,092 | $4,289,373 |
| Additional Cash Spent | |||
| Sales Tax, VAT, HST/GST Paid Out | $0 | $0 | $0 |
| Principal Repayment of Current Borrowing | $0 | $0 | $15,000 |
| Other Liabilities Principal Repayment | $0 | $0 | $0 |
| Long-term Liabilities Principal Repayment | $80,000 | $0 | $0 |
| Purchase Other Current Assets | $0 | $0 | $0 |
| Purchase Long-term Assets | $0 | $0 | $0 |
| Dividends | $0 | $0 | $0 |
| Subtotal Cash Spent | $2,178,099 | $2,956,092 | $4,304,373 |
| Net Cash Flow | ($309,055) | ($181,607) | $1,860,264 |
| Cash Balance | $184,945 | $3,338 | $1,863,603 |
Projected Balance Sheet
The balance sheet shows our projected financial position during the next three years. Obviously the key variable during this period, overall valuation, isn’t shown.
| Pro Forma Balance Sheet | |||
| Year 1 | Year 2 | Year 3 | |
| Assets | |||
| Current Assets | |||
| Cash | $184,945 | $3,338 | $1,863,603 |
| Accounts Receivable | $46,156 | $174,171 | $384,534 |
| Inventory | $122,342 | $399,522 | $516,071 |
| Other Current Assets | $5,000 | $5,000 | $5,000 |
| Total Current Assets | $358,443 | $582,032 | $2,769,209 |
| Long-term Assets | |||
| Long-term Assets | $0 | $0 | $0 |
| Accumulated Depreciation | $2,000 | $2,000 | $2,000 |
| Total Long-term Assets | ($2,000) | ($2,000) | ($2,000) |
| Total Assets | $356,443 | $580,032 | $2,767,209 |
| Liabilities and Capital | Year 1 | Year 2 | Year 3 |
| Current Liabilities | |||
| Accounts Payable | $369,230 | $133,868 | $240,045 |
| Current Borrowing | $0 | $15,000 | $0 |
| Other Current Liabilities | $0 | $0 | $0 |
| Subtotal Current Liabilities | $369,230 | $148,868 | $240,045 |
| Long-term Liabilities | $320,000 | $320,000 | $320,000 |
| Total Liabilities | $689,230 | $468,868 | $560,045 |
| Paid-in Capital | $1,282,750 | $1,282,750 | $1,282,750 |
| Retained Earnings | ($33,750) | ($1,615,537) | ($1,171,587) |
| Earnings | ($1,581,787) | $443,950 | $2,096,000 |
| Total Capital | ($332,787) | $111,163 | $2,207,163 |
| Total Liabilities and Capital | $356,443 | $580,032 | $2,767,209 |
| Net Worth | ($332,787) | $111,163 | $2,207,163 |
Our ratios, as projected here, are typical of the kind of growth company we project. The comparisons are based on NAICS code 454111, Electronic Shopping. We do expect our gross margin and sales per employee to be much higher than standard retail.
| Ratio Analysis | ||||
| Year 1 | Year 2 | Year 3 | Industry Profile | |
| Sales Growth | n.a. | 277.35% | 120.78% | 7.56% |
| Percent of Total Assets | ||||
| Accounts Receivable | 12.95% | 30.03% | 13.90% | 12.42% |
| Inventory | 34.32% | 68.88% | 18.65% | 38.62% |
| Pro Forma Cash Flow | |||||||||||||
| Month 1 | Month 2 | Month 3 | Month 4 | Month 5 | Month 6 | Month 7 | Month 8 | Month 9 | Month 10 | Month 11 | Month 12 | ||
| Cash Received | |||||||||||||
| Cash from Operations | |||||||||||||
| Cash Sales | $0 | $0 | $0 | $2,133 | $5,751 | $7,965 | $16,470 | $41,562 | $70,443 | $123,255 | $170,856 | $250,245 | |
| Cash from Receivables | $0 | $0 | $0 | $0 | $8 | $250 | $647 | $917 | $1,923 | $4,725 | $8,023 | $13,871 | |
| Subtotal Cash from Operations | $0 | $0 | $0 | $2,133 | $5,759 | $8,215 | $17,117 | $42,479 | $72,366 | $127,980 | $178,879 | $264,116 | |
| Additional Cash Received | |||||||||||||
| Sales Tax, VAT, HST/GST Received | 0.00% | $0 | $0 | $0 | $0 | $0 | $0 | $0 | $0 | $0 | $0 | $0 | |
| New Current Borrowing | $0 | $0 | $0 | $0 | $0 | $0 | $0 | $0 | $0 | $0 | $0 | $0 | |
| New Other Liabilities (interest-free) | $0 | $0 | $0 | $0 | $0 | $0 | $0 | $0 | $0 | $0 | $0 | $0 | |
| New Long-term Liabilities | $0 | $0 | $0 | $0 | $0 | $0 | $0 | $0 | $200,000 | $0 | $0 | $200,000 | |
| Sales of Other Current Assets | $0 | $0 | $0 | $0 | $0 | $0 | $0 | $0 | $0 | $0 | $0 | $0 | |
| Sales of Long-term Assets | $0 | $0 | $0 | $0 | $0 | $0 | $0 | $0 | $0 | $0 | $0 | $0 | |
| New Investment Received | $0 | $0 | $0 | $0 | $500,000 | $0 | $0 | $0 | $250,000 | $0 | $0 | $0 | |
| Subtotal Cash Received | $0 | $0 | $0 | $2,133 | $505,759 | $8,215 | $17,117 | $42,479 | $522,366 | $127,980 | $178,879 | $464,116 | |
| Expenditures from Operations | |||||||||||||
| Cash Spending | $20,000 | $20,000 | $25,500 | $35,500 | $35,500 | $40,500 | $46,800 | $51,700 | $57,500 | $63,300 | $72,100 | $85,700 | |
| Bill Payments | $648 | $19,797 | $30,465 | $49,999 | $98,607 | $88,207 | $102,120 | $149,869 | $184,262 | $224,360 | $279,966 | $315,699 | |
| Subtotal Spent on Operations | $20,648 | $39,797 | $55,965 | $85,499 | $134,107 | $128,707 | $148,920 | $201,569 | $241,762 | $287,660 | $352,066 | $401,399 | |
| Additional Cash Spent | |||||||||||||
| Sales Tax, VAT, HST/GST Paid Out | $0 | $0 | $0 | $0 | $0 | $0 | $0 | $0 | $0 | $0 | $0 | $0 | |
| Principal Repayment of Current Borrowing | $0 | $0 | $0 | $0 | $0 | $0 | $0 | $0 | $0 | $0 | $0 | $0 | |
| Other Liabilities Principal Repayment | $0 | $0 | $0 | $0 | $0 | $0 | $0 | $0 | $0 | $0 | $0 | $0 | |
| Long-term Liabilities Principal Repayment | $0 | $0 | $0 | $0 | $0 | $0 | $0 | $0 | $20,000 | $20,000 | $20,000 | $20,000 | |
| Purchase Other Current Assets | $0 | $0 | $0 | $0 | $0 | $0 | $0 | $0 | $0 | $0 | $0 | $0 | |
| Purchase Long-term Assets | $0 | $0 | $0 | $0 | $0 | $0 | $0 | $0 | $0 | $0 | $0 | $0 | |
| Dividends | $0 | $0 | $0 | $0 | $0 | $0 | $0 | $0 | $0 | $0 | $0 | $0 | |
| Subtotal Cash Spent | $20,648 | $39,797 | $55,965 | $85,499 | $134,107 | $128,707 | $148,920 | $201,569 | $261,762 | $307,660 | $372,066 | $421,399 | |
| Net Cash Flow | ($20,648) | ($39,797) | ($55,965) | ($83,366) | $371,652 | ($120,492) | ($131,802) | ($159,090) | $260,604 | ($179,680) | ($193,187) | $42,717 | |
| Cash Balance | $473,352 | $433,555 | $377,590 | $294,224 | $665,876 | $545,384 | $413,582 | $254,492 | $515,096 | $335,415 | $142,228 | $184,945 | |
Pro Forma Balance Sheet
| Balance Sheet | |||||||||||||
| 1 | 2 | 3 | 4 | 5 | 6 | 7 | 8 | 9 | 10 | 11 | 12 | ||
| Assets | Starting Balances | ||||||||||||
| Current Assets | |||||||||||||
| Cash | $494,000 | $473,352 | $433,555 | $377,590 | $294,224 | $665,876 | $545,384 | $413,582 | $254,492 | $515,096 | $335,415 | $142,228 | $184,945 |
| Accounts Receivable | $0 | $0 | $0 | $0 | $237 | $868 | $1,503 | $2,686 | $6,387 | $12,291 | $21,261 | $32,223 | $46,156 |
| Inventory | $0 | $0 | $0 | $0 | $1,043 | $2,812 | $3,894 | $8,052 | $20,319 | $34,439 | $60,258 | $83,530 | $122,342 |
| Other Current Assets | $5,000 | $5,000 | $5,000 | $5,000 | $5,000 | $5,000 | $5,000 | $5,000 | $5,000 | $5,000 | $5,000 | $5,000 | $5,000 |
| Total Current Assets | $499,000 | $478,352 | $438,555 | $382,590 | $300,503 | $674,556 | $555,781 | $429,319 | $286,198 | $566,826 | $421,934 | $262,980 | $358,443 |
| Long-term Assets | |||||||||||||
| Long-term Assets | $0 | $0 | $0 | $0 | $0 | $0 | $0 | $0 | $0 | $0 | $0 | $0 | $0 |
| Accumulated Depreciation | $0 | $0 | $0 | $0 | $0 | $0 | $0 | $0 | $0 | $0 | $0 | $0 | $2,000 |
| Total Long-term Assets | $0 | $0 | $0 | $0 | $0 | $0 | $0 | $0 | $0 | $0 | $0 | $0 | ($2,000) |
| Total Assets | $499,000 | $478,352 | $438,555 | $382,590 | $300,503 | $674,556 | $555,781 | $429,319 | $286,198 | $566,826 | $421,934 | $262,980 | $356,443 |
| Liabilities and Capital | |||||||||||||
| Current Liabilities | |||||||||||||
| Accounts Payable | $0 | $18,802 | $28,855 | $46,700 | $95,680 | $84,857 | $97,162 | $143,770 | $176,846 | $215,067 | $269,519 | $302,967 | $369,230 |
| Current Borrowing | $0 | $0 | $0 | $0 | $0 | $0 | $0 | $0 | $0 | $0 | $0 | $0 | $0 |
| Other Current Liabilities | $0 | $0 | $0 | $0 | $0 | $0 | $0 | $0 | $0 | $0 | $0 | $0 | $0 |
| Subtotal Current Liabilities | $0 | $18,802 | $28,855 | $46,700 | $95,680 | $84,857 | $97,162 | $143,770 | $176,846 | $215,067 | $269,519 | $302,967 | $369,230 |
| Long-term Liabilities | $0 | $0 | $0 | $0 | $0 | $0 | $0 | $0 | $0 | $180,000 | $160,000 | $140,000 | $320,000 |
| Total Liabilities | $0 | $18,802 | $28,855 | $46,700 | $95,680 | $84,857 | $97,162 | $143,770 | $176,846 | $395,067 | $429,519 | $442,967 | $689,230 |
| Paid-in Capital | $532,750 | $532,750 | $532,750 | $532,750 | $532,750 | $1,032,750 | $1,032,750 | $1,032,750 | $1,032,750 | $1,282,750 | $1,282,750 | $1,282,750 | $1,282,750 |
| Retained Earnings | ($33,750) | ($33,750) | ($33,750) | ($33,750) | ($33,750) | ($33,750) | ($33,750) | ($33,750) | ($33,750) | ($33,750) | ($33,750) | ($33,750) | ($33,750) |
| Earnings | $0 | ($39,450) | ($89,300) | ($163,110) | ($294,177) | ($409,301) | ($540,381) | ($713,451) | ($889,648) | ($1,077,241) | ($1,256,584) | ($1,428,987) | ($1,581,787) |
| Total Capital | $499,000 | $459,550 | $409,700 | $335,890 | $204,823 | $589,699 | $458,619 | $285,549 | $109,352 | $171,759 | ($7,584) | ($179,987) | |
Hello!
I’m Andrew Brooks, a seasoned finance consultant from the USA and the mind behind phonenumber247.com.
My career is built on a foundation of helping individuals and businesses thrive financially in an ever-changing economic landscape. At phonenumber247.com, my aim is to demystify the complex world of finance, providing clear, actionable advice that can help you navigate your financial journey with confidence. Whether it’s personal finance management, investment strategies, or understanding the nuances of market dynamics, I’m here to share insights and tools that can propel you towards your financial goals.
Welcome to my digital space, where every piece of advice is a step closer to financial clarity and success!


