Information Technology Business Plan
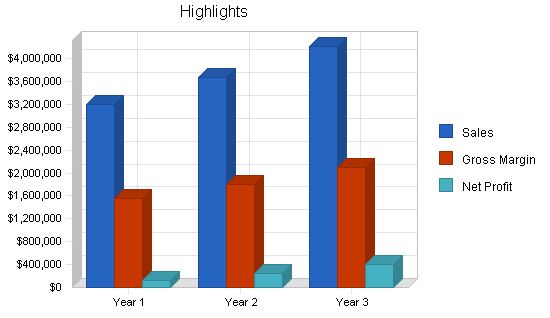
By focusing on strengths, key customers, and their underlying values, Information Management Hawai’i, Inc. (IMH) will steadily increase sales in its first three years, while also maintaining gross margin and prioritizing cash management and working capital.
This business plan sets forth our vision and strategic focus: adding value to target market segments and reinforcing ties with local businesses. It also provides a step-by-step plan for improving sales, gross margin, and profitability.
This plan includes a summary, chapters on the company, products and services, market focus, action plans and forecasts, management team, and financial plan.
1.1 Objectives
1. Achieve healthy earnings in the first year.
2. Maintain a midrange gross margin throughout.
3. Maintain just-in-time inventory levels.
4. Increase sales modestly but steadily in the second and third years.
1.2 Mission
To provide the Hawai’i business community with quality brand-name Information Technology solutions, reliable Technical Support, and unparalleled Customer Service through the principles of Kina‘ole and aloha, and to earn a fair profit for our employee-owners and stakeholders through sound, ethical business practices.
1.3 Keys to Success
The keys to our success are:
- Building and maintaining strategic alliances with manufacturers and other industry partners
- Adopting a customer- and market-focused sales and marketing paradigm
- Managing the business by implementing, measuring, and adjusting the fundamentals of a Balanced Scorecard:
- Financial Goals vs. Results
- Internal Business Process Goals vs. Results
- Employee Learning and Growth Goals vs. Results
- Customer Satisfaction Goals vs. Results
Company Summary
Information Management Hawaii, Inc., will sell and service digital office information systems for Hawaii’s businesses, with a focus on the Neighbor Island business community. IMH will be formed as the result of the acquisition of three existing businesses: Maui Office Machines, Inc.; Electronics Hawaii, Inc.; and, Kauai Office Equipment, Inc.
2.1 Company Ownership
IMH will be privately-held and majority-owned by the IMH Employee Stock Ownership Trust. There are currently 15 employees, and all will own equal shares in the ESOT. New employees will have the opportunity to become vested in the Employee Stock Ownership Plan (ESOP) after a suitable probationary period.
2.2 Start-up Summary
Our start-up costs will be $1M, including $450,000 for the acquisition of the Maui and Hilo operations of Servco Integrated Office Technology.
The remainder of the funds will be used for:
- Initial Inventory: $200,000
- Initial Capitalization: $225,000
- Legal, Insurance, Rent & Misc: $125,000
The start-up funding will be financed by loans arranged through the Small Business Development Center, the Hawaii Community Loan Fund, and the Small Business Administration as a guarantor. Start-up assumptions are shown in the following table and chart.
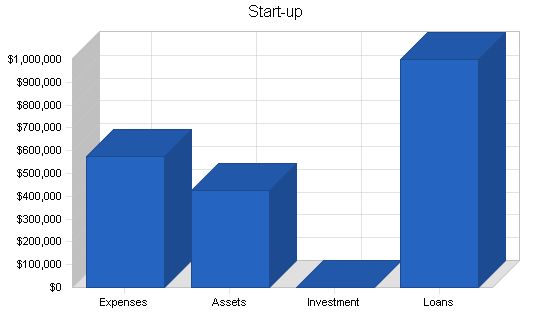
Start-up Requirements:
– Legal/Accounting: $10,000
– Stationery: $1,500
– Brochures: $1,000
– Consultants: $7,500
– Insurance: $25,000
– Rent: $15,000
– Software & IT (Web): $40,000
– SPI Buyout: $450,000
– Setup New Company/ESOP: $25,000
– Total Start-up Expenses: $575,000
Start-up Assets:
– Cash Required: $225,000
– Start-up Inventory: $200,000
– Other Current Assets: $0
– Long-term Assets: $0
– Total Assets: $425,000
Total Requirements: $1,000,000
Start-up Funding:
– Start-up Expenses to Fund: $575,000
– Start-up Assets to Fund: $425,000
– Total Funding Required: $1,000,000
Assets:
– Non-cash Assets from Start-up: $200,000
– Cash Requirements from Start-up: $225,000
– Additional Cash Raised: $0
– Cash Balance on Starting Date: $225,000
– Total Assets: $425,000
Liabilities and Capital:
– Liabilities
– Current Borrowing: $1,000,000
– Long-term Liabilities: $0
– Accounts Payable: $0
– Other Current Liabilities: $0
– Total Liabilities: $1,000,000
– Capital
– Planned Investment
– Investor 1: $0
– Investor 2: $0
– Other: $0
– Additional Investment Requirement: $0
– Total Planned Investment: $0
– Loss at Start-up: ($575,000)
– Total Capital: ($575,000)
– Total Capital and Liabilities: $425,000
– Total Funding: $1,000,000
Company Locations and Facilities:
We have two locations, one in Kahului, Maui and the other in Hilo, Hawai’i. The two offices are presently being leased by Servco Pacific, Inc., and we will rent from them on a month-to-month basis until we are able to relocate to more suitable facilities. On Kauai, we have a sub-contractor agreement with Kauai Office Equipment to handle installations and service.
Products and Services:
IMH will acquire an existing operation in the office equipment industry and transform it into a value-added provider of information industry services and technologies. We will offer total workflow solutions utilizing multifunctional imaging platforms and information distribution systems, backed by technical service and proactive customer service. We will also form strategic alliances with local information industry value-added resellers to offer turnkey LAN systems and retrofit existing systems.
Sales Literature:
One of our first tasks will be to change the message of our literature to focus on selling the company rather than the product.
Product and Service Description:
IMH will market and sell brand name business information distribution systems and hardware, technical service and support, and consumable supplies. We will be a single-source provider for business information and imaging products and services. Our hardware product offerings include multifunctional products, facsimiles, graphics reproduction products, micrographics products, and printers. Software offerings include scan stations, document distribution, and desktop software. We also offer service products such as maintenance agreements and walk-in service, as well as professional services like information workflow analysis and network design.
Competitive Comparison:
To differentiate ourselves, we will focus on being an information technology ally to our clients. We will provide not just products, but also confidence, reliability, and comprehensive service and support. Our competitors tend to only sell products, lacking after-sale training and support. We will charge separately for services and consumable supplies.
Technology:
New technology has transformed the traditional office equipment industry. IMH will embrace convergence and aim to bring efficient workflow solutions to our clients while providing value-added customer support and service.
Service and Support:
Our strategy relies on unparalleled service and support to set us apart from the competition. We will offer uptime guarantees, internal and customer training, upgrade analysis, and other support benefits.
Future Products and Services:
Moving forward, we will research new information technologies to include in our offerings. Our future products and services will include wireless LAN systems, information management systems, tele-business and e-commerce systems, and media transport and reproduction.
Fulfillment:
We have established relationships with manufacturers and suppliers, allowing us to take advantage of discounts and promotions. We will also implement just-in-time inventory strategies to strengthen our margins.
Market Analysis Summary:
IMH will focus on local markets, including small offices and home offices, medium to large businesses, corporate Hawai’i, and local government offices.
Market Segmentation:
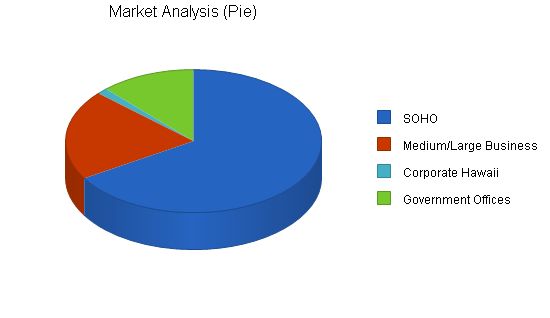
Our market segmentation includes small offices and home offices, medium to large businesses, corporate Hawai’i, and local government offices. We will target the SOHO segment with affordable and customized solutions, focusing on service and support. For medium to large businesses, we will design customized solutions and work closely with them. The corporate Hawai’i segment is a small but lucrative market that we will penetrate with professional services. We have established relationships within the local government segment and will offer value-added service and support to increase our share.
Market Analysis
Year 1 Year 2 Year 3 Year 4 Year 5
Potential Customers Growth CAGR
SOHO 4% 6,800 7,072 7,355 7,649 7,955 4.00%
Medium/Large Business 4% 2,100 2,184 2,271 2,362 2,456 3.99%
Corporate Hawaii 3% 140 144 148 152 157 2.91%
Government Offices 2% 1,225 1,243 1,262 1,281 1,300 1.50%
Total 3.69% 10,265 10,643 11,036 11,444 11,868 3.69%
4.2 Target Market Segment Strategy
Our market strategy is a departure from our past focus on products and prices. Instead, we aim to become a customer- and market-focused organization. All departments will share responsibility for customer satisfaction. To achieve this shift, we will implement a balanced scorecard philosophy of management and prioritize employee learning and growth.
Our market segmentation strategy is straightforward and addresses all components of the Neighbor Island business community. We will regularly consult with marketing specialists and manufacturers to refine our strategies for each of the four identified segments.
4.2.1 Market Trends
The most significant trend in today’s business-to-business marketplace is the shift from analog to digital technology and from stand-alone workflow functions to multifunctional platforms connected to a network. This trend has caused major players in the outdated office equipment industry to falter due to their inability to adapt. IMH has chosen Canon USA as its preferred manufacturer due to their leadership in digital technology innovations.
4.2.2 Market Growth
Computer prices continue to fall, resulting in increased unit sales. Sales of personal computers in the United States alone are growing at a rate of more than 20 percent per year, absorbing over 30 million units annually. This growth rate applies to productivity systems connected to computers as well. The outdated analog systems and appliances in the business marketplace will be replaced by connected digital convergence systems. IMH aims to provide value-added technology solutions to new businesses while maintaining and upgrading our current analog customer base.
4.2.3 Market Needs
All businesses have a common need for continuous productivity. They rely on their service providers and vendors to sustain their productivity. IMH’s strength lies in our ability to gather, compile, analyze, and distribute information in various media formats. We offer a customer-focused approach to meet specific business needs and provide peace-of-mind.
The Neighbor Island business community has an additional need for quick, reliable, local customer service and support. Calling someone on Oahu or the mainland for service calls, supplies, or billing questions is both inconvenient and hindering. IMH aims to fill this need by providing proactive and comprehensive customer service to gain the confidence and loyalty of the Neighbor Island business community.
4.3 Service Business Analysis
IMH is part of the Information Industry, specializing in information management systems and technology for business processes. An advanced information infrastructure could boost U.S. businesses by more than $300 billion annually and increase worker productivity by 20 to 40 percent. With the increasing shift from manufacturing to service industries, the convergence of information industries will continue.
4.3.1 Competition and Buying Patterns
Business decision makers understand the value of service and support and are willing to pay for it when it is clearly stated. While price is traditionally presented as the primary factor, many target market segments would prefer to pay a premium for a long-term vendor relationship that offers quality service and support. IMH aims to present its offering as a clear alternative to competitors and highlight the benefits of a customer-oriented approach.
Availability is also important to business decision makers, who prefer immediate local solutions to problems.
4.3.2 Distributing a Service
Medium to large businesses are accustomed to buying from vendors who visit their offices. However, our SOHO target segment may not expect to buy from us and often seek lower prices from retail superstores, websites, or mail-order options. IMH plans to overcome this by offering innovative service offerings and targeted marketing.
4.3.3 Main Competitors
In the medium to large business segments, our primary competitors are Xerox and Lanier, while Maui Office Machines, Business Equipment, Electronics Hawai’i, and Stationers are the secondary low-end competitors on the Neighbor Islands. IMH’s competitive advantage in these segments will be Canon’s superior technology and value-added service and support.
In the SOHO target segment, the main competitors are superstores such as Office Max, Office Depot, Sears, Costco, Hopaco, and various web platforms. IMH differentiates itself by providing aftermarket service and support, setting it apart from these "box movers."
4.3.4 Business Participants
The copier industry is dominated by major manufacturers such as Xerox, Canon, Oce, and Ricoh, who distribute and sell mainly through authorized dealers. Canon has emerged as both an innovator and leader in the new Information Industry with its digital products and information distribution systems.
Strategy and Implementation Summary
To differentiate ourselves from our competitors, we will emphasize our role as a strategic ally and offer quality products backed by premium service and support. By building long-standing relationships with satisfied clients, we aim to develop a strong reputation and benefit from word-of-mouth advertising.
Our main strategy is to focus on service and support, utilizing networking expertise, systems training, and customer relationship management (CRM) software. By marketing the company and fostering regular contacts with customers, we aim to increase sales per customer and establish IMH as the preferred vendor in our target markets.
Our value proposition lies in offering peace-of-mind to our clients through a customer-focused approach, quality products, and reliable support.
Our sales strategy revolves around selling IMH as a strategic ally and highlighting the reputation of the industry-leading manufacturers we represent. We emphasize the importance of service and support in providing total solutions to our customers.
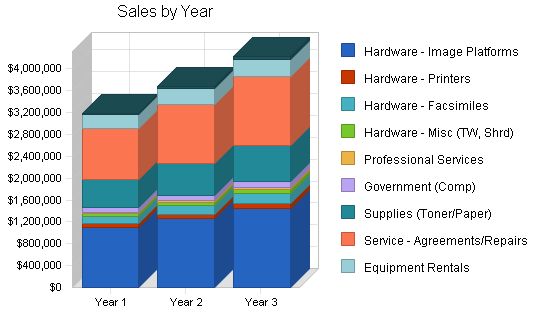
The yearly total sales chart summarizes our conservative sales forecast, with an expected increase from $3.1 million in the first year to over $4 million in the third year.
Sales Forecast
The important elements of the sales forecast are shown in the chart and table below. Non-hardware sales are expected to reach almost $2 million in the third year, accounting for 47% of total sales.
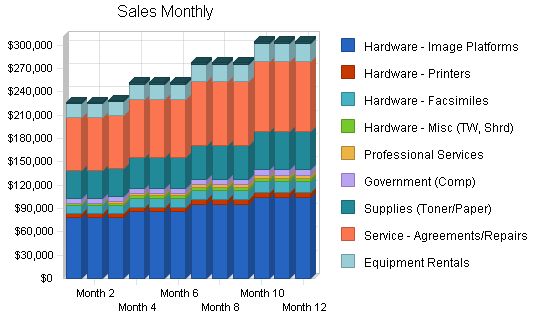
Sales Forecast
| Sales Forecast | |||
| Year 1 | Year 2 | Year 3 | |
| Sales | |||
| Hardware – Image Platforms | $1,092,956 | $1,256,899 | $1,445,434 |
| Hardware – Printers | $69,615 | $80,057 | $92,066 |
| Hardware – Facsimiles | $142,711 | $164,117 | $188,735 |
| Hardware – Misc (TW, Shrd) | $45,250 | $52,037 | $59,843 |
| Professional Services | $29,808 | $34,279 | $39,420 |
| Government (Comp) | $87,019 | $100,072 | $115,082 |
| Supplies (Toner/Paper) | $501,228 | $576,412 | $662,874 |
| Service – Agreements/Repairs | $946,764 | $1,088,779 | $1,252,095 |
| Equipment Rentals | $243,653 | $280,200 | $322,230 |
| Other | $31,327 | $36,026 | $41,430 |
| Total Sales | $3,190,329 | $3,668,878 | $4,219,209 |
5.5 Milestones
The following table lists important program milestones, with dates, managers in charge, and budgets for each. The milestone schedule indicates our emphasis on planning for implementation. The most important programs are the sales and marketing programs listed in detail in the previous topics.
| Milestones | ||||||||
| Milestone | Start Date | End Date | Budget | Manager | Department | |||
| SIOT (NI) Valuation | 5/1/2001 | 5/31/2001 | $0 | BH | Admin | |||
| Complete Business Plan | 5/14/2001 | 6/22/2001 | $200 | BH | Admin | |||
| Submit Letter of Intent | 6/1/2001 | 6/15/2001 | $0 | BH | Admin | |||
| Choose New Company Name | 6/15/2001 | 7/31/2001 | $0 | All | All | |||
| Secure Startup Funding | 6/15/2001 | 7/31/2001 | $0 | BH/All | All | |||
| Retain Attorney/CPA | 6/15/2001 | 7/31/2001 | $10,000 | BH | Marketing | |||
| Negotiate Purchase Agreement | 6/18/2001 | 8/15/2001 | $0 | BH/All | Admin | |||
| Set Up ESOT/ESOP | 6/30/2001 | 8/31/2001 | $12,500 | BH/LW | All | |||
| Set Up New Corporation | 6/30/2001 | 8/31/2001 | $12,500 | BH/LW | All | |||
| Solicit Board Members | 6/30/2001 | 8/31/2001 | $0 | BH | All | |||
| HR Roll-Over Plan (SPI to IMH) | 7/1/2001 | 8/31/2001 | $0 | BH/LW | Admin | |||
| Purchase e-Automate Software | 8/1/2001 | 8/31/2001 | $20,000 | BH/LW | Admin | |||
| A/P & A/R into e-Automate | 8/1/2001 | 8/31/2001 | $0 | LW | Admin | |||
| Business Licenses/Permits | 8/1/2001 | 8/31/2001 | $500 | BH/LW | Admin | |||
| Customers into e-Automate | 8/1/2001 | 8/31/2001 | $0 | JM/BK | Sales | |||
| Inventory into e-Automate | 8/1/2001 | 8/31/2001 | $0 | LW/JA/EO | Service | |||
| Letter To Vendors/Customers | 8/1/2001 | 8/31/2001 | $0 | LW | Admin | |||
| New Stationary/Brochures | 8/1/2001 | 8/31/2001 | $2,500 | LW | Admin | |||
| Obtain Insurance | 8/1/2001 | 8/31/2001 | $25,000 | BH/LW | Admin | |||
| Switch Utilities To IMH | 8/1/2001 | 8/31/2001 | $1,000 | LW | Admin | |||
| Web Site Development | 8/1/2001 | 8/31/2001 | $10,000 | BH | Admin | |||
| Complete Marketing Plan | 8/1/2001 | 8/31/2001 | $2,500 | All | Sales | |||
| IMH Operations – Day 1 | 9/3/2001 | 9/3/2001 | $0 | All | All | |||
| Bd. of Dir. Mtg. (First) | 9/4/2001 | 9/7/2001 | $1,000 | All | All | |||
| All Company – Kick Off Mtg. | 9/4/2001 | 9/7/2001 | $750 | All | All | |||
| Sales Strategies & Programs | 9/4/2001 | 9/30/2001 | $2,500 | JM | Sales | |||
| Marketing Strategy & Programs | 9/4/2001 | 9/30/2001 | $3,500 | BK | Sales | |||
| First Quarter BP Review | 12/10/2001 | 12/14/2001 | $0 | All | All | |||
| Headcount Review | 12/10/2001 | 12/14/2001 | $0 | BH/EO/JA | Sales/Svc | |||
| Bd. of Dir. Mtg. (Qtrly) | 12/10/2001 | 12/14/2001 | $1,000 | All | All | |||
| Cost IT Training Sources | 3/4/2002 | 3/8/2002 | $0 | BH/EO/JA/BK | Sales/Svc | |||
| Second Quarter BP/MP Review | 3/4/2002 | 3/8/2002 | $0 | All | All | |||
| Enroll Team in IT Training | 3/18/2002 | 3/29/2002 | $2,500 | Personnel Plan | ||||
| Production Personnel | ||||||||
| None planned | $0 | $0 | $0 | |||||
| Other | $0 | $0 | $0 | |||||
| Subtotal | $0 | $0 | $0 | |||||
| Sales and Marketing Personnel | ||||||||
| Alan Fukuyama – Sales (Maui) | $38,250 | $40,545 | $42,978 | |||||
| Brian Kurlansky – Sales (Kona) | $38,250 | $40,545 | $42,978 | |||||
| Jay Moore – Sales (Maui) | $38,250 | $40,545 | $42,978 | |||||
| Wilbert Shimabukuro – Sales (Hilo) | $38,250 | $40,545 | $42,978 | |||||
| Vacant – Aftermarket Sales (Maui) | $0 | $0 | $0 | |||||
| Vacant – Aftermarket Sales (Hilo) | $0 | $0 | $0 | |||||
| Subtotal | $153,000 | $162,180 | $171,911 | |||||
| General and Administrative Personnel | ||||||||
| Bill Harding – General Manager | $57,600 | $61,056 | $64,719 | |||||
| Laurie Watson – Admin Manager | $45,600 | $48,336 | $51,236 | |||||
| Vacant – Office Manager (Hilo) | $31,200 | $33,072 | $35,056 | |||||
| Vacant – Whse & Delivery (Maui) | $0 | $0 | $0 | |||||
| Vacant – Whse & Delivery (Hilo) | $0 | $0 | $0 | |||||
| Other | $0 | $0 | $0 | |||||
| Subtotal | $134,400 | $142,464 | $151,012 | |||||
| Other Personnel | ||||||||
| Earle Oshiro – Systems Manager (Hilo) | $49,800 | $52,788 | $55,955 | |||||
| Joe Alfonsi – Systems Manager (Maui) | $49,800 | $52,788 | $55,955 | |||||
| Wane Ogawa – Syst Engineer (Hilo) | $39,600 | $41,976 | $44,495 | |||||
| Francis Takahashi – Syst Engineer (Hilo) | $39,600 | $41,976 | $44,495 | |||||
| Baron Ganeko – Syst Engineer (Kona) | $39,600 | $41,976 | $44,495 | |||||
| Abe Braceros – Sr. Syst Engineer (Maui) | $41,100 | $43,566 | $46,180 | |||||
| Arlo Villanueva – Syst Tech (Maui) | $28,800 | $30,528 | $32,360 | |||||
| Caroline Nacua – Syst Tech (Maui) | $28,800 | $30,528 | $32,360 | |||||
| Vacant – Syst Tech (Kona) | $0 | $0 | $0 | |||||
| Vacant – Syst Tech (Maui) | $0 | $0 | $0 | |||||
| Subtotal | $317,100 | $336,126 | $356,294 | |||||
| Total People | 15 | 15 | 15 | |||||
| Total Payroll | $604,500 | $640,770 | $679,216 | |||||
6.3 Management Team
Bill Harding, president and general manager: XX years old, and has lived on Maui for 43 years. Joined SIOT in 1998 as Maui branch manager, and became general manager for Neighbor Island operations six months later. Prior management experience includes: BTA market manager of the Neighbor Islands for VoiceStream Wireless, Neighbor Island area sales manager for Central Security Systems, and radar project manager for Telcom International in Nigeria, West Africa. Bill has attended numerous management and sales training courses and seminars throughout his career.
Laurie Watson, secretary/treasurer and administrative manager: XX years old, and local Maui resident. Has been at the same location through three different owners prior to Servco’s acquisition of The Office Place in 1995, for a total of 15 years of local office equipment industry experience. Laurie has extensive knowledge of service procedures and dispatching, A/R and A/P procedures, inventory control and tracking, as well as an intimate knowledge of our customer base. Her experience and knowledge will be invaluable in recovering our customer base, and in growing the business.
Anne Tioganco, office manager (Hilo): XX years old, and local Hilo resident. Anne has also been with the company through all of the acquisitions, and has XX years experience in the office equipment industry. She will assist Laurie by handling the administrative and customer service tasks for our Hilo branch, and will be instrumental in our Big Island customer recovery efforts.
Earle Oshiro, systems manager (Big Island): XX years old, and local Hilo resident. Like Laurie and Anne above, Earle has been with the company through four different owners, and has XX years of local office equipment service management experience. Earle has also completed Canon’s “train the trainer” course, and will be a great asset in the on-going training and development of our systems engineers and technicians.
Joseph Alfonsi, systems manager (Maui): XX years old, and local Maui resident. Joe joined the Maui branch of SIOT in 1999 as field service manager, after transferring from the SIOT Honolulu branch. He has XX years of local office equipment industry service experience, and is familiar with both Canon and Ricoh products. Joe is an asset to the Maui team, and has outstanding customer service skills.
6.4 Management Team Gaps
We believe we have a good team for covering the main points of the business plan. Key members have the experience and knowledge to manage and grow the business, and are highly motivated by the employee-owner concept.
The obvious management gap is a plan to fill the general manager’s position at some point in the future, before the current GM reaches retirement age. As an employee-owned company, the preferred strategy will be to promote from within, and fill vacancies as they occur. As the company grows, we will seek out additional talent in all operational areas.
Financial Plan
Although we are treating the business as a start-up company, the financial plan is solidly based on past performance. We have taken actual SIOT P&L income and expenses from the past three years, and eliminated corporate overhead expenses such as warehouse and administrative costs, inventory penalties, and corporate nominal interest. We then projected income based on actual past performance, and factored back in the revenue base that was relocated to Honolulu over the past two years (mainly service and supplies).
We approached the financial planning from a conservative standpoint, and based those numbers on achievable gross margins. Also, our actual interest and tax rates will most likely be lower than the assumed rates due to our being structured as an employee-owned corporation (ESOT).
7.1 Important Assumptions
The financial plan depends on important assumptions, most of which are shown in Table 7.1. We assumed interest and tax rates based on a “worst case” scenario, and these will be adjusted once we have finalized the initial funding and establish the ESOT. We have also assumed our personnel burden at 30% of payroll in order to allow for above-average benefits for our employees. As we shop around for benefits vendors, this assumption will be subject to revision as well.
Other key business assumptions are:
- We assume continued steady economic growth on the Neighbor Islands as predicted by Bank of Hawaii, and other Hawai’i economists.
- We assume the continued move towards convergence technology in the Information Industry.
- We assume access to the start-up funding necessary to re-shape and re-build the company, and to provide adequate initial capitalization.
| General Assumptions | |||
| Plan Month | 1 | 2 | 3 |
| Current Interest Rate | 14.00% | 14.00% | 14.00% |
| Long-term Interest Rate | 10.00% | 10.00% | 10.00% |
| Tax Rate | 37.33% | 38.00% | 37.33% |
| Other | 0 | 0 | 0 |
7.2 Key Financial Indicators
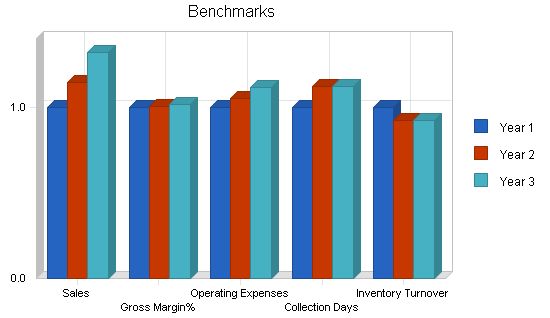
As shown in the Benchmarks chart below, our key financial indicators are:
- Projected Sales: Projections are based on actual past performance, and are conservative. We will increase sales at an average rate of 15% per year.
- Gross Margins: Average gross margins are based on: hardware sales = 37%; service = 57%; supplies = 52%; and, other = 50%, for an overall operating gross margin of 49%.
- Operating Expenses: Operating expenses are based on providing our employee-owners with above average wages and benefits, and providing superior customer service. Expenses are projected to increase at the rate of 6% per year.
- Collection Days (A/R): Based on the extensive use of leasing, and including service and supply agreements into leasing packages, we will maintain an average A/R turnover of 30 days. This is projected to be reduced to 28 days in subsequent years by increasing efficiencies in our internal business processes.
- Inventory Turnover: We will maintain just-in-time inventory levels, or 11 turns per year. This will require accurate sales forecasting, and working closely with our manufacturers. We have already begun this process under SIOT, and the Neighbor Island inventory levels are well below previous years.
7.3 Break-even Analysis
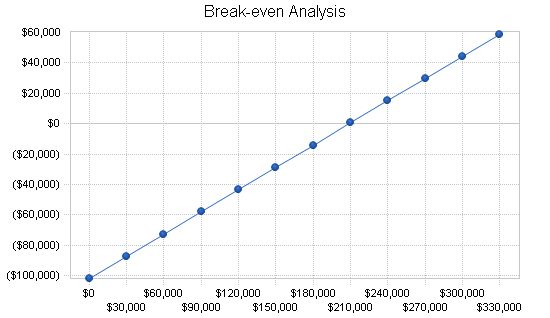
Our break-even analysis assumes running costs, including payroll, rent, and utilities, as well as other estimated expenses. Currently, payroll amounts to approximately $65,500 per month (including benefits and taxes).
We closely monitor gross margins and maintain them at a midrange percentage by taking advantage of manufacturer promotions and discounts. Canon USA has tentatively agreed to offer us “end column” pricing as a new dealer incentive.
The chart illustrates the monthly sales needed to break even based on these assumptions. This represents about 78% of our projected first-year sales and is significantly lower than our annual performance over the past three years, despite more challenging operating conditions.
Break-even Analysis:
Monthly Revenue Break-even: $209,018.
Assumptions:
– Average Percent Variable Cost: 51%.
– Estimated Monthly Fixed Cost: $101,932.
Projected Profit and Loss:
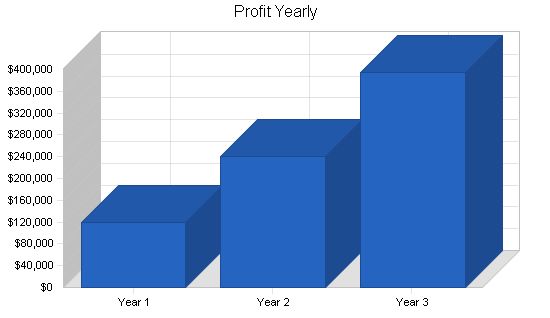
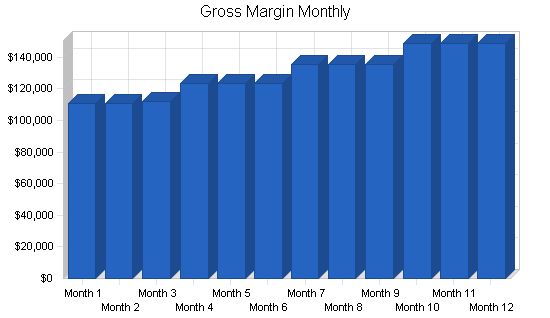
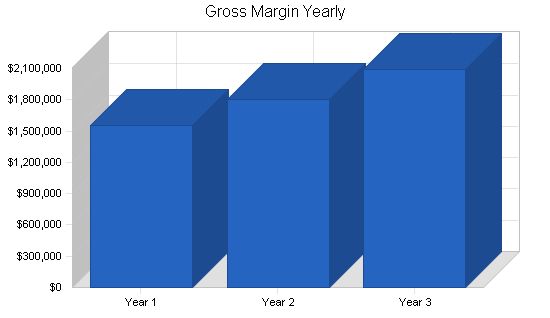
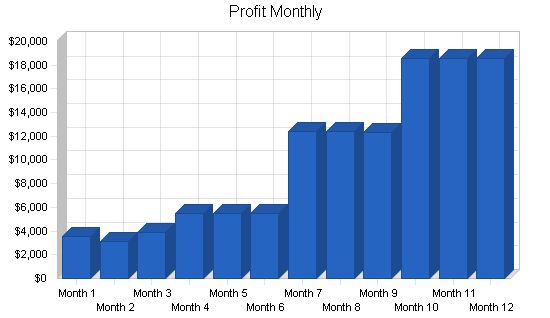
Our Pro Forma Profit and Loss statement was constructed conservatively, based on past performance. By strengthening our service position and rebuilding customer relationships, we will widen our customer base and increase sales.
Month-to-month assumptions for profit and loss are included in the appendix.
Pro Forma Profit and Loss
| Pro Forma Profit and Loss | |||
| Year 1 | Year 2 | Year 3 | |
| Sales | $3,190,329 | $3,668,878 | $4,219,209 |
| Direct Cost of Sales | $1,634,497 | $1,863,326 | $2,124,192 |
| Production Payroll | $0 | $0 | $0 |
| Other | $0 | $0 | $0 |
| Total Cost of Sales | $1,634,497 | $1,863,326 | $2,124,192 |
| Gross Margin | $1,555,832 | $1,805,552 | $2,095,017 |
| Gross Margin % | 48.77% | 49.21% | 49.65% |
| Operating Expenses | |||
| Sales and Marketing Expenses | |||
| Sales and Marketing Payroll | $153,000 | $162,180 | $171,911 |
| Advertising/Promotion | $10,500 | $11,130 | $11,798 |
| Commissions | $159,516 | $169,087 | $179,233 |
| Travel – Sales | $22,500 | $23,850 | $25,281 |
| Learning & Growth – Sales | $6,150 | $6,519 | $6,910 |
| Entertainment | $5,400 | $5,724 | $6,067 |
| Total Sales and Marketing Expenses | $357,066 | $378,490 | $401,200 |
| Sales and Marketing % | 11.19% | 10.32% | 9.51% |
| General and Administrative Expenses | |||
| General and Administrative Payroll | $134,400 | $142,464 | $151,012 |
| Sales and Marketing and Other Expenses | $0 | $0 | $0 |
| Depreciation | $0 | $0 | $0 |
| Depreciation | $0 | $0 | $0 |
| Utilities | $9,000 | $9,540 | $10,112 |
| Telephone & ISP | $34,200 | $36,252 | $38,427 |
| Office Supplies | $4,200 | $4,452 | $4,719 |
| Insurance | $16,800 | $17,808 | $18,876 |
| Bank Charges | $6,000 | $6,360 | $6,742 |
| Postage | $10,020 | $10,621 | $11,258 |
| Taxes & Licenses | $10,200 | $10,812 | $11,461 |
| Bonuses | $0 | $0 | $0 |
| Learning & Growth – Admin | $3,150 | $3,339 | $3,539 |
| Accounting | $6,000 | $6,360 | $6,742 |
| Rent | $72,000 | $72,000 | $72,000 |
| Payroll Taxes | $181,350 | $192,231 | $203,765 |
| Other General and Administrative Expenses | $0 | $0 | $0 |
| Total General and Administrative Expenses | $487,320 | $512,239 | $538,654 |
| General and Administrative % | 15.27% | 13.96% | 12.77% |
| Other Expenses: | |||
| Other Payroll | $317,100 | $336,126 | $356,294 |
| Consultants | $0 | $0 | $0 |
| Learning & Growth – Service | $9,200 | $9,752 | $10,337 |
| Travel – Service | $22,500 | $23,850 | $25,281 |
| Freight & Cartage | $30,000 | $31,800 | $33,708 |
| Total Other Expenses | $378,800 | $401,528 | $425,620 |
| Other % | 11.87% | 10.94% | 10.09% |
| Total Operating Expenses | $1,223,186 | $1,292,258 | $1,365,473 |
| Profit Before Interest and Taxes | $332,645 | $513,294 | $729,544 |
| EBITDA | $332,645 | $513,294 | $729,544 |
| Interest Expense | $140,000 | $127,050 | $99,750 |
| Taxes Incurred | $72,797 | $146,773 | $235,123 |
| Net Profit | $119,848 | $239,471 | $394,671 |
| Net Profit/Sales | 3.76% | 6.53% | 9.35% |
Projected Cash Flow
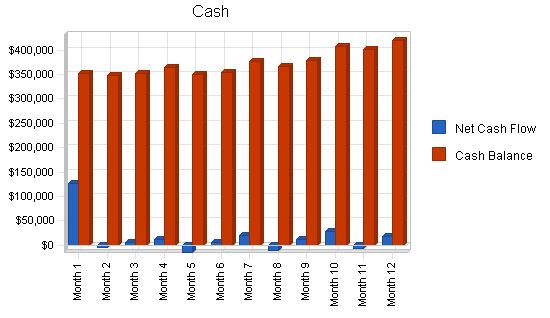
Since we are treating the new company as a start-up, the cash flow for FY2002 is somewhat exaggerated due to the influx of new capital. However, subsequent years show healthy growth in cash flow, mainly due to the short 60-month repayment of the start-up loan and increased sales.
Pro Forma Cash Flow:
Year 1 Year 2 Year 3
Cash Received
Cash from Operations
Cash Sales $2,073,714 $2,384,771 $2,742,486
Cash from Receivables $906,354 $1,252,568 $1,440,453
Subtotal Cash from Operations $2,980,067 $3,637,339 $4,182,939
Additional Cash Received
Sales Tax, VAT, HST/GST Received $0 $0 $0
New Current Borrowing $0 $0 $0
New Other Liabilities (interest-free) $0 $0 $0
New Long-term Liabilities $0 $0 $0
Sales of Other Current Assets $0 $0 $0
Sales of Long-term Assets $0 $0 $0
New Investment Received $30,000 $0 $0
Subtotal Cash Received $3,010,067 $3,637,339 $4,182,939
Expenditures:
Year 1 Year 2 Year 3
Expenditures from Operations
Cash Spending $604,500 $640,770 $679,216
Bill Payments $2,210,315 $2,809,360 $3,143,202
Subtotal Spent on Operations $2,814,815 $3,450,130 $3,822,418
Additional Cash Spent
Sales Tax, VAT, HST/GST Paid Out $0 $0 $0
Principal Repayment of Current Borrowing $0 $185,000 $205,000
Other Liabilities Principal Repayment $0 $0 $0
Long-term Liabilities Principal Repayment $0 $0 $0
Purchase Other Current Assets $0 $0 $0
Purchase Long-term Assets $0 $0 $0
Dividends $0 $0 $0
Subtotal Cash Spent $2,814,815 $3,635,130 $4,027,418
Net Cash Flow $195,252 $2,209 $155,521
Cash Balance $420,252 $422,461 $577,982
7.6 Projected Balance Sheet:
The Projected Balance Sheet is solid. We do not anticipate any difficulty meeting debt obligations as long as we achieve our objectives.
Pro Forma Balance Sheet:
Year 1 Year 2 Year 3
Assets
Current Assets
Cash $420,252 $422,461 $577,982
Accounts Receivable $210,261 $241,801 $278,071
Inventory $172,142 $196,241 $223,715
Other Current Assets $0 $0 $0
Total Current Assets $802,655 $860,503 $1,079,768
Long-term Assets
Long-term Assets $0 $0 $0
Accumulated Depreciation $0 $0 $0
Total Long-term Assets $0 $0 $0
Total Assets $802,655 $860,503 $1,079,768
Liabilities and Capital:
Year 1 Year 2 Year 3
Current Liabilities
Accounts Payable $227,807 $231,184 $260,778
Current Borrowing $1,000,000 $815,000 $610,000
Other Current Liabilities $0 $0 $0
Subtotal Current Liabilities $1,227,807 $1,046,184 $870,778
Long-term Liabilities $0 $0 $0
Total Liabilities $1,227,807 $1,046,184 $870,778
Paid-in Capital $30,000 $30,000 $30,000
Retained Earnings ($575,000) ($455,152) ($215,681)
Earnings $119,848 $239,471 $394,671
Total Capital ($425,152) ($185,681) $208,990
Total Liabilities and Capital $802,655 $860,503 $1,079,768
Net Worth ($425,152) ($185,681) $208,990
7.7 Business Ratios:
The following table presents our main business ratios compared to national averages. Our SIC industry class is currently: Office equipment, nec – 5044.99.
Ratio Analysis:
Year 1 Year 2 Year 3 Industry Profile
Sales Growth 0.00% 15.00% 15.00% 1.50%
Percent of Total Assets
Accounts Receivable 26.20% 28.10% 25.75% 30.97%
Inventory 21.45% 22.81% 20.72% 38.08%
Other Current Assets 0.00% 0.00% 0.00% 16.04%
Total Current Assets 100.00% 100.00% 100.00% 85.09%
Long-term Assets
Long-term Assets 0.00% 0.00% 0.00% 14.91%
Total Long-term Assets 0.00% 0.00% 0.00% 14.91%
Total Assets 100.00% 100.00% 100.00% 100.00%
Current Liabilities
Accounts Payable 152.97% 121.58% 80.64% 44.30%
Long-term Liabilities 0.00% 0.00% 0.00% 8.46%
Total Liabilities 152.97% 121.58% 80.64% 52.76%
Net Worth -52.97% -21.58% 19.36% 47.24%
Percent of Sales
Sales 100.00% 100.00% 100.00% 100.00%
Gross Margin 48.77% 49.21% 49.65% 26.76%
Selling, General & Administrative Expenses 45.02% 42.69% 40.40% 15.95%
Advertising Expenses 0.33% 0.30% 0.28% 0.95%
Profit Before Interest and Taxes 10.43% 13.99% 17.29% 2.55%
Main Ratios
Current 0.65 0.82 1.24 1.80
Quick 0.51 0.63 0.98 0.87
Total Debt to Total Assets 152.97% 121.58% 80.64% 6.22%
Pre-tax Return on Net Worth -45.31% -208.01% 301.35% 55.95%
Pre-tax Return on Assets 24.00% 44.89% 58.33% 14.11%
Additional Ratios:
Year 1 Year 2 Year 3
Net Profit Margin 3.76% 6.53% 9.35% n.a
Return on Equity 0.00% 0.00% 188.85% n.a
Activity Ratios:
Accounts Receivable Turnover 5.31 5.31 5.31 n.a
Collection Days 57 64 64 n.a
Inventory Turnover 10.91 10.12 10.12 n.a
Accounts Payable Turnover 10.70 12.17 12.17 n.a
Payment Days 27 30 28 n.a
Total Asset Turnover 3.97 4.26 3.91 n.a
Debt Ratios:
Debt to Net Worth 0.00 0.00 4.17 n.a
Current Liab. to Liab. 1.00 1.00 1.00 n.a
Liquidity Ratios:
Net Working Capital ($425,152) ($185,681) $208,990 n.a
Interest Coverage 2.38 4.04 7.31 n.a
Additional Ratios:
Assets to Sales 0.25 0.23 0.26 n.a
Current Debt/Total Assets 153% 122% 81% n.a
Acid Test 0.34 0.40 0.66 n.a
Sales/Net Worth 0.00 0.00 20.19 n.a
Dividend Payout 0.00 0.00 0.00 n.a
Appendix
Sales Forecast
| Sales Forecast | |||||||||||||
| Month 1 | Month 2 | Month 3 | Month 4 | Month 5 | Month 6 | Month 7 | Month 8 | Month 9 | Month 10 | Month 11 | Month 12 | ||
| Hardware – Image Platforms | $78,500 | $78,500 | $78,500 | $86,350 | $86,350 | $86,350 | $94,985 | $94,985 | $94,985 | $104,484 | $104,484 | $104,484 | |
| Hardware – Printers | $5,000 | $5,000 | $5,000 | $5,500 | $5,500 | $5,500 | $6,050 | $6,050 | $6,050 | $6,655 | $6,655 | $6,655 | |
| Hardware – Facsimiles | $10,250 | $10,250 | $10,250 | $11,275 | $11,275 | $11,275 | $12,403 | $12,403 | $12,403 | $13,643 | $13,643 | $13,643 | |
| Hardware – Misc (TW, Shrd) | $3,250 | $3,250 | $3,250 | $3,575 | $3,575 | $3,575 | $3,933 | $3,933 | $3,933 | $4,326 | $4,326 | $4,326 | |
| Professional Services | $0 | $0 | $2,500 | $2,750 | $2,750 | $2,750 | $3,025 | $3,025 | $3,025 | $3,328 | $3,328 | $3,328 | |
| Government (Comp) | $6,250 | $6,250 | $6,250 | $6,875 | $6,875 | $6,875 | $7,563 | $7,563 | $7,563 | $8,319 | $8,319 | $8,319 | |
| Supplies (Toner/Paper) | $36,000 | $36,000 | $36,000 | $39,600 | $39,600 | $39,600 | $43,560 | $43,560 | $43,560 | $47,916 | $47,916 | $47,916 | |
| Service – Agreements/Repairs | $68,000 | $68,000 | $68,000 | $74,800 | $74,800 | $74,800 | $82,280 | $82,280 | $82,280 | $90,508 | $90,508 | $90,508 | |
| Equipment Rentals | $17,500 | $17,500 | $17,500 | $19,250 | $19,250 | $19,250 | $21,175 | $21,175 | $21,175 | $23,293 | $23,293 | $23,293 | |
| Other | $2,250 | $2,250 | $2,250 | $2,475 | $2,475 | $2,475 | $2,723 | $2,723 | $2,723 | $2,995 | $2,995 | $2,995 | |
| Total Sales | $227,000 | $227,000 | $229,500 | $252,450 | $252,450 | $252,450 | $277,695 | $277,695 | $277,695 | $305,465 | $305,465 | $305,465 | |
Personnel Plan
| Personnel Plan | |||||||||||||
| Month 1 | Month 2 | Month 3 | Month 4 | Month 5 | Month 6 | Month 7 | Month 8 | Month 9 | Month 10 | Month 11 | Month 12 | ||
| Production Personnel | $0 | $0 | $0 | $0 | $0 | $0 | $0 | $0 | $0 | $0 | $0 | $0 | |
| Sales and Marketing Personnel | $12,000 | $12,000 | $12,000 | $13,000 | $13,000 | $13,000 | $13,000 | $13,000 | $13,000 | $13,000 | $13,000 | $13,000 | |
| General and Administrative Personnel | $10,600 | $10,600 | $10,600 | $11,400 | $11,400 | $11,400 | $11,400 | $11,400 | $11,400 | $11,400 | $11,400 | $11,400 | |
| Other Personnel | $25,150 | $25,150 | $25,150 | $26,850 | $26,850 | $26,850 | $26,850 | $26,850 | $26,850 | $26,850 | $26,850 | $26,850 | |
| Total People | 15 | 15 | 15 | 15 | 15 | 15 | 15 | 15 | 15 | 15 | 15 | 15 | |
| Total Payroll | $47,750 | $47,750 | $47,750 | $51,250 | $51,250 | $51,250 | $51,250 | $51,250 | $51,250 | $51,250 | $51,250 | $51,250 | |
General Assumptions
| General Assumptions | |||||||||||||
| Month 1 | Month 2 | Month 3 | Month 4 | Month 5 | Month 6 | Month 7 | Month 8 | Month 9 | Month 10 | Month 11 | Month 12 | ||
| Plan Month | 1 | 2 | 3 | 4 | 5 | 6 | 7 | 8 | 9 | 10 | 11 | 12 | |
| Current Interest Rate | 14.00% | 14.00% | 14.00% | 14.00% | 14.00% | 14.00% | 14.00% | 14.00% | 14.00% | 14.00% | 14.00% | 14.00% | |
| Long-term Interest Rate | 10.00% | 10.00% | 10.00% | 10.00% | 10.00% | 10.00% | 10.00% | 10.00% | 10.00% | 10.00% | 10.00% | 10.00% | |
| Tax Rate | 30.00% | 38.00% | 38.00% | 38.00% | 38.00% | 38.00% | 38.00% | 38.00% | 38.00% | 38.00% | 38.00% | 38.00% | |
| Other | 0 | 0 | 0 | 0 | 0 | 0 | 0 | 0 | 0 | 0 | 0 | 0 | |
Pro Forma Profit and Loss
| Month 1 | Month 2 | Month 3 | Month 4 | Month 5 | Month 6 | Month 7 | Month 8 | Month 9 | Month 10 | Month 11 | Month 12 |
| Sales | $227,000 | $229,500 | $252,450 | $277,695 | $305,465 | ||||||
| Direct Cost of Sales | $116,325 | $117,575 | $129,333 | $142,266 | $156,492 | ||||||
| Production Payroll | $0 | ||||||||||
| Other | $0 | ||||||||||
| Total Cost of Sales | $116,325 | $117,575 | $129,333 | $142,266 | $156,492 | ||||||
| Gross Margin | $110,675 | $111,925 | $123,118 | $135,429 | $148,972 | ||||||
| Gross Margin % | 48.76% | 48.77% | 48.77% | 48.77% | 48.77% | ||||||
| Operating Expenses | |||||||||||
| Sales and Marketing Expenses | |||||||||||
| Sales and Marketing Payroll | $12,000 | $13,000 | |||||||||
| Advertising/Promotion | $500 | $1,000 | |||||||||
| Commissions | $11,350 | $11,475 | $12,623 | $13,885 | $15,273 | ||||||
| Travel – Sales | $1,500 | $2,000 | |||||||||
| Learning & Growth – Sales | $0 | $400 | $1,250 | ||||||||
| Entertainment | $450 | ||||||||||
| Total Sales and Marketing Expenses | $25,800 | $25,925 | $29,473 | $30,735 | $32,973 | ||||||
| Sales and Marketing % | 11.37% | 11.30% | 11.67% | 11.07% | 10.79% | ||||||
| General and Administrative Expenses | |||||||||||
| General and Administrative Payroll | $10,600 | $11,400 | |||||||||
| Sales and Marketing and Other Expenses | $0 | ||||||||||
| Depreciation | $0 | ||||||||||
| Utilities | $750 | ||||||||||
| Telephone & ISP | $2,850 | ||||||||||
| Office Supplies | $350 | ||||||||||
| Insurance | $1,400 | ||||||||||
| Bank Charges | $500 | ||||||||||
| Postage | $835 | ||||||||||
| Taxes & Licenses | $850 | ||||||||||
| Bonuses | $0 | ||||||||||
| Learning & Growth – Admin | $0 | $150 | $750 | ||||||||
| Accounting | $500 | ||||||||||
| Rent | $6,000 | ||||||||||
| Payroll Taxes | $14,325 | $15,375 | |||||||||
| Other General and Administrative Expenses | $0 | ||||||||||
| Total General and Administrative Expenses | $38,960 | $40,960 | |||||||||
| General and Administrative % | 17.16% | 16.98% | |||||||||
| Other Expenses: | |||||||||||
| Other Payroll | $25,150 | $26,850 | |||||||||
| Consultants | $0 | ||||||||||
| Learning & Growth – Service | $0 | $850 | $1,500 | ||||||||
| Travel – Service | $1,500 | $2,000 | |||||||||
| Freight & Cartage | $2,500 | ||||||||||
| Total Other Expenses | $29,150 | $32,200 | |||||||||
| Other % | 12.84% | 12.70% | |||||||||
| Total Operating Expenses | $93,910 | $94,035 | |||||||||
| Profit Before Interest and Taxes | $16,765 | $17,890 | $20,485 | $31,735 | $41,589 | ||||||
| EBITDA | $16,765 | $17,890 | $20,485 | $31,735 | $41,589 | ||||||
| Interest Expense | $11,667 | ||||||||||
| Taxes Incurred | $1,530 | $3,351 | $11,370 | ||||||||
| Net Profit | $3,569 | $3,858 | $5,467 | $12,442 | $18,552 | ||||||
| Net Profit/Sales | 1.57% | 1.68% | 2.17% | 4.48% | 6.07% |
Pro Forma Cash Flow
| Month 1 | Month 2 | Month 3 | Month 4 | Month 5 | Month 6 | Month 7 | Month 8 | Month 9 | Month 10 | Month 11 | Month 12 | ||
| Cash Received | |||||||||||||
| Cash from Operations | |||||||||||||
| Cash Sales | $147,550 | $147,550 | $149,175 | $164,093 | $164,093 | $164,093 | $180,502 | $180,502 | $180,502 | $198,552 | $198,552 | $198,552 | |
| Cash from Receivables | $0 | $2,648 | $79,450 | $79,479 | $80,593 | $88,358 | $88,358 | $88,652 | $97,193 | $97,193 | $97,517 | $106,913 | |
| Subtotal Cash from Operations | $147,550 | $150,198 | $228,625 | $243,572 | $244,685 | $252,450 | $268,859 | $269,154 | $277,695 | $295,745 | $296,069 | $305,465 | |
| Additional Cash Received | |||||||||||||
| Sales Tax, VAT, HST/GST Received | 0.00% | $0 | $0 | $0 | $0 | $0 | $0 | $0 | $0 | $0 | $0 | $0 | $0 |
| New Current Borrowing | $0 | $0 | $0 | $0 | $0 | $0 | $0 | $0 | $0 | $0 | $0 | $0 | |
| New Other Liabilities (interest-free) | $0 | $0 | $0 | $0 | $0 | $0 | $0 | $0 | $0 | $0 | $0 | $0 | |
| New Long-term Liabilities | $0 | $0 | $0 | $0 | $0 | $0 | $0 | $0 | $0 | $0 | $0 | $0 | |
| Sales of Other Current Assets | $0 | $0 | $0 | $0 | $0 | $0 | $0 | $0 | $0 | $0 | $0 | $0 | |
| Sales of Long-term Assets | $0 | $0 | $0 | $0 | $0 | $0 | $0 | $0 | $0 | $0 | $0 | $0 | |
| New Investment Received | $30,000 | $0 | $0 | $0 | $0 | $0 | $0 | $0 | $0 | $0 | $0 | $0 | |
| Subtotal Cash Received | $177,550 | $150,198 | $228,625 | $243,572 | $244,685 | $252,450 | $268,859 | $269,154 | $277,695 | $295,745 | $296,069 | $305,465 | |
| Expenditures | |||||||||||||
| Expenditures from Operations | |||||||||||||
| Cash Spending | $47,750 | $47,750 | $47,750 | $51,250 | $51,250 | $51,250 | $51,250 | $51,250 | $51,250 | $51,250 | $51,250 | $51,250 | |
| Bill Payments | $3,455 | $106,054 | $176,195 | $180,247 | $208,235 | $195,733 | $196,816 | $227,755 | $214,007 | $215,366 | $250,790 | $235,663 | |
| Subtotal Spent on Operations | $51,205 | $153,804 | $223,945 | $231,497 | $259,485 | $246,983 | $248,066 | $279,005 | $265,257 | $266,616 | $302,040 | $286,913 | |
| Additional Cash Spent | |||||||||||||
| Sales Tax, VAT, HST/GST Paid Out | $0 | $0 | $0 | $0 | $0 | $0 | $0 | $0 | $0 | $0 | $0 | $0 | |
| Principal Repayment of Current Borrowing | $0 | $0 | $0 | $0 | $0 | $0 | $0 | $0 | $0 | $0 | $0 | $0 | |
| Other Liabilities Principal Repayment | $0 | $0 | $0 | $0 | $0 | $0 | $0 | $0 | $0 | $0 | $0 | $0 | |
| Long-term Liabilities Principal Repayment | $0 | $0 | $0 | $0 | $0 | $0 | $0 | $0 | $0 | $0 | $0 | $0 | |
| Purchase Other Current Assets | $0 | $0 | $0 | $0 | $0 | $0 | $0 | $0 | $0 | $0 | $0 | $0 | |
| Purchase Long-term Assets | $0 | $0 | $0 | $0 | $0 | $0 | $0 | $0 | $0 | $0 | $0 | $0 | |
| Dividends | $0 | $0 | $0 | $0 | $0 | $0 | $0 | $0 | $0 | $0 | $0 | $0 | |
| Subtotal Cash Spent | $51,205 | $153,804 | $223,945 | $231,497 | $259,485 | $246,983 | $248,066 | $279,005 | $265,257 | $266,616 | $302,040 | $286,913 | |
| Net Cash Flow | $126,345 | ($3,605) | $4,680 | $12,075 | ($14,800) | $5,467 | $20,793 | ($9,852) | $12,438 | $29,129 | ($5,971) | $18,552 | |
| Cash Balance | $351,345 | $347,740 | $352,420 | $364,495 | $349,696 | $355,163 | $375,956 | $366,105 | $378,543 | $407,672 | $401,700 | $420,252 |
Hello!
I’m Andrew Brooks, a seasoned finance consultant from the USA and the mind behind phonenumber247.com.
My career is built on a foundation of helping individuals and businesses thrive financially in an ever-changing economic landscape. At phonenumber247.com, my aim is to demystify the complex world of finance, providing clear, actionable advice that can help you navigate your financial journey with confidence. Whether it’s personal finance management, investment strategies, or understanding the nuances of market dynamics, I’m here to share insights and tools that can propel you towards your financial goals.
Welcome to my digital space, where every piece of advice is a step closer to financial clarity and success!
