The telecommunications revolution has arrived: Personal communications and unified messaging systems are at the forefront of this technological phenomenon. Dating from the 1984 deregulation of local and long distance telephone service, competition has accelerated and searched for every opportunity in the telecom products and services market for both consumers and businesses. Since then, mobile and cellular phones have become widely used, allowing communication anytime, anywhere in the world. Companies that have not anticipated or kept up with these changes are quickly left behind, as seen with Iridium. Financial muscle has been replaced by quality management, speed of execution, and depth of management as the final determinants in the marketplace. AT&T has realized this and brought in a technologically savvy CEO to drive necessary changes, while Iridium did not and paid the price.
TeleSpace is in a strong position to become the market leader in personal communications and unified messaging. With the rise of multiple phone and fax numbers, pagers, and email for businesses and consumers, they now demand simplicity and speed: One identifier for their complex lives that will reach them anywhere and deliver their communications. This is where MyLine comes in.
MyLine has been an operating system for over five years and has a small, loyal customer base. The technology is clean, elegant, and maintainable. However, MyLine has seen limited success due to poor engineering and marketing decisions. It was marketed like the pocket knife in early TV ads: heavy and burdened with unnecessary features. Consumers realized the product was flawed before even using it.
Internal market research has identified the consumer’s wants and needs, and MyLine fulfills them. There are five primary target markets, three of which will be discussed below. First, the businessmen and consumers who simply want to receive phone calls no matter where they are. MyLine ensures they can always be reached, whether in the office, car, plane, or on the golf course. Second, the Soccer/Sports Moms who are always on the move. Our toll-free number, 800 MyLine, allows them to stay reachable. Lastly, the military market, which requires mobile, reliable, and confidential communications. MyLine is well-prepared to cater to their needs.
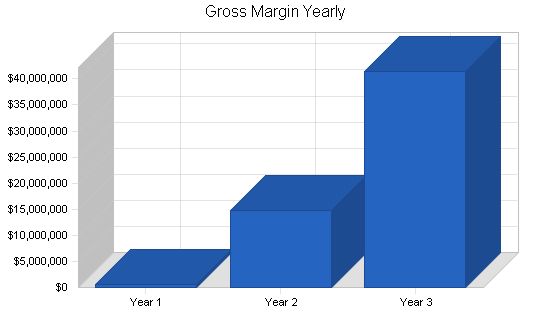
The overall telecommunications market exceeds $200 billion. The personal communications and unified messaging sub-industry, with its vast user base, is challenging to estimate at this stage. Management predicts sales of about $40 million in the third year, with monthly sales reaching $5 million by the end of that year. However, even with these projected sales, MyLine would only capture a one percent market share. To become the market leader, a five to ten percent market share within five years is the goal for Management.
1.1 Objectives
TeleSpace aims to become the market leader in personal communications and unified messaging products and services within five years. They also strive to be the lowest cost provider and have the best customer service by year-end Year 1.
1.2 Mission
MyLine is already the most technologically-superior personal communications system globally. TeleSpace plans to leverage MyLine’s brand and technical reputation to become the market leader in personal and business communications, as well as unified messaging systems within five years.
1.3 Keys to Success
TeleSpace’s success relies on three factors:
1. Marketing must generate sufficient sales volume to drive an aggressive pricing model while achieving planned profitability projections.
2. Strategic partners must be found to private label MyLine and promote it through their distribution channels.
3. Equity capital must be secured at a reasonable valuation.
TeleSpace, Inc. develops and markets programmable personal communications and unified messaging services for individuals and businesses. The company operates as a wholly-owned subsidiary of AmericomUSA, Inc., a public reporting company. TeleSpace management has proposed a leveraged buyout of the company from Americom, including the purchase of 81% of TeleSpace common stock and an option to acquire an additional 10% within two years. The management expects to finalize the negotiation by the end of October, Year 1, and pursue equity capital for the acquisition and ongoing operations.
2.1 Company Ownership
TeleSpace, Inc. is a wholly-owned subsidiary of AmericomUSA, Inc., where Mr. Robert Cezar, Chief Executive Officer of AmericomUSA, Inc., owns approximately 58% of the common stock.
2.2 Start-up Summary
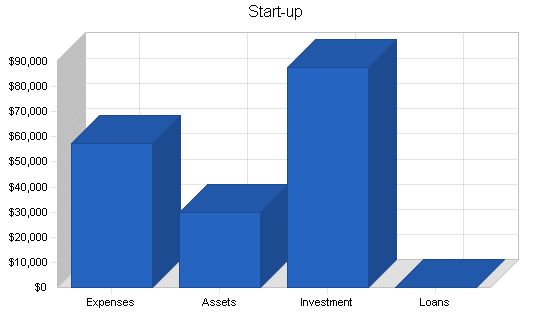
Start-up costs, excluding salaries, primarily consist of legal fees, marketing collateral, advertising, and consulting fees. These costs are financed by the parent company, AmericomUSA.
Start-up Funding
Start-up Expenses: $57,500
Start-up Assets: $30,000
Total Funding Required: $87,500
Assets
Non-cash Assets from Start-up: $30,000
Cash Requirements from Start-up: $0
Additional Cash Raised: $0
Cash Balance on Starting Date: $0
Total Assets: $30,000
Liabilities and Capital
Liabilities
Current Borrowing: $0
Long-term Liabilities: $0
Accounts Payable (Outstanding Bills): $0
Other Current Liabilities (interest-free): $0
Total Liabilities: $0
Capital
Planned Investment
Americom USA: $87,500
Other: $0
Additional Investment Requirement: $0
Total Planned Investment: $87,500
Loss at Start-up (Start-up Expenses): ($57,500)
Total Capital: $30,000
Total Capital and Liabilities: $30,000
Total Funding: $87,500
Start-up
Requirements
Start-up Expenses
Legal: $5,000
Stationery etc.: $2,500
Brochures: $5,000
Consultants: $10,000
Advertising: $20,000
Expensed equipment: $5,000
Other: $10,000
Total Start-up Expenses: $57,500
Start-up Assets
Cash Required: $0
Start-up Inventory: $20,000
Other Current Assets: $10,000
Long-term Assets: $0
Total Assets: $30,000
Total Requirements: $87,500
2.3 Company Locations and Facilities
TeleSpace corporate offices are located in Arroyo Grande, CA. Existing space of 900 square feet is adequate for existing staff, but new facilities have to be leased when sales representatives are hired.
Products and Services
TeleSpace, Inc. develops and markets programmable personal communications and unified messaging services for individuals and businesses. The MyLine system can best be described as a personal communications platform, a remotely programmable "telocation" service which allows the user to access MyLine services from any telephone device or personal computer anywhere in the world.
3.1 Product and Service Description
The MyLine system can best be described as a personal communications platform, a remotely programmable "telocation" service which allows the user to access MyLine services from any telephone device or personal computer anywhere in the world. MyLine is a virtual telephone number which allows the user to control inbound telephone, fax, and data calls and receive them anywhere, but only on demand. MyLine is the only telephone number users will ever need. They receive every telephone call, fax, or email sent to their MyLine number in real time or stored for later use. Or they can screen and elect not to receive any particular communication, delete or divert for later handling. MyLine includes a proprietary security system to prevent unauthorized access and has real-time billing and accounting capabilities. The latter can generate comprehensive billing records by project and/or general ledger account.
3.2 Sales Literature
Initial radio and Internet ads and sales collateral will be developed by the company’s marketing, advertising, and public relations agency in Silicon Valley. This is a well-known firm specializing in high-tech clients.
3.3 Competitive Comparison
In 1992, AT&T launched their Easy Reach service which signified the need for a universal telocation virtual number and thus found immediate acceptance. MCI reacted by introducing its Personal 800 Follow Me Service. These services today require users to subscribe to their networks, lack a broad range of integrated services, and offer limited remote control capability.
There is one striking difference between MyLine and competing technologies: The competition has not integrated all means of communication. Some offer voice mail and follow me technology, others offer this, and other features, on a piece meal basis, not totally integrated. MyLine is the only totally integrated voice, fax, data, and email system on the market.
3.4 Fulfillment
The company now maintains its servers locally for supporting MyLine. As volume grows, management plans to co-locate at Above.Net’s facilities in San Jose, CA. A strategic marketing partner will also be sought, especially for the toll-free, 800 number.
3.5 Technology
The MyLine hardware platform is a state-of-the-art digital industry standard, and its design provides unique redundancy and flexibility. The MyLine system places the user on an electronic highway of digital call processing, operating on a Novell Local Area Network (LAN), integrating computer and telephone information into computer telephony technology. The LAN is connected to the Public Switch Network with the capability of using the ISDN/DSL features provided by the long distance carriers.
MyLine users have a personal communications exchange as a zero-blocking private global network providing voice, fax, and data transfer between themselves and any other MyLine or non-MyLine user. MyLine overlays and utilizes the Public Switched Telephone Network (PSTN) or the Public Switched Data Network, providing access to anyone with a MyLine number. The network routes all incoming and outgoing requests and data to a central hub for distribution to external routers, the Internet if needed, or delivers the request directly to local destinations.
The MyLine switching center provides the telephonic connection to the PSTN, which the network utilizes as its gateway. The MyLine system utilizes a Novell Netware Global Messaging Service which operates on Novell Netware file servers, providing a standardized platform and format for global message distribution to other Novell Netware servers, compatible applications and Internet addresses. Thus, access to the MyLine system is virtually unlimited. All communications within the network are encrypted, either with public/private key algorithms or with the proprietary MyLine rotational encryption algorithms.
3.6 Future Products and Services
MyLine features include:
– Call forwarding.
– Selective call screening.
– Automatic callback.
– Wake-up services.
– Conference calling.
– Call waiting.
– Call conferencing (integrating call waiting and conferencing).
– Voice messaging.
– Paging.
– Real-time billing/accounting.
– Information on demand.
– Number referral.
– Fax store and forward.
– Email.
Market Analysis Summary
Dun and Bradstreet estimates that 1999 sales of the U.S. telecommunications market will be over $150 billion, of which the personal communications and unified messaging market is three percent, or $4 billion. If the company can achieve a one percent market share within three years, its sales would be $40 million in a market growing eight percent per year. These estimates are conservative, given the accelerating growth rate of telecommunications and unified messaging in particular. There is ample space for the company, and many competitors, in this huge and fast-growing marketplace.
4.1 Market Segmentation
TeleSpace has targeted five primary market segments:
1. General consumer and business market.
2. Sports Mom toll-free.
3. Domestic Traveler/Calling Card.
4. International Traveler.
5. Military.
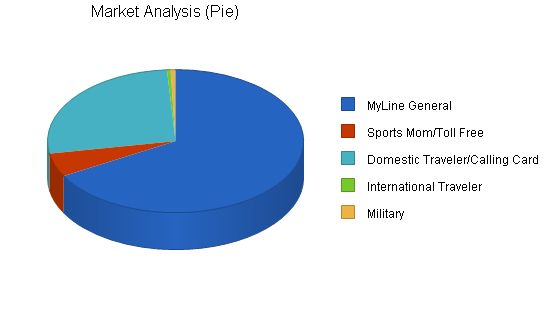
Market Analysis
Year 1 Year 2 Year 3 Year 4 Year 5
Potential Customers Growth CAGR
MyLine General 6% 150 159 169 179 190 6.09%
Sports Mom/Toll Free 9% 12 13 14 15 16 7.46%
Domestic Traveler/Calling Card 12% 60 67 75 84 94 11.88%
International Traveler 2% 1 1 1 1 1 0.00%
Military 0% 1 1 1 1 1 -8.07%
Total 7.71% 224 241 260 280 302 7.71%
4.2 Target Market Segment Strategy
The company will market its products to customer segments that require basic mobile telecommunication services in a single solution. Features will be tailored to each segment. The company will focus on determining the most attractive features for each segment and offering customized quality products at competitive prices.
4.2.1 Market Needs
All target segments seek reliable and easy-to-use communications. Feature preferences vary between segments. ‘Soccer moms’ in need of ‘always on’ accessibility desire a permanent 800 number. Business travelers desire a universal communications portal. TeleSpace will tailor its offerings to each segment.
4.3 Service Business Analysis
TeleSpace is part of the telecommunications industry, which includes national and international carriers, regional operating companies, competitive local exchange carriers, resellers, and unified messaging and personal communications service providers like TeleSpace.
4.3.1 Business Participants
The personal telecommunications and unified messaging system sub-industry is a new, technology-driven industry with high growth and many competitors. Industry sales should continue to accelerate as consumers learn the benefits of personal phone numbers. Industry leaders include AT&T, Excel Communications, Inc., Linx Communications, Inc., Nextel Communications, Inc., Sprint PCS, and Voice Mobility, Inc.
4.3.2 Competition and Buying Patterns
Price, accessibility, and ease of use are the primary buying factors. Brand loyalty is significant. MyLine has a technological lead and a superior management team. The primary competition includes Nextel, Linx Communications, and other well-branded companies. The marketplace is large enough to support all competitors.
4.3.3 Main Competitors
Competitors include Webley Systems, StarTouch International, Ltd., Nextel Communications, Inc., Linx Communications, Inc., and JFAX.COM. Each offers unique features and services.
Strategy and Implementation Summary
MyLine offers a wide range of features. Management will focus on key features that appeal to the target market and aggressively market them. Emphasis will be placed on speed in penetrating markets, implementing campaigns, and adjusting marketing as needed. Cost control and brand management are critical.
5.1 Competitive Edge
TeleSpace has a technological lead over major competitors with its seamless integration of voice, fax, and data communications. The management team has decades of experience in the telecommunications industry.
The strategy will focus on segmenting markets and tailoring the MyLine feature set to each market. The marketing message will be simple and focused on core features.
5.2.1 Promotion Strategy
A marketing firm will coordinate marketing, advertising, and promotion. Focus groups will determine the best feature set and pricing for MyLine.
5.2.2 Pricing Strategy
TeleSpace will have the lowest cost structure in the industry and premium pricing based on its rich feature set and quality service. Pricing will match significant competitors.
5.3 Sales Strategy
Sales strategies will vary depending on the target market. Sales forecasts predict high growth and competition in the industry.
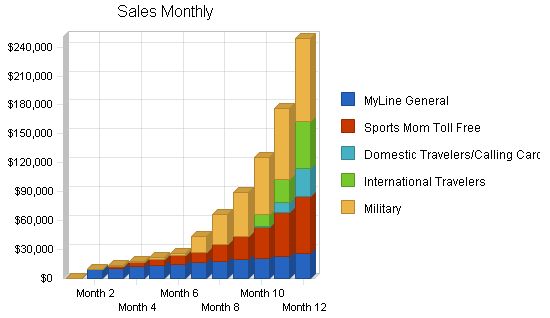
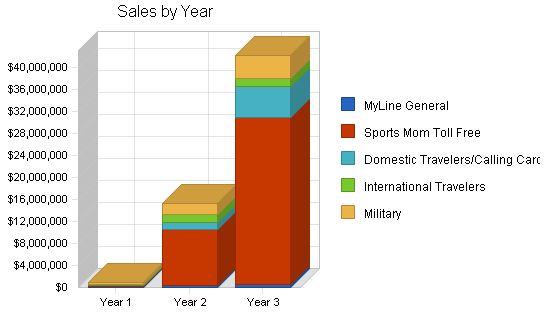
| Sales Forecast | |||
| Year 1 | Year 2 | Year 3 | |
| Sales | |||
| MyLine General | $183,000 | $420,000 | $635,000 |
| Sports Mom Toll Free | $210,000 | $10,100,000 | $30,300,000 |
| Domestic Travelers/Calling Cards | $42,550 | $1,300,000 | $5,600,000 |
| International Travelers | $84,000 | $1,400,000 | $1,500,000 |
| Military | $317,800 | $2,100,000 | $4,200,000 |
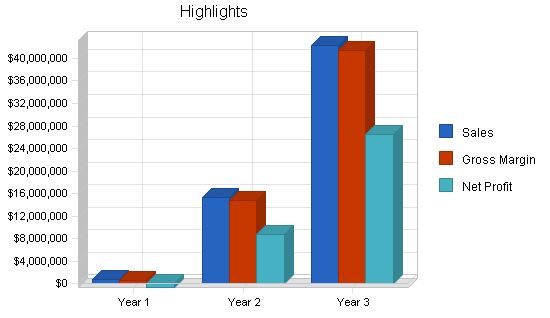
| Total Sales | $837,350 | $15,320,000 | $42,235,000 |
| Direct Cost of Sales | Year 1 | Year 2 | Year 3 |
| MyLine General | $0 | $0 | $0 |
| Sports Mom Toll Free | $0 | $0 | $0 |
| Domestic Travelers/Calling Cards | $0 | $0 | $0 |
| International Travelers | $0 | $0 | $0 |
| Military | $0 | $0 | $0 |
| Subtotal Direct Cost of Sales | $0 | $0 | $0 |
Contents
5.3.2 Sales Programs
TeleSpace will utilize five primary sales programs:
- Direct Sales: This will be done by the CEO, Director of Marketing and Sales Channel Managers, all of whom have extensive contacts in the industry and have already been invited by several key prospects to present MyLine and other company services.
- Radio advertising: This will be the main entree to the consumer market, which the company will approach on a target market basis. Personal endorsements by celebrities will be emphasized.
- Print advertising: This will be used primarily for MyLine and placed in magazines and newspapers targeted to amateur sports and military officers and enlisted personnel, probably with endorsements by our contracted endorsers.
- Trade shows: Will be used to promote MyLine, mostly to businesses, CLECs, and small carriers.
- Web advertising: The company is now developing ads to be run on customer websites of its sister company, AdCast, Inc., which markets advertising delivery systems for the Internet.
5.4 Milestones
The following table lists important corporate milestones, with completion dates, budgets and responsible executive for each. This milestone schedule indicates our emphasis on planning for implementation.
| Milestones | |||||
| Milestone | Start Date | End Date | Budget | Manager | Department |
| Retain IBW Company | 11/1/1999 | 11/1/1999 | $10,000 | Matt | Sales |
| Set up focus group program | 12/1/1999 | 12/1/1999 | $10,000 | Matt | Marketing |
| Secure equity funding | 12/31/1999 | 12/31/1999 | $50,000 | Phil | Finance |
| Hire initial employees | 1/1/2000 | 1/1/2000 | $1,000 | Betty | Admin |
| Complete trade secrets/patent review | 1/1/2000 | 1/1/2000 | $5,000 | Trone | Corporate |
| Implement advertising program | 11/15/1999 | 11/15/1999 | $20,000 | Matt | Marketing |
| Retain Rob Dunaway | 9/1/1999 | 9/1/1999 | $5,000 | Phil | Corporate |
| Retain Alliance Ventures Group | 11/15/1999 | 11/15/1999 | $0 | Phil | Corporate |
| Secure/equip MyLine network | 9/15/1999 | 9/15/1999 | $1,000 | Russ | Operations |
| Finalize buyout agreement | 10/31/1999 | 10/31/1999 | $0 | Trone | Corporate |
| Close strategic investor | 12/15/1999 | 12/15/1999 | $0 | Phil | Corporate |
| Complete MyLine 2000 | 7/1/2000 | 7/1/2000 | $0 | Russ | Corporate |
| Other | 1/1/2000 | 1/1/2000 | $0 | ABC | Department |
| Totals | $102,000 | ||||
Management Summary
TeleSpace’s management philosophy is to outsource all non-critical corporate functions and focus on building a telecommunications marketing and sales internal team, accelerating MyLine sales penetration into target markets, and completing the MyLine 2000 upgrade.
The company currently has four executives and will hire a Sales Channel Manager in January, 2000.
6.1 Organizational Structure
TeleSpace is organized into three primary functional disciplines: Marketing and sales, operations and product development, and finance and administration. Each is managed by a senior executive who reports to the Chief Executive Officer.
TeleSpace, Inc. is a wholly-owned subsidiary of AmericomUSA, Inc., a public reporting company. Upon completion of the management buyout, the current board of directors will be replaced by Trone Miller, Chairman and CEO, Phil ErkenBrack, CFO, and an investor representative.
6.2 Management Team
Mr. Trone Miller is the founding Chairman and CEO of TeleSpace.
Mr. Phillip ErkenBrack, Jr. is the CFO, Director, and co-founder.
Mr. Russell Rish is the Vice President of Operations.
Mr. Matthew van Steenwyk is the Vice President of Marketing and Business Development.
6.3 Management Team Gaps
The company will hire a Sales Channel Manager in the near term, completing the management team for the first year.
6.4 Personnel Plan
The company currently has four executives and will hire a Sales Channel Manager shortly. Two sales representatives will be hired after the advertising program starts, completing the hiring for the first year.
| Personnel Plan | |||
| Year 1 | Year 2 | Year 3 | |
| Production Personnel | |||
| VP of Operations – Russ Fish | $78,400 | $100,000 | $130,000 |
| Sr. Systems Engineer – Dana Gilliam | $54,400 | $65,000 | $75,000 |
| Systems Engineer – David Gabler | $45,600 | $55,000 | $60,000 |
| Subtotal | $178,400 | $220,000 | $265,000 |
| Sales and Marketing Personnel | |||
| VP of Mkg. & Bus. Dev’t – M. van Steenwyk | $78,000 | $100,000 | $130,000 |
| Sales Channel Managers | $40,000 | $120,000 | $150,000 |
| Resource Analyst – Amber Higgins | $36,975 | $45,000 | $50,000 |
| Account Manager – Brenda Thomasi | $36,375 | $45,000 | $50,000 |
| Sales Representatives | $12,500 | $230,000 | $550,000 |
| Subtotal | $203,850 | $540,000 | $930,000 |
| General and Administrative Personnel | |||
| CEO – Trone Miller | $112,998 | $150,000 | $180,000 |
| CFO – Phil ErkenBrack | $103,002 | $130,000 | $150,000 |
| Controller | $0 | $60,000 | $70,000 |
| Billing Supervisor – Hector Padilla | $43,500 | $50,000 | $55,000 |
| Accountants | $26,000 | $150,000 | $300,000 |
| Personnel Plan | |||||||||||||
| Month 1 | Month 2 | Month 3 | Month 4 | Month 5 | Month 6 | Month 7 | Month 8 | Month 9 | Month 10 | Month 11 | Month 12 | ||
| Production Personnel | |||||||||||||
| VP of Operations – Russ Fish | $1,400 | $7,000 | $7,000 | $7,000 | $7,000 | $7,000 | $7,000 | $7,000 | $7,000 | $7,000 | $7,000 | $7,000 | |
| Sr. Systems Engineer – Dana Gilliam | $4,200 | $4,200 | $4,600 | $4,600 | $4,600 | $4,600 | $4,600 | $4,600 | $4,600 | $4,600 | $4,600 | $4,600 | |
| Systems Engineer – David Gabler | $3,800 | $3,800 | $3,800 | $3,800 | $3,800 | $3,800 | $3,800 | $3,800 | $3,800 | $3,800 | $3,800 | $3,800 | |
| Subtotal | $9,400 | $15,000 | $15,400 | $15,400 | $15,400 | $15,400 | $15,400 | $15,400 | $15,400 | $15,400 | $15,400 | $15,400 | |
| Sales and Marketing Personnel | |||||||||||||
| VP of Mkg. & Bus.Dev’t – M. van Steenwyk | $6,000 | $6,000 | $6,000 | $6,000 | $6,000 | $6,000 | $7,000 | $7,000 | $7,000 | $7,000 | $7,000 | $7,000 | |
| Sales Channel Managers | $0 | $0 | $0 | $0 | $0 | $0 | $2,500 | $5,000 | $7,500 | $7,500 | $7,500 | $10,000 | |
| Resource Analyst – Amber Higgins | $2,600 | $3,125 | $3,125 | $3,125 | $3,125 | $3,125 | $3,125 | $3,125 | $3,125 | $3,125 | $3,125 | $3,125 | |
| Account Manager – Brenda Thomasi | $2,000 | $3,125 | $3,125 | $3,125 | $3,125 | $3,125 | $3,125 | $3,125 | $3,125 | $3,125 | $3,125 | $3,125 | |
| Sales Representatives | $0 | $0 | $0 | $0 | $0 | $0 | $0 | $0 | $0 | $2,500 | $5,000 | $5,000 | |
| Subtotal | $10,600 | $12,250 | $12,250 | $12,250 | $12,250 | $12,250 | $15,750 | $18,250 | $20,750 | $23,250 | $25,750 | $28,250 | |
| General and Administrative Personnel | |||||||||||||
| CEO – Trone Miller | $8,000 | $8,000 | $8,000 | $8,000 | $8,000 | $8,000 | $10,833 | $10,833 | $10,833 | $10,833 | $10,833 | $10,833 | |
| CFO – Phil ErkenBrack | $8,000 | $8,000 | $8,000 | $8,000 | $8,000 | $8,000 | $9,167 | $9,167 | $9,167 | $9,167 | $9,167 | $9,167 | |
| Controller | $0 | $0 | $0 | $0 | $0 | $0 | $0 | $0 | $0 | $0 | $0 | $0 | |
| Billing Supervisor – Hector Padilla | $3,500 | $3,500 | $3,500 | $3,500 | $3,500 | $3,500 | $3,500 | $3,500 | $3,500 | $4,000 | $4,000 | $4,000 | |
| Accountants | $0 | $0 | $0 | $0 | $0 | $0 | $2,000 | $4,000 | $4,000 | $4,000 | $6,000 | $6,000 | |
| Administration Manager – Betty Benedix | $3,000 | $3,000 | $3,000 | $3,000 | $3,000 | $3,000 | $3,000 | $3,000 | $3,000 | $3,000 | $3,500 | $3,500 | |
| Asst. Manager | $0 | $0 | $0 | $0 | $0 | $0 | $0 | $1,000 | $2,000 | $2,000 | $2,000 | $2,000 | |
| Receptionist | $0 | $0 | $0 | $0 | $0 | $0 | $0 | $900 | $900 | $900 | $900 | $900 | |
| Human Resources Clerk | $0 | $0 | $0 | $0 | $0 | $0 | $0 | $0 | $0 | $0 | $0 | $0 | |
| Subtotal | $22,500 | $22,500 | $22,500 | $22,500 | $22,500 | $22,500 | $28,500 | $32,400 | $33,400 | $33,900 | $36,400 | $36,400 | |
| Other Personnel | Pro Forma Cash Flow | ||||||||||||
| Month 1 | Month 2 | Month 3 | Month 4 | Month 5 | Month 6 | Month 7 | Month 8 | Month 9 | Month 10 | Month 11 | Month 12 | ||
| Cash Received | |||||||||||||
| Cash from Operations | |||||||||||||
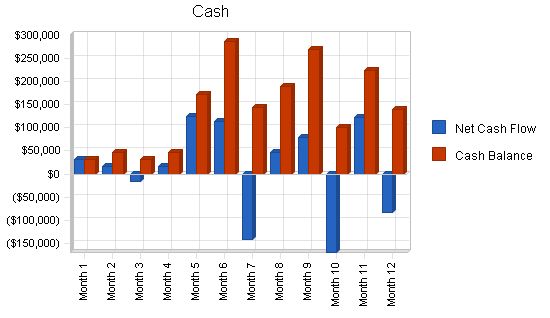
| Cash Sales | $0 | $450 | $665 | $880 | $1,095 | $1,310 | $2,190 | $3,315 | $4,440 | $6,258 | $8,795 | $12,470 | |
| Cash from Receivables | $0 | $0 | $285 | $8,686 | $12,771 | $16,856 | $20,941 | $25,447 | $42,323 | $63,698 | $85,511 | $120,500 | |
| Subtotal Cash from Operations | $0 | $450 | $950 | $9,566 | $13,866 | $18,166 | $23,131 | $28,762 | $46,763 | $69,955 | $94,306 | $132,970 | |
| Additional Cash Received | |||||||||||||
| Sales Tax, VAT, HST/GST Received | 0.00% | $0 | $0 | $0 | $0 | $0 | $0 | $0 | $0 | $0 | $0 | $0 | |
| New Current Borrowing | $75,000 | $100,000 | $75,000 | $100,000 | $0 | $0 | $0 | $0 | $0 | $0 | $0 | $0 | |
| New Other Liabilities (interest-free) | $0 | $0 | $0 | $0 | $0 | $0 | $0 | $0 | $0 | $0 | $0 | $0 | |
| New Long-term Liabilities | $0 | $0 | $0 | $0 | $0 | $0 | $0 | $0 | $0 | $0 | $0 | $0 | |
| Sales of Other Current Assets | $0 | $0 | $0 | $0 | $0 | $0 | $0 | $0 | $0 | $0 | $0 | $0 | |
| Sales of Long-term Assets | $0 | $0 | $0 | $0 | $0 | $0 | $0 | $0 | $0 | $0 | $0 | $0 | |
| New Investment Received | $0 | $0 | $0 | $0 | $250,000 | $250,000 | $0 | $250,000 | $250,000 | $0 | $250,000 | $0 | |
| Subtotal Cash Received | $75,000 | $100,450 | $75,950 | $109,566 | $263,866 | $268,166 | $23,131 | $278,762 | $296,763 | $69,955 | $344,306 | $132,970 | |
| Expenditures | Month 1 | Month 2 | Month 3 | Month 4 | Month 5 | Month 6 | Month 7 | Month 8 | Month 9 | Month 10 | Month 11 | Month 12 | |
| Expenditures from Operations | |||||||||||||
| Cash Spending | $42,500 | $49,750 | $50,150 | $50,150 | $50,150 | $50,150 | $59,650 | $66,050 | $69,550 | $72,550 | $77,550 | $80,050 | |
| Bill Payments | $830 | $24,981 | $27,337 | $27,933 | $29,130 | $43,989 | $45,953 | $105,789 | $87,964 | $107,140 | $83,287 | $76,226 | |
| Subtotal Spent on Operations | $43,330 | $74,731 | $77,487 | $78,083 | $79,280 | $94,139 | $105,603 | $171,839 | $157,514 | $179,690 | $160,837 | $156,277 | |
| Additional Cash Spent | |||||||||||||
| Sales Tax, VAT, HST/GST Paid Out | $0 | $0 | $0 | $0 | $0 | $0 | $0 | $0 | $0 | $0 | $0 | $0 | |
| Principal Repayment of Current Borrowing | $0 | $10,000 | $15,000 | $15,000 | $15,000 | $15,000 | $15,000 | $15,000 | $15,000 | $15,000 | $15,000 | $15,000 | |
| Other Liabilities Principal Repayment | $0 | $0 | $0 | $0 | $0 | $0 | $0 | $0 | $0 | $0 | $0 | $0 | |
| Long-term Liabilities Principal Repayment | $0 | $0 | $0 | $0 | $0 | $0 | $0 | $0 | $0 | $0 | $0 | $0 | |
| Purchase Other Current Assets | $0 | $0 | $0 | $0 | $0 | $0 | $0 | $0 | $0 | $0 | $0 | $0 | |
| Purchase Long-term Assets | $0 | $0 | $0 | $0 | $45,000 | $45,000 | $45,000 | $45,000 | $45,000 | $45,000 | $45,000 | $45,000 | |
| Dividends | $0 | $0 | $0 | $0 | $0 | $ “> | |||||||
Hello!
I’m Andrew Brooks, a seasoned finance consultant from the USA and the mind behind phonenumber247.com.
My career is built on a foundation of helping individuals and businesses thrive financially in an ever-changing economic landscape. At phonenumber247.com, my aim is to demystify the complex world of finance, providing clear, actionable advice that can help you navigate your financial journey with confidence. Whether it’s personal finance management, investment strategies, or understanding the nuances of market dynamics, I’m here to share insights and tools that can propel you towards your financial goals.
Welcome to my digital space, where every piece of advice is a step closer to financial clarity and success!

