Silicon Freight Brokers (SFB) is a specialized freight broker located in Hood River, OR. The company has been set up as an Oregon C Corporation by the owner, Steve Tookarefol. SFB’s objective is to become the premier silicon chip freight broker, increasing their client base by 20% a year.
The freight broker industry is the middle man of the shipping industry. They are also known as third party transportation providers. Freight brokers link customers with shippers and trucking companies. Their service is indispensable when moving goods as there are hundreds of shippers offering thousands of services. Freight brokers make securing a shipper quite easy with one-stop shopping.
The silicon chip industry fuelled the growth of the late 90’s Internet boom. Silicon chips are the basis of computers and handheld devices such as cell phones and PDAs.
SFB will specialize in shipping silicon chips, occupying a niche within the general freight brokerage market. Silicon chips require special attention, with specific temperature and humidity parameters that must be maintained. By focusing solely on silicon chips, SFB will gain market share and be known as the premier chip broker.
The chip industry consists of chip manufacturers and purchasers. Some manufacturers produce in the USA, while others outsource production overseas. The primary chip purchasers are Intel, IBM, and Motorola.
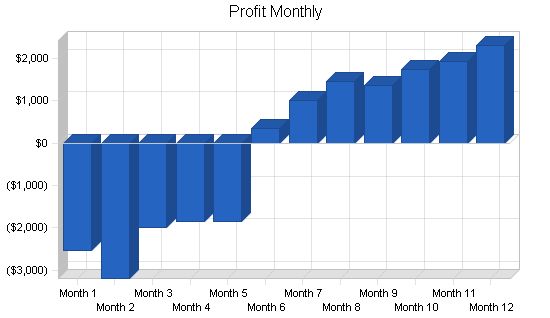
SFB is led by Steve and Wendy Tookarefol, who have over 10 years of freight experience. Steve’s industry knowledge and Wendy’s expertise in the silicon chip industry have shaped SFB’s solid business model. SFB is forecasted to reach profitability by month six, remaining focused on their niche and utilizing their strong management team.
Contents
1.1 Objectives
Silicon Freight Brokers’ objectives for the first three years of operation:
- To create a service-based company that continually exceeds customer expectations.
- To establish partnerships with at least four of the top 10 silicon chip producers listed in Silicon Industry Journal.
- To increase the client base by 20% annually through exceptional performance and positive referrals.
- To develop a sustainable and profitable startup.
1.2 Mission
The mission of Silicon Freight Brokers is to provide customers with the best shipping experience they’ve ever had. Our goal is to attract and retain customers. By focusing on this, everything else will fall into place. Our services will surpass customer expectations.
Company Summary
Silicon Freight Brokers, a freight broker for the silicon chip industry, serves buyers and sellers of silicon chips. We are building relationships with carriers specializing in this unique cargo. We are committed to offering our customers the highest level of service.
2.1 Start-up Summary
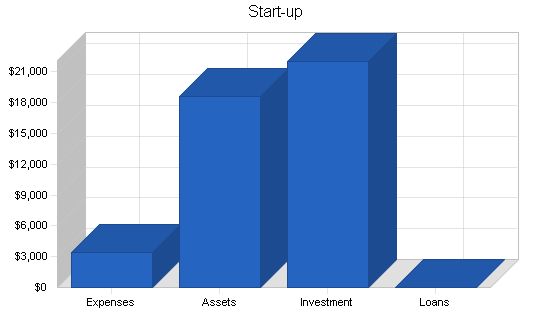
Silicon Freight Brokers’ start-up costs include office equipment, legal and marketing fees, accounting services, trade association dues, and a lease deposit.
The primary expense is a computer system with a minimum requirement of a 600MHz Pentium processor, 128MB RAM, a 10GB hard drive, printer, CD-RW, Microsoft Office, and accounting software. The office also needs a DSL broadband connection, two land-line phones, a fax machine, a copier, and office furniture.
Legal fees cover corporate formation and contract generation and review.
Marketing fees include advertisements in industry journals, brochures, and website visibility generation.
Accounting fees cover services required for business formation, with in-house accounting using computer software after start-up.
Trade association dues and an office lease deposit are self-explanatory.
Silicon Freight Brokers is a niche freight broker for the silicon chip industry. SFB will provide a brokerage service to connect manufacturers of silicon computer chips with the users of the chips (such as Intel, Texas Instruments, and Motorola) through freight companies. Freight brokers act as intermediaries between shippers and trucking companies, also known as "third party transportation providers." SFB will assist companies in finding a cost-effective and secure way to transport silicon chips.
SFB will have two types of customers: 1) Silicon chip manufacturers, which can be divided into those that manufacture overseas and those that manufacture in the U.S., and 2) Manufacturers of processors that utilize silicon chips.
SFB will focus on the freight brokerage of silicon chips, which is a small and specialized niche within the broader freight brokerage industry. This focus is driven by several factors: 1) SFB’s extensive knowledge and expertise in both freight brokerage and silicon chips, 2) the continuous growth of the silicon chip industry due to our increasing reliance on technology, and 3) the ample opportunity for a new specialty freight brokerage company. SFB’s deep understanding of both the freight and chip industries allows us to provide valuable insights to our customers.
In terms of market segmentation, SFB will solely concentrate on the freight brokerage of silicon chips. The niche market consists of two distinct customer groups: chip manufacturers and processor manufacturers. The chip manufacturers can be further categorized into those with manufacturing facilities abroad and those in the U.S. Overseas chip manufacturers typically ship their chips to a U.S. ocean port, which are then transported by truck to processor manufacturers. On the other hand, chip manufacturers based in the U.S. transport their chips directly to the processor manufacturers via truck. Although chip production has largely shifted overseas, there are still chip manufacturers located in the U.S. The difference between the two types is minimal; SFB arranges for the carrier to pick up the chips either from the boat or the manufacturing facility. The responsibility for shipping or arranging pickup of the chips depends on the contractual terms between the buyer and seller.
The chip buyers are the processor manufacturers who incorporate the chips into their products. The largest processor manufacturers, Intel, Texas Instruments, and Motorola, are based in the U.S.
| Market Analysis | |||||||
| Year 1 | Year 2 | Year 3 | Year 4 | Year 5 | |||
| Potential Customers | Growth | CAGR | |||||
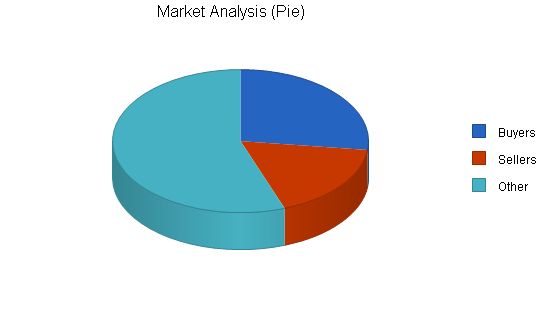
| Buyers | 7% | 340 | 364 | 389 | 416 | 445 | 6.96% |
| Sellers | 6% | 220 | 233 | 247 | 262 | 278 | 6.02% |
| Other | 0% | 700 | 700 | 700 | 700 | 700 | 0.00% |
| Total | 3.09% | 1,260 | 1,297 | 1,336 | 1,378 | 1,423 | 3.09% |
4.2 Target Market Segment Strategy
Silicon Freight Brokers focuses on the specialized silicon chips market, allowing us to provide superior service. Our close relationships with unique carriers give us valuable insight and enable us to meet any customer’s needs. We specialize in shipping silicon chips, avoiding distractions from other services. This specialization also allows us to develop close relationships with a limited number of carriers experienced in transporting chips. Furthermore, the rapid growth of processor manufacturing, which relies on silicon chips, makes this niche highly attractive.
In the freight broker market, SFB stands out as the most focused and specialized. As most silicon chips are transported by trucks in the U.S., there is considerable growth in the specialty freight brokerage business.
SFB markets its services through various channels, including the internet. We have a website where customers can easily find estimates for freight rates. By working with our carriers, we provide safe and economical solutions. Our specialization in silicon chips reduces complexities related to truck selection.
SFB also advertises in silicon chip trade journals to gain visibility among manufacturers and buyers.
4.3 Service Business Analysis
Freight brokerage services can be general or specialized, handling a wide range of materials such as heavy equipment, oversized loads, perishable commodities, or hazardous materials.
When choosing a freight broker, chip buyers and sellers consider service quality (including customer service, speed, and product safety) and price. With industry statistics showing 70-80% repeat business, once customers find a satisfactory service provider, they typically remain loyal.
Strategy and Implementation Summary
Silicon Freight Brokers targets the silicon chip market due to our deep industry knowledge. We attract customers through our website, advertisements in industry journals, and networking with 17 years of industry experience. Our specialized knowledge allows us to deliver superior service.
5.1 Competitive Edge
SFB’s sustainable competitive advantage comes from our extensive knowledge of the silicon chip industry and freight brokerage business. Steve has 10 years of experience in freight brokerage, while Wendy has 7 years of consulting experience in silicon chip usage for processors. Wendy’s understanding of the logistics involved in the supply chain of silicon chips is rare. SFB’s commitment to exceeding customer expectations also distinguishes us in the industry. With a high percentage of repeat business, providing excellent customer service is crucial.
Performing a SWOT analysis can aid in developing effective business strategies.
5.2 Sales Strategy
Our sales strategy consists of two main approaches. Firstly, establishing strategic relationships with carriers who excel at moving silicon chips. Secondly, closing deals with chip buyers and sellers to utilize our brokerage service.
SFB will compile a comprehensive report on all silicon chip carriers and aim to build mutually beneficial relationships with them. We have also developed a portfolio of potential customers through marketing and networking efforts. By demonstrating integrity and being a source of business, carriers will be motivated to work with SFB.
Once these relationships are established, SFB can offer customers a wide range of options. We will continue with marketing efforts to qualify leads and leverage our industry network for additional business. Customers seek hassle-free solutions, and SFB’s expertise and focus on silicon chips puts them at ease.
5.2.1 Sales Forecast
The initial month and a half will be spent setting up the new office, with minimal sales activity expected. SFB will also work on developing their website in collaboration with a web developer. During this period, SFB will establish relationships with carriers.
As a service provider business, labor costs and expenses are incurred, but there are no direct costs of sales. Labor costs are included in the Personnel table, and expenses are listed in the Profit and Loss table.
In the second month, SFB will hire a receptionist/secretary.
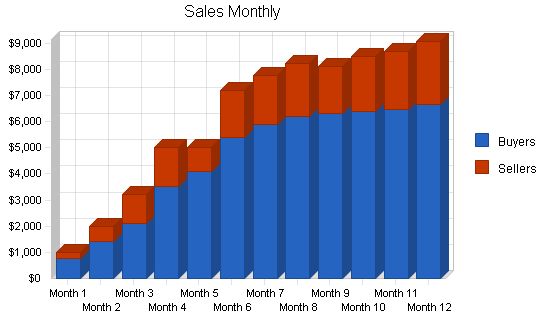
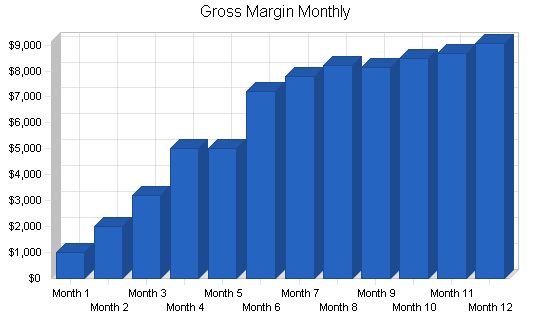
From the third month onwards, business activity will steadily increase, with phone inquiries and networking efforts driving growth. By the fifth month, SFB’s advertisements will be effective, resulting in a significant increase in business. The word-of-mouth referrals from new customers and the networking efforts will contribute to this growth.
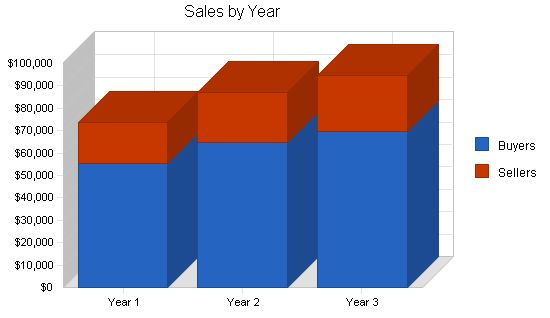
Sales
Year 1 Year 2 Year 3
Buyers $55,172 $64,587 $69,854
Sellers $18,560 $22,587 $24,854
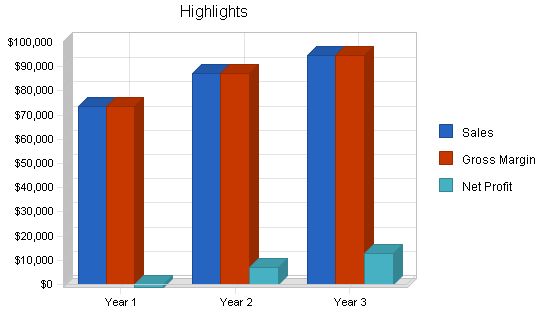
Total Sales $73,732 $87,174 $94,708
Direct Cost of Sales
Year 1 Year 2 Year 3
Buyers $0 $0 $0
Sellers $0 $0 $0
Subtotal Direct Cost of Sales $0 $0 $0
5.3 Milestones
Silicon Freight Brokers will have several milestones early on:
Business plan completion. This will be done the first month.
Office set-up. This will be done the first month.
Have the website up and running by month two.
Hire a third employee by month four.
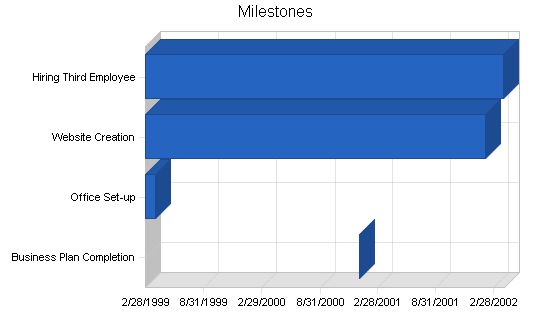
| Milestones | |||||
| Milestone | Start Date | End Date | Budget | Manager | Department |
| Business Plan Completion | 1/1/2001 | 1/1/2001 | $0 | Steve | Marketing |
| Office Set-up | 3/1/1999 | 4/1/1999 | $0 | Steve | Department |
| Website Creation | 3/1/1999 | 2/2/2002 | $0 | Steve | Department |
| Hiring Third Employee | 3/1/1999 | 4/1/2002 | $0 | Steve | Department |
| Totals | $0 | ||||
Management Summary
Silicon Freight Brokers is a C Corporation with Steve Tookarefol owning 100% of the stock.
Steve, the founder and sole stockholder, has a degree in mathematics from Notre Dame University. While in college, Steve worked in a travel agency, learning the nuances of a service-based organization that works on commission. After college, Steve joined Speedy Freight Lines in the accounts department. Recognizing Steve’s talent, Speedy moved him through various departments to familiarize him with the entire company. Steve eventually became the manager of broker accounts and held the position for two years. Steve spent a total of eight years at Speedy. In 2000, Speedy hired a new CEO, and Steve decided to leave and start his own company due to disagreements with the new direction.
Steve’s wife, Wendy, who has seven years of consulting experience with companies like Intel and Texas Instruments, will assist him on a consulting basis. Wendy’s expertise lies in processor usage of silicon chips.
The combination of Steve’s knowledge of the shipping industry and Wendy’s knowledge of silicon chip usage has positioned SFB to succeed in the niche freight brokerage market.
6.1 Personnel Plan
The staff will consist of Steve as the owner and licensed broker, working full time for SFB.
SFB will hire a secretary/receptionist and a customer service/account representative, both on a full-time basis and paid hourly wages. These positions will be filled at staggered times.
SFB will also utilize Wendy as an industry consultant, who will be invoiced on a monthly basis.
| Personnel Plan | |||
| Year 1 | Year 2 | Year 3 | |
| President/Broker | $24,000 | $24,000 | $24,000 |
| Secretary | $15,840 | $15,840 | $15,840 |
| Customer Service/Account Representative | $12,960 | $15,840 | $15,840 |
| Other | $0 | $0 | $0 |
| Total People | 3 | 3 | 3 |
| Total Payroll | $52,800 | $55,680 | $55,680 |
Financial Plan
The following subtopics will provide more financial information.
7.1 Important Assumptions
See table below for general assumptions.
| General Assumptions | |||
| Year 1 | Year 2 | Year 3 | |
| Plan Month | 1 | 2 | 3 |
| Current Interest Rate | 10.00% | 10.00% | 10.00% |
| Long-term Interest Rate | 10.00% | 10.00% | 10.00% |
| Tax Rate | 25.42% | 25.00% | 25.42% |
| Other | 0 | 0 | 0 |
7.2 Break-even Analysis
This break-even analysis table and chart project the necessary monthly commission. As a service provider business, we have labor costs and expenses, but no direct costs of sales. Salary costs are included in the Personnel table and expenses are listed in the Profit and Loss table.
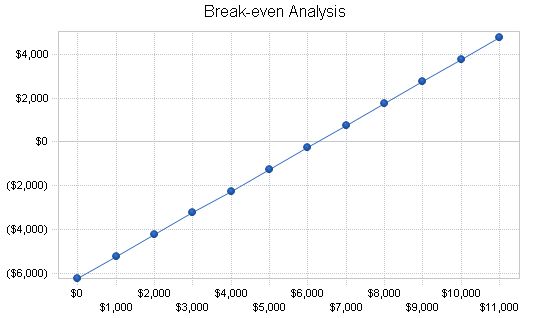
Break-even Analysis
Monthly Revenue Break-even: $6,251
Assumptions:
– Average Percent Variable Cost: 0%
– Estimated Monthly Fixed Cost: $6,251
Projected Profit and Loss:
The table below shows the projected profit and loss.
Pro Forma Profit and Loss
Sales|Year 1|$73,732|$87,174|$94,708
Direct Cost of Sales|$0|$0|$0
Other|$0|$0|$0
Total Cost of Sales|$0|$0|$0
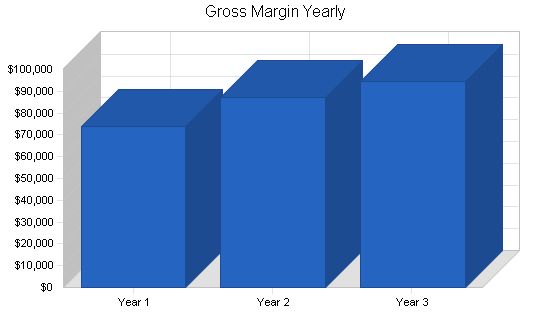
Gross Margin|$73,732|$87,174|$94,708
Gross Margin %|100.00%|100.00%|100.00%
Expenses|||||
Payroll|$52,800|$55,680|$55,680
Sales and Marketing and Other Expenses|$4,800|$4,250|$4,250
Depreciation|$672|$672|$672
Website Maintenance|$780|$780|$780
Utilities, DSL|$1,440|$1,440|$1,440
Insurance, Licenses|$1,200|$1,200|$1,200
Rent|$5,400|$5,400|$5,400
Payroll Taxes|$7,920|$8,352|$8,352
Other|$0|$0|$0
Total Operating Expenses|$75,012|$77,774|$77,774
Profit Before Interest and Taxes|($1,280)|$9,400|$16,934
EBITDA|($608)|$10,072|$17,606
Interest Expense|$0|$0|$0
Taxes Incurred|$0|$2,350|$4,304
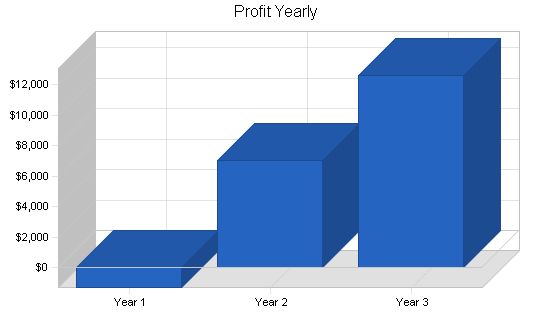
Net Profit|($1,280)|$7,050|$12,630
Net Profit/Sales|-1.74%|8.09%|13.34%
7.4 Projected Cash Flow
The table below shows our projected cash flow.
Pro Forma Cash Flow
| Cash Flow | |||
| Year 1 | Year 2 | Year 3 | |
| Cash Sales | $18,433 | $21,794 | $23,677 |
| Cash from Receivables | $42,219 | $62,996 | $69,694 |
| Subtotal Cash from Operations | $60,652 | $84,789 | $93,371 |
| Sales Tax, VAT, HST/GST Received | $0 | $0 | $0 |
| New Current Borrowing | $0 | $0 | $0 |
| New Other Liabilities (interest-free) | $0 | $0 | $0 |
| New Long-term Liabilities | $0 | $0 | $0 |
| Sales of Other Current Assets | $0 | $0 | $0 |
| Sales of Long-term Assets | $0 | $0 | $0 |
| New Investment Received | $4,000 | $0 | $0 |
| Subtotal Cash Received | $64,652 | $84,789 | $93,371 |
| Expenditures | Year 1 | Year 2 | Year 3 |
| Cash Spending | $52,800 | $55,680 | $55,680 |
| Bill Payments | $19,784 | $23,575 | $25,565 |
| Subtotal Spent on Operations | $72,584 | $79,255 | $81,245 |
| Sales Tax, VAT, HST/GST Paid Out | $0 | $0 | $0 |
| Principal Repayment of Current Borrowing | $0 | $0 | $0 |
| Other Liabilities Principal Repayment | $0 | $0 | $0 |
| Long-term Liabilities Principal Repayment | $0 | $0 | $0 |
| Purchase Other Current Assets | $0 | $0 | $0 |
| Purchase Long-term Assets | $0 | $0 | $0 |
| Dividends | $0 | $0 | $0 |
| Subtotal Cash Spent | $72,584 | $79,255 | $81,245 |
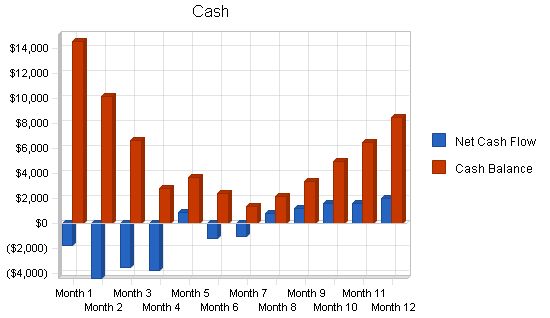
| Net Cash Flow | ($7,932) | $5,535 | $12,126 |
| Cash Balance | $8,418 | $13,953 | $26,079 |
7.5 Projected Balance Sheet
The projected balance sheet is as follows:
| Balance Sheet | |||
| Year 1 | Year 2 | Year 3 | |
| Cash | $8,418 | $13,953 | $26,079 |
| Accounts Receivable | $13,080 | $15,465 | $16,801 |
| Other Current Assets | $0 | $0 | $0 |
| Total Current Assets | $21,498 | $29,418 | $42,880 |
| Long-term Assets | $2,200 | $2,200 | $2,200 |
| Accumulated Depreciation | $672 | $1,344 | $2,016 |
| Total Long-term Assets | $1,528 | $856 | $184 |
| Total Assets | $23,026 | $30,274 | $43,064 |
| Current Liabilities | $1,756 | $1,954 | $2,114 |
| Long-term Liabilities | $0 | $0 | $0 |
| Total Liabilities | $1,756 | $1,954 | $2,114 |
| Paid-in Capital | $26,000 | $26,000 | $26,000 |
| Retained Earnings | ($3,450) | ($4,730) | $2,320 |
| Earnings | ($1,280) | $7,050 | $12,630 |
| Total Capital | $21,270 | $28,320 | $40,950 |
| Total Liabilities and Capital | $23,026 | $30,274 | $43,064 |
| Net Worth | $21,270 | $28,320 | $40,950 |
7.6 Business Ratios
The table below displays important business ratios from the freight transportation arrangement industry, according to the Standard Industry Classification (SIC) Index code 4731.
| Ratio Analysis | ||||
| Year 1 | Year 2 | Year 3 | Industry Profile | |
| Sales Growth | 0.00% | 18.23% | 8.64% | 4.00% |
| Accounts Receivable | 56.80% | 51.08% | 39.01% | 27.00% |
| Other Current Assets | 0.00% | 0.00% | 0.00% | 37.60% |
| Total Current Assets | 93.36% | 97.17% | 99.57% | 65.20% |
| Long-term Assets | 6.64% | 2.83% | 0.43% | 34.80% |
| Total Assets | 100.00% | 100.00% | 100.00% | 100.00% |
| Current Liabilities | 7.63% | 6.45% | 4.91% | 36.10% |
| Long-term Liabilities | 0.00% | 0.00% | 0.00% | 16.30% |
| Total Liabilities | 7.63% | 6.45% | 4.91% | 52.40% |
| Net Worth | 92.37% | 93.55% | 95.09% | 47.60% |
| Sales | 100.00% | 100.00% | 100.00% | 100.00% |
| Gross Margin | 100.00% | 100.00% | 100.00% | 33.90% |
| Selling, General & Administrative Expenses | 101.74% | 91.91% | 86.59% | 24.00% |
| Advertising Expenses | 1.63% | 0.75% | 0.69% | 0.50% |
| Profit Before Interest and Taxes | -1.74% | 10.78% | 17.88% | 1.20% |
| Current | 12.24 | 15.06 | 20.28 | 1.59 |
| Quick | 12.24 | 15.06 | 20.28 | 1.32 |
| Total Debt to Total Assets | 7.63% | 6.45% | 4.91% | 52.40% |
| Pro Forma Cash Flow | |||||||||||||
| Month 1 | Month 2 | Month 3 | Month 4 | Month 5 | Month 6 | Month 7 | Month 8 | Month 9 | Month 10 | Month 11 | Month 12 | ||
| Cash Received | |||||||||||||
| Cash from Operations | |||||||||||||
| Cash Sales | $250 | $500 | $800 | $1,250 | $1,250 | $1,800 | $1,943 | $2,053 | $2,030 | $2,125 | $2,168 | $2,265 | |
| Cash from Receivables | $0 | $25 | $775 | $1,530 | $2,445 | $3,750 | $3,805 | $5,414 | $5,839 | $6,156 | $6,100 | $6,379 | |
| Subtotal Cash from Operations | $250 | $525 | $1,575 | $2,780 | $3,695 | $5,550 | $5,748 | $7,467 | $7,870 | $8,281 | $8,268 | $8,644 | |
| Additional Cash Received | |||||||||||||
| Sales Tax, VAT, HST/GST Received | $0.00% | $0 | $0 | $0 | $0 | $0 | $0 | $0 | $0 | $0 | $0 | $0 | |
| New Current Borrowing | $0 | $0 | $0 | $0 | $0 | $0 | $0 | $0 | $0 | $0 | |||
| New Other Liabilities (interest-free) | $0 | $0 | $0 | $0 | $0 | $0 | $0 | $0 | |||||
| New Long-term Liabilities | $0 | $0 | $0 | $0 | $0 | $0 | $0 | $0 | |||||
| Sales of Other Current Assets | $0 | $0 | $0 | $0 | $0 | $0 | $0 | $0 | |||||
| Sales of Long-term Assets | $0 | $0 | $0 | $0 | $0 | $0 | $0 | $0 | |||||
| New Investment Received | $0 | $0 | $4,000 | $0 | $0 | $0 | $0 | $0 | |||||
| Subtotal Cash Received | $250 | $525 | $1,575 | $2,780 | $7,695 | $5,550 | $5,748 | $7,467 | $7,870 | $8,281 | $8,268 | $8,644 | |
Pro Forma Balance Sheet
| Pro Forma Balance Sheet | |||||||||||||
| Month 1 | Month 2 | Month 3 | Month 4 | Month 5 | Month 6 | Month 7 | Month 8 | Month 9 | Month 10 | Month 11 | Month 12 | ||
| Assets | Starting Balances | ||||||||||||
| Current Assets | |||||||||||||
| Cash | $16,350 | $14,551 | $10,143 | $6,577 | $2,769 | $3,667 | $2,420 | $1,374 | |||||
Hello!
I’m Andrew Brooks, a seasoned finance consultant from the USA and the mind behind phonenumber247.com.
My career is built on a foundation of helping individuals and businesses thrive financially in an ever-changing economic landscape. At phonenumber247.com, my aim is to demystify the complex world of finance, providing clear, actionable advice that can help you navigate your financial journey with confidence. Whether it’s personal finance management, investment strategies, or understanding the nuances of market dynamics, I’m here to share insights and tools that can propel you towards your financial goals.
Welcome to my digital space, where every piece of advice is a step closer to financial clarity and success!
