Dry Cleaning Home Delivery Business Plan
Columbia Cleaners is a start-up enterprise in Hillsboro, Oregon, owned by J.C. Copperbeech. The company will offer dry cleaning, laundry, and garment alterations with home pick-up and delivery services. A production facility will be established, eliminating the need for a retail shop. Delivery vans and customer service trained drivers will be necessary.
Customers can choose to pay upon delivery or via monthly credit card billing. Each month, statements will be sent to contract customers itemizing service fees and charges for payment.
The business offers a new door-to-door dry cleaning, laundry, and alteration service in Hillsboro, OR. This convenient service is likely to attract working customers who may become repeat customers if satisfied with the service quality. Loyal customers will recommend Columbia Cleaners to friends and coworkers, enhancing the company’s image and market share.
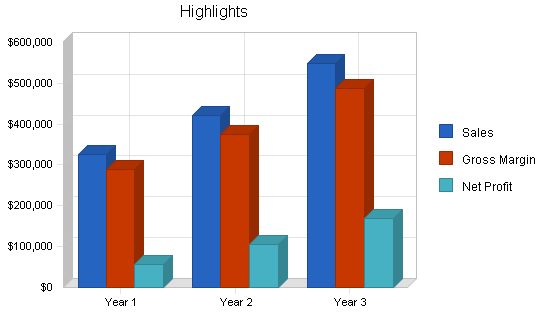
Sales forecast for the first year is $324,700, with modest net profits. Substantial growth in net profits is projected for the second and third year.
Contents
1.1 Objectives
Columbia Cleaners aims to:
- Establish a sustainable business within one year
- Exceed $324,000 in total sales during the first year
- Generate net profits
1.2 Mission
We will provide dry cleaning, laundry, and clothing alteration services with free home pickup and delivery, saving time for working customers.
1.3 Keys to Success
- A comprehensive marketing strategy is crucial for success in the first year of operation.
- The target customers value high quality service and will only choose our service if they are completely satisfied.
- Operating hours must be convenient and service completion must be timely to ensure customer satisfaction.
Company Summary
Columbia Cleaners is a start-up limited liability company based in Hillsboro, OR. We offer dry cleaning, laundry, and garment alterations with home pick-up and delivery services. We do not require a retail store front as we provide pick-up and delivery. We will need delivery vans and customer service trained drivers. Initially, the production facility will be rented and cleaning equipment will be leased with maintenance contracts.
Start-up financing will come from owner investment and bank loans, with a line of credit for operational needs.
2.1 Company Ownership
Columbia Cleaners is a limited liability company wholly owned by J.C. Copperbeech. As a small business, we do not have to disclose our finances publicly. The registration procedures are simple and we can start operations quickly. The owner/founder will also handle the bookkeeping responsibilities.
2.2 Start-up Summary
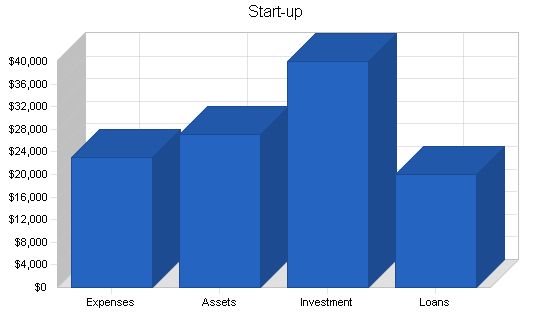
Startup expenses, funded through a combination of owner’s equity capital and a commercial loan, are summarized below.
Leasing equipment: Leasing machines costs $20,000 per year, including maintenance, compared to buying new machines for approximately $50,000. Leasing is the optimal solution since the business is new and has less experience in maintenance and repair. The following machines will be leased:
- 1 Washer – 38 lb capacity, high spin, microprocessor control, electric heat
- 1 Tumble dryer – 40 lb capacity, stainless steel drum, gas heated
- 1 Dry cleaning machine – 25 lb
- 1 Roller Iron 40 x 12 inch, variable speed, vacuum exhauster
- 1 Ironing table with steaming vacuum board, integral 2 gallon boiler, iron, water pump, light
Capital plan: The owner will invest $40,000 in the business. An additional $20,000 will be borrowed from a bank.
- Buying a van, office/facilities equipment (computer, printer, fax, telephone instrument, tables, chairs, shelving, work tables, racks, etc.), and initial leasing of laundry machines: approximately $27,000
- Buying another van in April: $10,000 (see the Cash Flow Table later in the document)
Loan: The lending plan must be completed and submitted to the bank six months before starting the business. The loan, needed two months in advance, will have an annual interest rate of 10% and will be secured with fixed assets.
Start-up Requirements:
– Legal: $1,000
– Stationery etc.: $1,200
– Brochures: $3,000
– Recruitment & training: $1,000
– Insurance: $700
– Rent: $1,200
– Utilities: $700
– Leased equipment: $1,667
– Expensed equipment: $10,000
– Other: $2,533
– Total Start-up Expenses: $23,000
Start-up Assets:
– Cash Required: $10,000
– Start-up Inventory: $2,000
– Other Current Assets: $0
– Long-term Assets: $15,000
– Total Assets: $27,000
Total Requirements: $50,000
Services:
Columbia Cleaners will provide the following services with free home pick-up and delivery in the Hillsboro area:
– Dry cleaning
– Laundry for personal clothes and large items like blankets, duvets, curtains, etc.
– Alteration service
Operations Plan:
Customers can participate in the service in two ways: signing contracts with Columbia Cleaners for regularly scheduled service, or ordering over the telephone or via e-mail.
Customers can choose to pay at each delivery or through monthly credit card billing. Statements will be sent to contract customers at the end of each month, itemizing fees and charges for their credit card payment.
No retail shop will be rented to reduce costs. An operations facility, divided into four sections, will be needed for installing machines and equipment, washing and cleaning activities, and storing garments and items. The sections include:
1. Machine installation and cleaning activities
2. Sorting and storage of dirty garments
3. Storing cleaned garments prior to delivery
4. Garment alteration workroom
The operation process will be controlled and monitored by a laundry expert employee, managed by the business owner.
Market Analysis Summary:
Dry cleaning, laundry, and alteration services are chosen for their low failure rate.
Payment for the service is accepted in cash, check, or credit card. The business receives monthly payments and has the potential for instant profit. The capital requirement for purchasing laundry equipment is minimal, reducing risk. The service only requires a small staff. It fulfills customers’ frequent demand for clean clothes, with few or no alternatives. The demand for the service is increasing due to changing lifestyles, incomes, and clothing expenditure.
Market Segmentation:
Columbia Cleaners will primarily target customers in the Hillsboro-Beaverton area, extending services to nearby towns west of Portland, OR, including Beaverton, Cedar Hills, Tigard, and Lake Oswego.
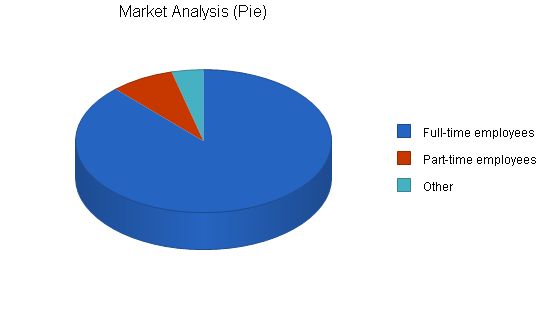
The target customers include full-time and part-time employed individuals who value convenience. The Hillsboro-Beaverton area has a total population of about 350,000, with approximately 250,000 in the labor force. Of the labor force, there are around 220,000 employed full time and 20,000 employed part time, with the rest being unemployed.
Market Analysis:
The table below shows the estimated percentage of Hillsboro-Beaverton residents working full time in 2004, which is higher than those working part-time. Employment, income, and GDP trends have increased over the years, resulting in an increased standard of living. This has led to people having less time for housework, including laundry. Tired after a full day of work, they prefer to hire someone else to do their housework. Additionally, working professionals tend to buy more clothes, especially expensive ones, and pay more attention to their care and cleaning. With thorough research, this business targets working and professional class customers.
Market Needs:
Research shows that when choosing a personal service such as laundry and dry cleaning, price is not the main factor but the convenience of the service. With increased discretionary income, people prioritize services that save them time and effort. While there are conventional drop-off dry cleaning/laundry services in the area, Columbia Cleaners primarily offers a convenient pickup/delivery service to busy individuals who value time-saving services.
Service Business Analysis:
The personal service industry is fragmented, with numerous small providers servicing the community’s laundry and dry cleaning needs. In the city of Hillsboro, there are about half a dozen dry cleaners, but only Convenient Door-to-Door Dry Cleaning provides the convenience of door-to-door service.
Competition and Buying Patterns:
Competition in the dry cleaning/laundry business in Hillsboro is not fierce. There are seven dry cleaners in the city, most offering traditional drop-off services. Convenient Door-to-Door Dry Cleaning, the only competitor offering door-to-door service, provides dry cleaning and shoe repair services. Initially, Convenient Door-to-Door Dry Cleaning will be a major local competitor. However, by offering enhanced convenience and time-saving services, Columbia Cleaners aims to win customers from its drop-off competitors.
Strategy and Implementation Summary:
Evaluation:
The following areas will be monitored to evaluate business performance: monthly and annual sales, profit, repeat business, and customer satisfaction. The success of the business depends on the quality and convenience of the service, customer opinions, and competitor response.
Optimism:
Columbia Cleaners provides a new door-to-door dry cleaning, laundry, and alteration service in Hillsboro. With convenient and quick service, working customers are likely to find it appealing. Satisfied customers will become loyal patrons and recommend the service to others, leading to increased market share and profitability.
Difficulties and Risks:
Being a start-up with no market share, Columbia Cleaners will need assertive and effective marketing efforts to establish a customer base. The business may face aggressive actions from competitors, which could hinder its growth. Monitoring and evaluating performance, collecting customer feedback, and continuously improving are necessary to mitigate risks.
Worst Case Risks:
The worst-case scenario is that the business cannot sustain itself due to underestimating costs or lower-than-expected sales and profits. Economic recessions, political changes, or inflation may further worsen the business’s performance.
Competitive Edge:
As the U.S. economy recovers, people prioritize leisure activities over housework, leading them to seek cleaning services. Columbia Cleaners aims to provide a door-to-door service that eliminates the need for customers to drive to a physical location, find parking, and wait. With free delivery, the business saves customers time and makes their lives simpler.
Strengths:
– Offering a relatively new door-to-door service for dry cleaning and laundry
– Providing quick and convenient service to save customers’ time
Weaknesses:
– Facing competition from established competitors in Hillsboro
– Starting with no market share and less experience than competitors
Opportunities:
– Increasing expenditures on clothing, including expensive items
– More women working outside the home, increasing demand for laundry services
– Growing average income in Hillsboro
– Increased preference for leisure activities over housework
– Steady growth in the dry cleaning and laundry service industry
– Likelihood of repeat business and decreasing fixed costs with increased sales volume
Threats:
– Potential new competitors entering the market
– Technological advancements leading to at-home dry cleaning machines
Marketing Strategy:
Place: Columbia Cleaners will deal directly with customers, offering pick-up and delivery services in customers’ houses in Hillsboro. By avoiding the need for a physical shop and reducing costs, the business aims to provide convenience to customers.
Product: The business offers free home pickup and delivery services between 6 pm – 9 pm three times per week. Columbia Cleaners strives to provide high-quality dry cleaning, laundry, and alteration services with the utmost convenience.
Price: Prices will be set to match competitors, as the target market of working and professional customers prioritize convenience and quality over price. Higher-income individuals are willing to pay more for features, customer service, quality, and convenience.
Promotion: The business will advertise through various channels such as local press, the Internet, public areas, and direct-mail campaigns. Incentives like discounts for one-year contracts and lower prices for loyal customers will also be offered.
Sales Strategy:
To attract customers, Columbia Cleaners will initially match competitors’ prices while closely monitoring financials. Customer service training will be provided to employees to ensure customer satisfaction, leading to customer retention and referrals. Limited discounts and incentives for new customer referrals will be offered.
Sales Forecast:
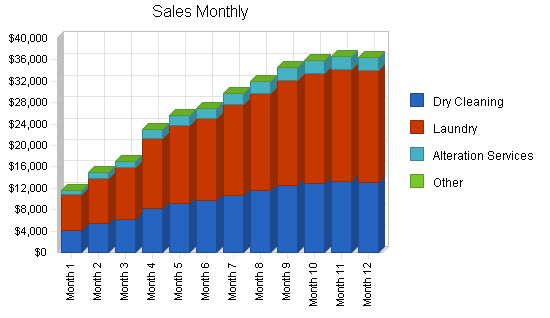
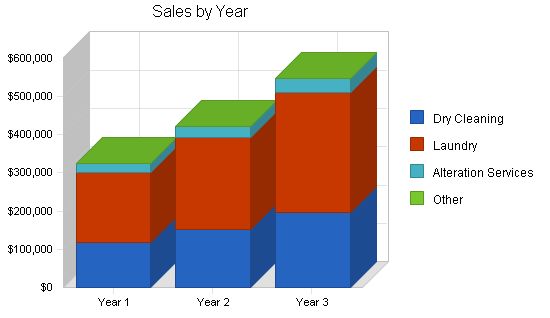
The sales forecast for 2005 gradually increases, reaching a total of $324,700. However, sales may remain steady in the last three months due to seasonal factors.
Sales Forecast
Year 1 Year 2 Year 3
Dry Cleaning $116,892 $151,960 $197,548
Laundry $185,079 $240,603 $312,784
Alteration Services $22,729 $29,547 $38,412
Other $0 $0 $0
Total Sales $324,700 $422,110 $548,744
Direct Cost of Sales
Year 1 Year 2 Year 3
Dry Cleaning $14,027 $18,235 $23,706
Laundry $14,806 $19,248 $25,023
Alteration Services $6,819 $8,864 $11,524
Other $0 $0 $0
Subtotal Direct Cost of Sales $35,652 $46,348 $60,252
Management Summary
The owner of the business will be director and accountant, working full time. A laundry expert will be employed and will be in charge of the operation and the quality of garment cleaning. Workers will report to the laundry expert who reports to the owner.
Personnel Plan
Through consultations with a dry cleaning consultant, terms of reference for a laundry expert and workers are prepared. Employment information will be advertised in local newspapers. A laundry expert and two part-time workers with laundry experience will be employed.
The laundry expert will be in charge of the operation and the quality of garment cleaning. Workers will be responsible for cleaning and classifying work and have a duty to report daily work to the laundry expert. The expert will report their working results and problems to the director.
Two part-time drivers for picking up and delivering clothes will work from 5:30 pm – 9:30 pm three times a week.
The staff should be able to:
– Understand and apply dry cleaning and washing processes
– Meet set standards by following instructions
– Work in hot, humid surroundings
– Perform the same work continuously
– Overtime may be required during peak seasons such as spring and autumn.
Number of staff and salary in the period of January to March 2005:
Description No of people Salary per hour ($), Working hours/week
Owner 1 23 40
Laundry expert 1 12 40
Workers 2 9 48
Drivers 2 7 24
Total 6 51 152
From April 2005, the business has more customers and becomes busier, thus new staff (a worker and a driver) are employed. The business prefers to hire extra part-time workers and drivers sharing the total needed working hours. In case one of them becomes sick or busy, other staff can replace him, therefore the working process will not be affected.
An average 5% increase in all salaries is planned for the following two years of operations.
Personnel Plan
Year 1 Year 2 Year 3
Director/Accountant $48,000 $50,400 $52,920
Laundry expert $24,960 $26,208 $27,518
Worker-1 $11,232 $11,794 $12,383
Worker-2 $11,232 $11,794 $12,383
Worker-3 $8,424 $8,845 $9,287
Driver-1 $4,368 $4,586 $4,816
Driver-2 $4,368 $4,586 $4,816
Driver-3 $3,276 $3,440 $3,612
Other $0 $0 $0
Total People 8 8 8
Total Payroll $115,860 $121,653 $127,736
The following topics, the cash flow statement, profit and loss account, and balance sheet have been built using forecasted information that is accurate and realistic. Sales increase gradually over the 12 months, showing a positive trend. Columbia Cleaners is steadily gaining market share. Gross profit and net profit rise proportionately to sales revenue. The financial statements show the business runs quite well and achieves expected results.
Start-up Funding
Startup expenses will be funded through a combination of owner’s equity capital and a commercial loan, as summarized below.
The owner will invest $40,000 in the business. Additional capital for the business in the amount of $20,000 will be borrowed from a bank.
The lending plan has to be completed and submitted to the bank 6 months before starting the business. The loan will be needed two months in advance. Annual interest of 10% has to be paid on the long-term loans secured with fixed assets.
Start-up Funding
Start-up Expenses to Fund $23,000
Start-up Assets to Fund $27,000
Total Funding Required $50,000
Assets
Non-cash Assets from Start-up $17,000
Cash Requirements from Start-up $10,000
Additional Cash Raised $10,000
Cash Balance on Starting Date $20,000
Total Assets $37,000
Liabilities and Capital
Liabilities
Current Borrowing $0
Long-term Liabilities $20,000
Accounts Payable (Outstanding Bills) $0
Other Current Liabilities (interest-free) $0
Total Liabilities $20,000
Capital
Planned Investment
J.C. Copperbeech $40,000
Other investors $0
Additional Investment Requirement $0
Total Planned Investment $40,000
Loss at Start-up (Start-up Expenses) ($23,000)
Total Capital $17,000
Total Capital and Liabilities $37,000
Total Funding $60,000
Break-even Analysis
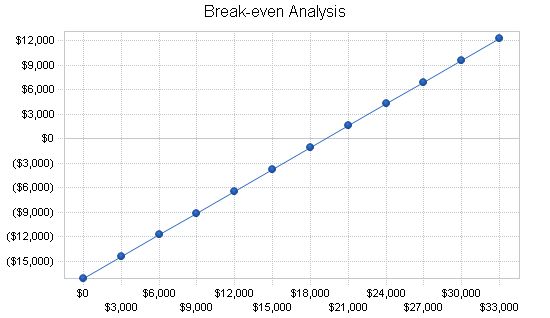
The monthly break-even point of the business is calculated below. As revenue becomes higher than the break-even point, the business starts to profit. As forecasted, the total demand for dry cleaning and laundry service continues to rise in the following years. Therefore, if the service satisfies customers, increases new customers, and retains customer loyalty, the profit will continue to go up.
Break-even Analysis
Monthly Revenue Break-even: $19,205
Assumptions:
– Average Percent Variable Cost: 11%
– Estimated Monthly Fixed Cost: $17,097
7.3 Projected Cash Flow
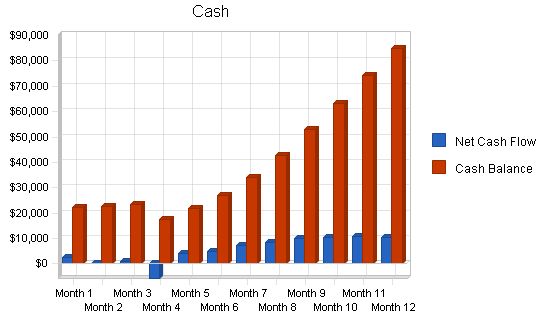
The cash flow gradually increases over the year, creating a positive net worth. The first few months of operation are crucial for the business’s survival, and we will closely monitor our cash flows. In April 2005, we plan to purchase another van to accommodate the growing business volumes. Initially, we will only accept cash or credit card payments and will not offer credit sales. By the middle of the first year of operations, we expect to have a sufficient customer base, which will enable us to maintain healthy cash balances. See the table below for a summary.
Pro Forma Cash Flow
Year 1 Year 2 Year 3
Cash Received
Cash from Operations
Cash Sales $324,700 $422,110 $548,744
Subtotal Cash from Operations $324,700 $422,110 $548,744
Additional Cash Received
Sales Tax, VAT, HST/GST Received $0 $0 $0
New Current Borrowing $0 $0 $0
New Other Liabilities (interest-free) $0 $0 $0
New Long-term Liabilities $0 $0 $0
Sales of Other Current Assets $0 $0 $0
Sales of Long-term Assets $0 $0 $0
New Investment Received $0 $0 $0
Subtotal Cash Received $324,700 $422,110 $548,744
Expenditures
Year 1 Year 2 Year 3
Expenditures from Operations
Cash Spending $115,860 $121,653 $127,736
Bill Payments $133,714 $191,828 $245,003
Subtotal Spent on Operations $249,574 $313,481 $372,739
Additional Cash Spent
Sales Tax, VAT, HST/GST Paid Out $0 $0 $0
Principal Repayment of Current Borrowing $0 $0 $0
Other Liabilities Principal Repayment $0 $0 $0
Long-term Liabilities Principal Repayment $334 $0 $0
Purchase Other Current Assets $0 $0 $0
Purchase Long-term Assets $10,000 $0 $0
Dividends $0 $0 $0
Subtotal Cash Spent $259,908 $313,481 $372,739
Net Cash Flow $64,792 $108,629 $176,005
Cash Balance $84,792 $193,421 $369,426
7.4 Projected Profit and Loss
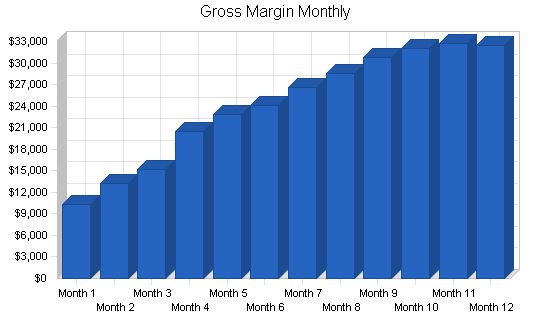
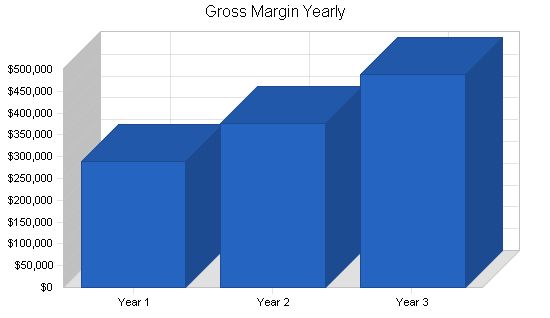
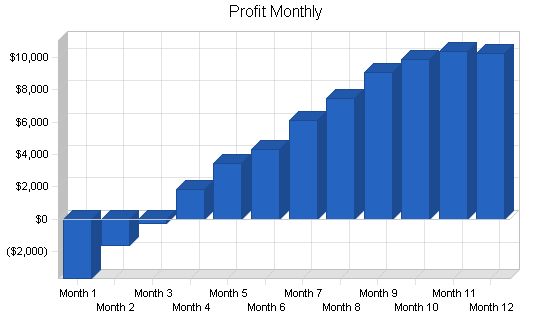
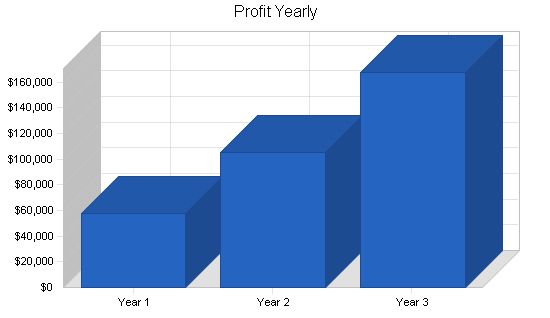
The table below outlines our projected profit and loss statements for the first three years of operation. In general, the business might face difficulties in the beginning months, but after that, it grows and generates a small profit at the end of the year. It is not necessary for the business to gain high profits in the first year. Nevertheless, we expect to make a small profit in the first year. Our second and third-year net profits are expected to significantly increase, as shown below.
| Pro Forma Profit and Loss | |||
| Year 1 | Year 2 | Year 3 | |
| Sales | $324,700 | $422,110 | $548,744 |
| Direct Cost of Sales | $35,652 | $46,348 | $60,252 |
| Other Costs of Sales | $0 | $0 | $0 |
| Total Cost of Sales | $35,652 | $46,348 | $60,252 |
| Gross Margin | $289,048 | $375,762 | $488,492 |
| Gross Margin % | 89.02% | 89.02% | 89.02% |
| Expenses | |||
| Payroll | $115,860 | $121,653 | $127,736 |
| Marketing/Promotion | $2,250 | $2,700 | $3,000 |
| Depreciation | $4,500 | $4,000 | $5,000 |
| Rent | $14,400 | $15,000 | $16,000 |
| Utilities | $11,100 | $12,000 | $13,000 |
| Telecommunications | $4,800 | $5,000 | $5,500 |
| Insurance | $10,200 | $11,000 | $12,000 |
| Payroll Taxes | $0 | $0 | $0 |
| Maintenance | $1,200 | $1,500 | $2,000 |
| Gas | $5,250 | $6,500 | $7,500 |
| Equipment lease | $20,000 | $20,000 | $20,000 |
| Office cleaning | $3,600 | $4,000 | $5,000 |
| Other | $12,000 | $20,000 | $30,000 |
| Total Operating Expenses | $205,160 | $223,353 | $246,736 |
| Profit Before Interest and Taxes | $83,888 | $152,409 | $241,756 |
| EBITDA | $88,388 | $156,409 | $246,756 |
| Interest Expense | $1,967 | $1,967 | $1,967 |
| Taxes Incurred | $24,576 | $45,133 | $71,937 |
| Net Profit | $57,345 | $105,310 | $167,853 |
| Net Profit/Sales | 17.66% | 24.95% | 30.59% |
7.5 Projected Balance Sheet
The table below shows the balance sheet annual figures for the first three years of operation. First year monthly figures are presented in the appendix.
| Pro Forma Balance Sheet | |||
| Year 1 | Year 2 | Year 3 | |
| Assets | |||
| Current Assets | |||
| Cash | $84,792 | $193,421 | $369,426 |
| Inventory | $4,008 | $5,210 | $6,773 |
| Other Current Assets | $0 | $0 | $0 |
| Total Current Assets | $88,800 | $198,631 | $376,199 |
| Long-term Assets | |||
| Long-term Assets | $25,000 | $25,000 | $25,000 |
| Accumulated Depreciation | $4,500 | $8,500 | $13,500 |
| Total Long-term Assets | $20,500 | $16,500 | $11,500 |
| Total Assets | $109,300 | $215,131 | $387,699 |
| Liabilities and Capital | Year 1 | Year 2 | Year 3 |
| Current Liabilities | |||
| Accounts Payable | $15,289 | $15,810 | $20,525 |
| Current Borrowing | $0 | $0 | $0 |
| Other Current Liabilities | $0 | $0 | $0 |
| Subtotal Current Liabilities | $15,289 | $15,810 | $20,525 |
| Long-term Liabilities | $19,666 | $19,666 | $19,666 |
| Total Liabilities | $34,955 | $35,476 | $40,191 |
| Paid-in Capital | $40,000 | $40,000 | $40,000 |
| Retained Earnings | ($23,000) | $34,345 | $139,655 |
| Earnings | $57,345 | $105,310 | $167,853 |
| Total Capital | $74,345 | $179,655 | $347,508 |
| Total Liabilities and Capital | $109,300 | $215,131 | $387,699 |
| Net Worth | $74,345 | $179,655 | $347,508 |
7.6 Business Ratios
Business ratios for the years of this plan are shown below. Industry profile ratios for Commercial Drycleaning and Laundry Collection and Distribution Establishments, based on the Standard Industrial Classification code 7216.9903, are shown for comparison.
| Ratio Analysis | ||||
| Year 1 | Year 2 | Year 3 | Industry Profile | |
| Sales Growth | 0.00% | 30.00% | 30.00% | 4.37% |
| Percent of Total Assets | ||||
| Inventory | 3.67% | 2.42% | 1.75% | 4.37% |
| Other Current Assets | 0.00% | 0.00% | 0.00% | 38.35% |
| Total Current Assets | 81.24% | 92.33% | 97.03% | 55.47% |
| Long-term Assets | 18.76% | 7.67% | 2.97% | 44.53% |
| Total Assets | 100.00% | 100.00% | 100.00% | 100.00% |
| Current Liabilities | ||||
| Accounts Payable | 15.29% | 15.81% | 20.52% | 22.38% |
| Current Borrowing | 0.00% | 0.00% | 0.00% | 24.56% |
| Other Current Liabilities | 0.00% | 0.00% | 0.00% | 46.94% |
| Subtotal Current Liabilities | 15.29% | 15.81% | 20.52% | 46.94% |
| Long-term Liabilities | 19.66% | 19.66% | 19.66% | 53.06% |
| Total Liabilities | 31.98% | 35.48% | 40.19% | 61.40% |
| Net Worth | 68.02% | 83.52% | 89.63% | 53.06% |
| Percent of Sales | ||||
| Sales | 100.00% | 100.00% | 100.00% | 100.00% |
| Gross Margin | 89.02% | 89.02% | 89.02% | 100.00% |
| Selling, General & Administrative Expenses | 71.36% | 64.07% | 58.43% | |
| Month 1 | Month 2 | Month 3 | Month 4 | Month 5 | Month 6 | Month 7 | Month 8 | Month 9 | Month 10 | Month 11 | Month 12 | |
| Cash Sales | $11,600 | $14,900 | $17,100 | $23,000 | $25,600 | $27,000 | $29,800 | $32,000 | $34,600 | $35,900 | $36,700 | $36,500 |
| Subtotal Cash from Operations | $11,600 | $14,900 | $17,100 | $23,000 | $25,600 | $27,000 | $29,800 | $32,000 | $34,600 | $35,900 | $36,700 | $36,500 |
| Sales Tax, VAT, HST/GST Received | 0.00% | $0 | $0 | $0 | $0 | $0 | $0 | $0 | $0 | $0 | $0 | $0 |
| New Current Borrowing | $0 | $0 | $0 | $0 | $0 | $0 | $0 | $0 | $0 | $0 | $0 | $0 |
| New Other Liabilities (interest-free) | $0 | $0 | $0 | $0 | $0 | $0 | $0 | $0 | $0 | $0 | $0 | $0 |
| New Long-term Liabilities | $0 | $0 | $0 | $0 | $0 | $0 | $0 | $0 | $0 | $0 | $0 | $0 |
| Sales of Other Current Assets | $0 | $0 | $0 | $0 | $0 | $0 | $0 | $0 | $0 | $0 | $0 | $0 |
| Sales of Long-term Assets | $0 | $0 | $0 | $0 | $0 | $0 | $0 | $0 | $0 | $0 | $0 | $0 |
| New Investment Received | $0 | $0 | $0 | $0 | $0 | $0 | $0 | $0 | $0 | $0 | $0 | $0 |
| Subtotal Cash Received | $11,600 | $14,900 | $17,100 | $23,000 | $25,600 | $27,000 | $29,800 | $32,000 | $34,600 | $35,900 | $36,700 | $36,500 |
| Cash Spending | $8,680 | $8,680 | $8,680 | $9,980 | $9,980 | $9,980 | $9,980 | $9,980 | $9,980 | $9,980 | $9,980 | $9,980 |
| Bill Payments | $202 | $6,108 | $7,526 | $8,740 | $11,419 | $12,029 | $12,452 | $13,646 | $14,418 | $15,419 | $15,763 | $15,995 |
| Subtotal Spent on Operations | $8,882 | $14,788 | $16,206 | $18,720 | $21,399 | $22,009 | $22,432 | $23,626 | $24,398 | $25,399 | $25,743 | $25,975 |
| Sales Tax, VAT, HST/GST Paid Out | $0 | $0 | $0 | $0 | $0 | $0 | $0 | $0 | $0 | $0 | $0 | $0 |
| Principal Repayment of Current Borrowing | $0 | $0 | $0 | $0 | $0 | $0 | $0 | $0 | $0 | $0 | $0 | $0 |
| Other Liabilities Principal Repayment | $0 | $0 | $0 | $0 | $0 | $0 | $0 | $0 | $0 | $0 | $0 | $0 |
| Long-term Liabilities Principal Repayment | $334 | $0 | $0 | $0 | $0 | $0 | $0 | $0 | $0 | $0 | $0 | $0 |
| Purchase Other Current Assets | $0 | $0 | $0 | $0 | $0 | $0 | $0 | $0 | $0 | $0 | $0 | $0 |
| Purchase Long-term Assets | $0 | $0 | $0 | $10,000 | $0 | $0 | $0 | $0 | $0 | $0 | $0 | $0 |
| Dividends | $0 | $0 | $0 | $0 | $0 | $0 | $0 | $0 | $0 | $0 | $0 | $0 |
| Net Cash Flow | $2,384 | $112 | $894 | ($5,720) | $4,201 | $4,991 | $7,368 | $8,374 | $10,202 | $10,501 | $10,957 | $10,525 |
| Cash Balance | $22,384 | $22,496 | $23,390 | $17,671 | $21,872 | $26,863 | $34,232 | $42,606 | $52,808 | $63,310 | $74,267 | $84,792 |
Pro Forma Balance Sheet
| Month 1 | Month 2 | Month 3 | Month 4 | Month 5 | Month 6 | Month 7 | Month 8 | Month 9 | Month 10 | Month 11 | Month 12 | ||
| Cash | $20,000 | $22,384 | $22,496 | $23,390 | $17,671 | $21,872 | $26,863 | $34,232 | $42,606 | $52,808 | $63,310 | $74,267 | $84,792 |
| Inventory | $2,000 | $1,726 | $1,636 | $1,878 | $2,525 | $2,811 | $2,965 | $3,272 | $3,514 | $3,799 | $3,942 | $4,030 | $4,008 |
| Other Current Assets | $0 | $0 | $0 | $0 | $0 | $0 | $0 | $0 | $0 | $0 | $0 | $0 | $0 |
| Total Current Assets | $22,000 | $24,111 | $24,132 | $25,268 | $20,196 | $24,683 |
Hello!
I’m Andrew Brooks, a seasoned finance consultant from the USA and the mind behind phonenumber247.com.
My career is built on a foundation of helping individuals and businesses thrive financially in an ever-changing economic landscape. At phonenumber247.com, my aim is to demystify the complex world of finance, providing clear, actionable advice that can help you navigate your financial journey with confidence. Whether it’s personal finance management, investment strategies, or understanding the nuances of market dynamics, I’m here to share insights and tools that can propel you towards your financial goals.
Welcome to my digital space, where every piece of advice is a step closer to financial clarity and success!
