O’Connor & Partners LLC specializes in consulting for companies seeking to produce chemicals and energy from annually renewable feedstocks. Our goal is to help clients economically utilize biomass by converting major fractions and minor components into high-value specialty products. Biomass consists of cellulose and hemicellulose, which are long chains of simple sugars.
Many chemicals currently derived from petroleum were once produced from sugar. Some of these chemicals have niche markets and high entry barriers, while others are commodities with optimized manufacturing costs in traditional refineries. To compete with petroleum-derived commodity chemicals, it is crucial to start with lower feedstock costs. Under-utilized lignocellulosic biomass feeds have the potential to be significantly cheaper than petroleum on a carbon basis. Biomass contains the same sugars that have proven to be effective.
Certain products can only be made efficiently from biomass sugars. Industrial biotechnology has developed fermentation organisms that produce high selectivities for specific products, including pharmaceutical compounds. Traditional feedstocks and processes would be much more expensive, if not impossible. An excellent example of industrial biotechnology is Cargill Dow LLC’s production of polylactide polymers from fermenting corn sugars. This field has been referred to as the "third wave of biotechnology."
O’Connor & Partners LLC recognizes that successful ventures in bio-refining require both technical excellence and economic understanding. We aim to provide management consulting services to individuals and companies leading the bio-industrial revolution. Our clients include emerging industrial biotechnology firms, large chemical companies and utilities, and agricultural operations. With our assistance, clients can achieve industrial success at a lower cost and/or in less time than they could alone, while adhering to principles of economic, environmental, and social responsibility.
The potential market for bio-refining is estimated to range from $280 billion/year to $500 billion/year by 2013.
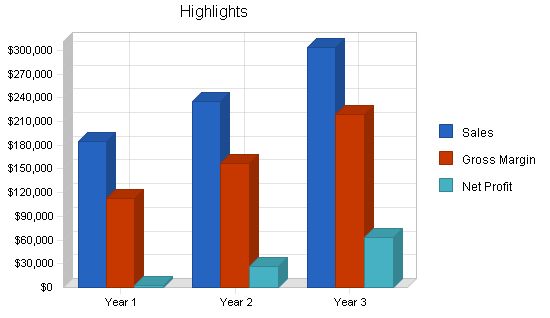
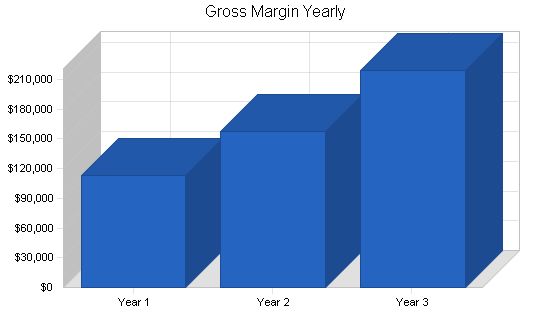
O’Connor & Partners LLC will begin operations in Minneapolis, Minnesota with the founding partner (Ryan O’Connor), one associate (to be recruited), and one secretary. Figure 1 outlines projected sales, gross margin, and net profit for the three-year period covered in this business plan. With initial investment and modest profits, the firm aims to develop a strong net worth by year 3. At that point, expansion or a buy-out from a larger consultancy may be considered.
1.1 Mission
O’Connor & Partners will be the leading bio-refining consulting firm in the United States, providing expertise in the technical and economic analysis of integrated bio-refining projects. We will adhere to our economic, social, and environmental responsibilities for our clients, our industry, and ourselves.
1.2 Objectives
We seek to establish the industry standard for technical and business excellence in visionary bio-refining platforms, based on customer satisfaction and industry surveys. To accomplish this, the following elements are crucial:
- Unique consulting services.
- Effective management of confidentiality and intellectual-property issues.
- Professional relevance and knowledge growth in a rapidly expanding industry.
- Demonstrated concern for clients’ well-being, leading to repeat business and a good reputation.
- Retention of our employees and partners.
1.3 Keys to Success:
- Professional quality in all consulting.
- Effective management of confidentiality and intellectual-property issues.
- Professional relevance and knowledge growth in rapidly expanding industry.
- Retention of existing clients.
Company Summary:
O’Connor & Partners LLC is a new consulting venture that will officially open for business on January 1. Headquartered in Minneapolis, MN, USA, with global external affiliates, we offer consulting services exclusively in the industrial bio-refinery industry, which revolutionizes chemicals and energy production from renewable resources.
2.1 Start-up Summary:
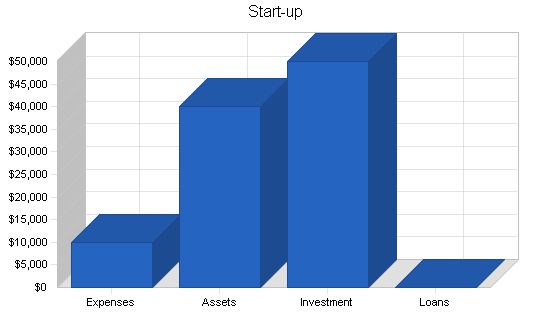
Total estimated start-up expenses are provided in the table below. Some categories, such as insurance, have unknown costs, but reasonable estimates have been made. Other items can be purchased as revenue is obtained and additional resources are needed.
The plan includes a liquid asset fund at start-up, covering expenses for the initial months and serving as a cash reserve.
Start-up Expenses:
– Legal: $2,000
– Stationery: $500
– Brochures: $500
– Insurance: $1,000
– Rent: $1,000
– Research and Development: $1,000
– Expensed Equipment: $4,000
– Total Start-up Expenses: $10,000
Start-up Assets:
– Cash Required: $40,000
– Other Current Assets: $0
– Long-term Assets: $0
– Total Assets: $40,000
Total Requirements: $50,000
Start-up Funding:
– Start-up Expenses to Fund: $10,000
– Start-up Assets to Fund: $40,000
– Total Funding Required: $50,000
Assets:
– Non-cash Assets from Start-up: $0
– Cash Requirements from Start-up: $40,000
– Additional Cash Raised: $0
– Cash Balance on Starting Date: $40,000
– Total Assets: $40,000
Liabilities and Capital:
– Liabilities:
– Current Borrowing: $0
– Long-term Liabilities: $0
– Accounts Payable (Outstanding Bills): $0
– Other Current Liabilities (interest-free): $0
– Total Liabilities: $0
– Capital:
– Planned Investment:
– Investor 1: $25,000
– Investor 2: $25,000
– Additional Investment Requirement: $0
– Total Planned Investment: $50,000
– Loss at Start-up (Start-up Expenses): ($10,000)
– Total Capital: $40,000
– Total Capital and Liabilities: $40,000
Total Funding: $50,000
Company Ownership:
The company will be organized as a limited-liability company (LLC), enabling future changes of ownership and offering tax advantages. Start-up investment is required. The firm’s total valuation is modest, and a net worth will be realized in year 4 of operation. Initial ownership is divided into 20 equity shares at $5,000 per share for 1% ownership each. Outside investors will own 20% of the venture, while the remaining 80% will be shared among future partners recruited as the business grows.
An option is available to equity investors, allowing a 70% total return on investment after three years with the transfer of ownership to firm partners. This provides an exit strategy and potential long-term upside for initial investors.
Company Locations and Facilities:
Office space will be rented in the Twin Cities (Minneapolis/St. Paul) of Minnesota. A downtown office location will be advantageous, especially if local clientele are also located downtown. The founder will retain a home office and one at the central headquarters to serve clients in the Minnetonka area, such as Cargill or Cargill Dow LLC.
Services:
O’Connor & Partners LLC offers consulting services to assist clients with various stages of their bio-refinery activities. The services provided include technical engineering, economic forecasting, and management strategy on a confidential basis. The standard hourly rate for partners is $175/hr and $125/hr for associates. In certain cases, compensation can be in the form of equity in the client’s venture.
Service Description:
The management-consulting services of O’Connor & Partners include:
– Market research and business development
– Biomass-feedstock supply and demand
– Bio-refinery chemicals, materials, fuels, energy, and other products in competition with petroleum-derived equivalents
– Production of chemicals and materials from biomass resources
– Future bio-refinery products such as hydrogen and chemicals produced from fermenting biomass sugars
– Confidential discussions with potential partners and vendors
– Economic analysis of projects and plans
– R&D projects
– Pilot and manufacturing facility designs
– Financial assessment of capital-investment options
– Affiliate Network services
– Engineering and construction of bio-refineries
– Contractual R&D in industrial and government facilities
– Intellectual-property management and competitive-advantage strategies
– Project funding search
– Client education through seminars and training
Who Will Buy, and Why?:
– Start-ups and groups considering starting up in the industrial biotechnology sector
– Companies looking to grow their bio-refinery businesses or expand into new markets
– Large global corporations aiming for sustainable development
– Organizations in the agriculture, chemicals, and energy industries
– Companies wanting to become more sustainable or enter new markets
How Much Does It Cost?:
The cost of services will be outlined at the beginning of a project. The standard hourly rates for partners and associates are $175/hr and $125/hr, respectively. Travel expenses will be billed separately. In some cases, clients may opt for fixed-bid contracts. Equity compensation is also an option for clients unable to pay fees upfront.
What Is the Service, Exactly?:
O’Connor & Partners’ goal is to save clients time and money through research studies, calculations, simulations, and report writing. The firm utilizes its proprietary computer model and expertise to provide valuable insights and make recommendations. Communication with clients is facilitated through teleconferences, meetings, email, and fax.
Competitive Comparison:
Key reasons clients choose O’Connor & Partners:
– Cost savings and increased profitability compared to in-house work
– Expertise in transportation industry
– In-depth understanding of transportation technologies and economics
– Strategic vision and competitive advantage
– Ability to handle large strategic projects through the Affiliate Network
Sales Literature:
Sales literature, including brochures and a website, will provide information about O’Connor & Partners’ philosophy, mission statement, and relevant resources. Rate information will be provided upon inquiry. The website will also serve as a platform for project management and communication with clients.
Fulfillment:
The fulfillment of services will be provided by the firm’s partners, associates, and the Affiliate Network. Dedicated communication tools, including internet, email, and fax, will be utilized to facilitate efficient exchange of information with clients.
Proprietary Computer Model:
O’Connor & Partners will develop a proprietary computer model called Biofinity™ using simulation software. This model will analyze multiple feedstocks, product scenarios, and costs to assess the business potential of different options. It will also assist clients with environmental life-cycle inventory assessment.
Future Services:
As the industry evolves, O’Connor & Partners may expand its services to address emerging issues and leverage its expertise. The firm’s growth will depend on industry growth and demand. Additional offices may be established globally.
Affiliate Network:
The Affiliate Network is a crucial part of O’Connor & Partners’ success. It includes top engineering and construction companies, laboratories, intellectual property lawyers, potential investors, and industry experts. Work outsourced or subcontracted will have a margin of 15% added, except for engineering and construction which involves initial cooperation.
O’Connor & Partners specializes in consulting for existing chemical manufacturers processing biomass for energy and chemicals, as well as new organizations developing or building a bio-refinery. Existing manufacturers are typically large global chemical corporations, while newer entities are smaller and embrace an entrepreneurial spirit. The company is open to working with any organization looking to accelerate the commercialization of bio-refining technologies.
Market Segmentation:
– Chemical Manufacturers: These corporations produce and sell commodity or specialty chemicals, fuels, polymers, and other materials. They are typically large, with annual sales ranging from several hundred million to several hundred billion dollars. Examples include DuPont, GE, Dow, 3M, Shell, BP, and ExxonMobil.
– Bio-refinery Start-ups: Examples of recent start-ups include Arkenol (2003), PureVision (2003), Alltech (2000), and Cargill Dow LLC (formation in 1997, full-scale bio-refinery in 2002). This category includes all start-ups over the planned period, not just those starting in a specific year. It is for companies without any current chemical operations.
– Agricultural: This sector primarily covers feedstock collection (farming, transportation, and storage), which is essential for bio-refining. It also includes farmer cooperatives in the Midwest that produce ethanol from corn.
– Utilities: Utility companies define a unique sector due to separate markets for electricity and power. Bio-refineries have the capability to generate electricity through combustion or biomass gasification. They can also produce clean H2 through partial oxidation and steam reforming of biomass. Ethanol can serve as a hydrogen reservoir for on-board H2 production in fuel-cell vehicles.
– Other: This category is for businesses with bio-refinery aspirations that don’t fall into an obvious sector.
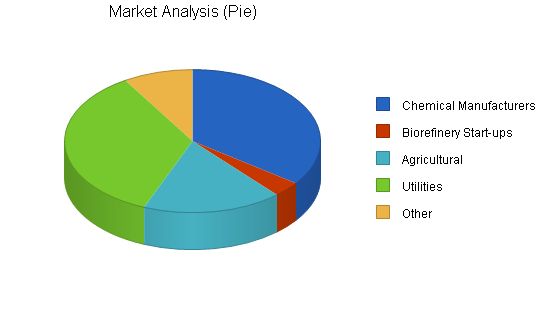
The figures in the Market Analysis table estimating the customer base for bio-refining consulting services are approximations and not based on research. The table does not provide a complete picture or estimate the market value of sectors but represents a wide range in revenue.
A pie chart illustrates the relative number of potential clients in each sector.
Growth estimates for chemical manufacturing and utilities are minimal (3%) to align with recent trends. However, even if the number of these companies do not increase significantly, their investment in industrial biotechnology may rise, presenting increased potential for O’Connor & Partners. A more aggressive assumption (50%) is made for start-ups due to the industry’s novelty.
4.1.1 Chemical Manufacturing
These companies use consultants and understand the value proposition of consulting. They need to understand how the bio-refinery fits into their businesses, defines new ones, and impacts long-term corporate goals like reduced dependence on feedstock imports. The issue is creating awareness of the need for a bio-refinery. They may publicly state their intention to pursue this path but need time and resources for research projects and confirmation. They recognize the importance of economic realities, market growth opportunities, available capital, and strategic decisions. Specific technical input from O’Connor & Partners will likely be required.
4.1.2 Biorefinery Start-ups
These companies recognize the potential of the bio-refinery and have justified their start-up. They need consulting to understand different potential product distribution based on specific process options. Some start-ups lack appropriate business training, while others lack technical experience. Even well-balanced start-up teams often need help managing complex projects initially.
4.1.3 Agricultural
An agricultural venture team may have practical experience but lack technical or management expertise in bio-refinery. This is an area where O’Connor & Partners can provide significant incremental benefit. Farmer groups processing corn into ethanol in Minnesota lack technical knowledge to operate at high efficiencies. For example, a Chinese group has a novel way to collect rice straw but cannot take advantage of opportunities in the bio-refinery-feedstock market. Proper consulting can help them move tons of rice straw daily to bio-refineries worldwide and compete in the furfural market.
4.1.4 Utilities
Utility companies need to view bio-refining from the historical perspective of traditional oil refineries and the chemical industry. For those using coal, natural gas, or nuclear fuel, supplying steam, electricity, and power to a bio-refinery is similar. However, utilities using biomass feedstocks for steam, electricity, or hydrogen generation will benefit from our consulting expertise.
| Market Analysis | |||||||
| Year 1 | Year 2 | Year 3 | Year 4 | Year 5 | |||
| Potential Customers | Growth | CAGR | |||||
| Chemical Manufacturers | 3% | 100 | 103 | 106 | 109 | 112 | 2.87% |
| Biorefinery Start-ups | 50% | 10 | 15 | 23 | 35 | 53 | 51.73% |
| Agricultural | 10% | 50 | 55 | 61 | 67 | 74 | 10.30% |
| Utilities | 3% | 100 | 103 | 106 | 109 | 112 | 2.87% |
| Other | 10% | 25 | 28 | 31 | 34 | 37 | 10.30% |
| Total | 8.02% | 285 | 304 | 327 | 354 | 388 | 8.02% |
4.2 Target Market Segment Strategy
The chemical manufacturers and utilities offer immediate business opportunities, so targeting them early makes sense. They may already have relationships with other firms but may be open to using O’Connor & Partners. Biorefinery start-ups and the agricultural sector are also important targets, and equity-pricing options can be explored. Cooperatives with dispersed ownership structures in the agricultural sector present significant opportunities.
4.3 Market Trends
The emergence of the bio-refining industry is driven by sustainability, paying attention to economic, environmental, and social aspects. Perceived benefits of bio-refineries include developing chemicals, fuels, and energy from renewable sources; increasing feedstock independence; promoting conservation, public health, and environmental well-being; diversifying markets for agricultural and forestry products; and creating jobs and enhancing rural economic development. These trends are closely linked to sustainability and the triple bottom line. Using renewable resources is essential for long-term sustainability as the cost of petroleum rises and biomass becomes more economically feasible. Biomass-sugar feedstocks offer lower costs compared to petroleum-derived commodities. Industrial biotechnology enables the production of specific products with high selectivity, opening up new markets.
4.4 Market Growth
The bio-refining industry, considered the "third wave of biotechnology," is estimated to impact about 20% of the worldwide chemical market by 2010. The growth to $280 billion/year will occur predominantly in bio-refinery start-ups, chemical manufacturing, and utilities. Industrial biotechnology is limited by the size and resources of research companies, and partnerships with chemical companies are crucial for biotech firms to succeed.
4.5 Competition and Buying Patterns
Potential reasons for choosing another consulting company over us include previous experience with another firm, higher perceived rates, disbelief in the need for consultants, and doubts about our expertise adding value to projects. While consulting firms’ viability is tied to economic conditions and specific industries, individual firm success varies widely. Word of mouth and reputation building are crucial.
4.6 Main Competitors
Well-known management-consulting firms: McKinsey, Bain, BCG, etc.
Strengths: International presence, general business understanding, and strong reputations.
Weaknesses: Limited specific expertise and higher fees.
Well-known technology-consulting firms: A.D. Little
Strengths: Specific technical knowledge and good relationships with potential clients.
Weaknesses: Limited expertise in all industries and reduced emphasis on business solutions.
Niche biotechnology consultants: CEA, Inc.
Strengths: Experience consulting in industrial applications of biotechnology and extensive network relationships.
Weaknesses: Lack of larger team expertise and sometimes vague mission.
Non-profit organizations: Rocky Mountain Institute
Strengths: Modest fees and experience consulting in industrial biotechnology.
Weaknesses: Limited understanding and one-time advising relationships.
No consulting: Companies doing the work in-house
Strengths: No incremental cost except travel and direct involvement of responsible team members.
Weaknesses: Limited resources and market development risks.
Strategic Value Proposition
O’Connor & Partners LLC offers a risk-free, variable-cost alternative for developing new chemical processes and products. We help companies seeking long-term sustainability and flexibility. Our services enhance their reach, positioning, and alliances while providing a healthy return on investment. We engage in confidential information gathering and initial contacts, extending a company’s presence and conversation opportunities.
5.1 Marketing Strategy
We aim to maintain a professional image, delivering high-value services while building comfortable relationships with clients. Word of mouth is important, and client satisfaction is crucial. Reputation building has already begun through past experiences associated with O’Connor & Partners.
5.1.1 Pricing Strategy
O’Connor & Partners is priced lower than prominent consulting firms but higher than individual consultants. We need to clearly explain the benefits of our high-level expertise and avoid dropping fees to gain clients. Compensation by equity building is evaluated carefully, and jobs may be turned down if they don’t align with our business model.
5.1.2 Promotion Strategy
We promote our firm through articles, presentations, trade shows, direct mail, email, and a strong online presence. Our reputation-building strategy includes media opportunities and leveraging existing relationships, with Cargill Dow as an initial client.
5.1.3 Marketing Programs
Marketing activities include network building, conference attendance, direct mailing of brochures, seminars, and continuous marketing efforts alongside client work.
5.1.4 Positioning Statement
O’Connor & Partners offers specialized expertise through an extensive network for companies entering the bio-refining industry. Our services are a variable, temporary expense compared to in-house teams and provide technical and market-entry solutions.
5.2 Sales Strategy
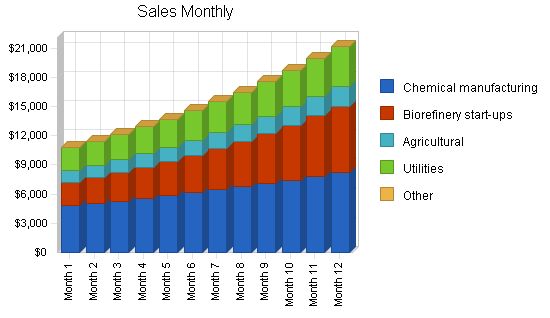
We prioritize the alignment between selling and fulfilling jobs to ensure client satisfaction. Sales forecast is based on moderate growth for most sectors and appreciable growth for start-ups. Venture efficiency and billable hours are carefully managed.
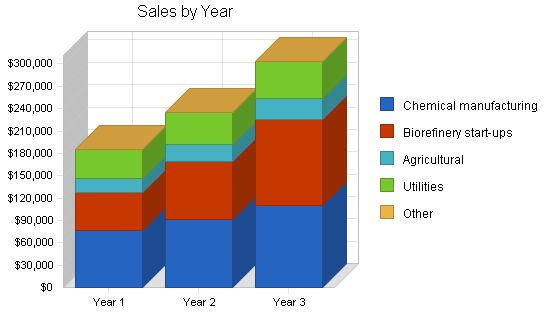
Sales Forecast:
Chemical manufacturing: $76,402 (Year 1), $91,683 (Year 2), $110,019 (Year 3)
Biorefinery start-ups: $51,322 (Year 1), $76,983 (Year 2), $115,475 (Year 3)
Agricultural: $19,101 (Year 1), $22,921 (Year 2), $27,505 (Year 3)
Utilities: $38,201 (Year 1), $43,931 (Year 2), $50,521 (Year 3)
Other: $0 (Year 1), $0 (Year 2), $0 (Year 3)
Total Sales: $185,026 (Year 1), $235,518 (Year 2), $303,520 (Year 3)
Direct Cost of Sales:
Supplies: $12,000 (Year 1), $12,600 (Year 2), $13,230 (Year 3)
Sales & Marketing: $6,000 (Year 1), $6,300 (Year 2), $6,615 (Year 3)
Interest & Depreciation: $6,000 (Year 1), $6,300 (Year 2), $6,615 (Year 3)
Overhead: $48,000 (Year 1), $52,800 (Year 2), $58,080 (Year 3)
Other: $0 (Year 1), $0 (Year 2), $0 (Year 3)
Subtotal Direct Cost of Sales: $72,000 (Year 1), $78,000 (Year 2), $84,540 (Year 3)
Management Summary:
The initial management team relies primarily on the founder. A Board of Advisors, consisting of investors and key members of the Affiliate Network, will assist in decision-making. The business is scalable, and the founder has potential recruits in mind who would be valuable additions to the firm. The organizational structure will include equal-level partners with junior-level associates reporting to them. Attracting top-quality management personnel should not be excessively difficult as the firm grows.
Personnel Plan:
In addition to the founding partner, Ryan O’Connor, an associate consultant and a secretary will be hired initially. As the firm grows, additional consultants, an accountant, a marketing person (including web design), and other staff professionals may be hired if necessary. Partners’ salaries will grow at a healthy annual rate, while other positions will see lower annual percentage growth. The base compensation for all partners will be the same, and a bonus system could be developed in the future.
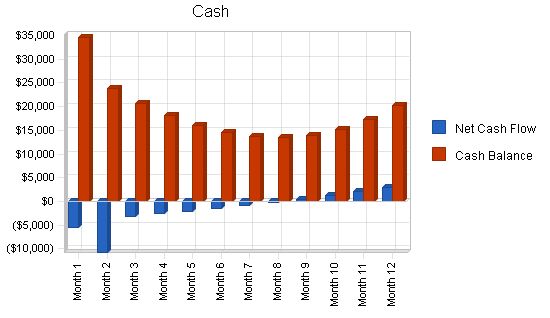
The initial cash balance is substantial after start-up expenses. The cash balance reaches its lowest point in the seventh month of operation but becomes positive in the eighth month. The net worth of the company is estimated to grow steadily through 2006. A dividend may need to be paid to equity investors at the end of 2006 if they choose to exit the venture.
Projected Profit and Loss:
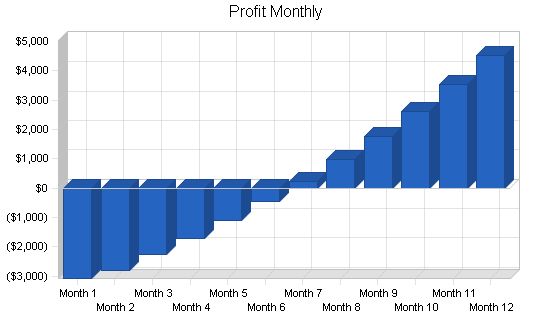
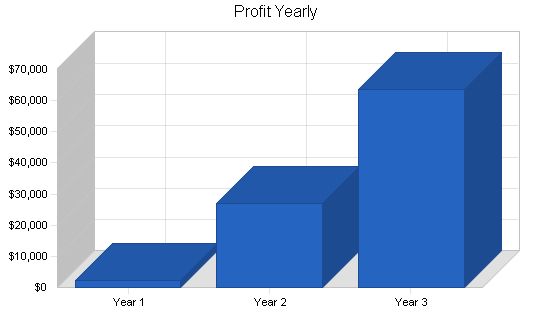
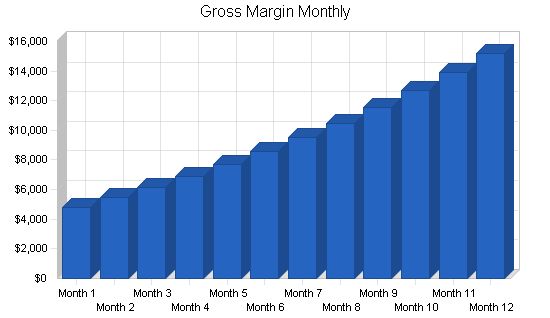
The gross margin is positive in the first month of operation, but there is a net loss. The first profitable month is in July 2004. As sales increase, the monthly gross margin improves through December 2004. Overall, the gross margin is good for the first year, but the net profit is meager. Profitability improves in year two and three as consulting sales continue to increase. The net profit over the three-year period is moderate. See the Appendix for the monthly profit-and-loss table for 2004.
Pro Forma Profit and Loss:
Year 1 Year 2 Year 3
Sales $185,026 $235,518 $303,520
Direct Cost of Sales $72,000 $78,000 $84,540
Other Costs of Sales $0 $0 $0
Total Cost of Sales $72,000 $78,000 $84,540
Gross Margin $113,026 $157,518 $218,980
Gross Margin % 61.09% 66.88% 72.15%
Expenses
Payroll $96,000 $105,600 $116,160
Sales and Marketing and Other Expenses $0 $0 $0
Depreciation $0 $0 $0
Rent $0 $0 $0
Utilities $0 $0 $0
Insurance $0 $0 $0
Payroll Taxes $14,400 $15,840 $17,424
Other $0 $0 $0
Total Operating Expenses $110,400 $121,440 $133,584
Profit Before Interest and Taxes $2,626 $36,078 $85,396
EBITDA $2,626 $36,078 $85,396
Interest Expense $0 $0 $0
Taxes Incurred $437 $9,020 $21,705
Other Income
Interest Income $0 $0 $0
Other Income Account Name $0 $0 $0
Total Other Income $0 $0 $0
Other Expense
Account Name $0 $0 $0
Other Expense Account Name $0 $0 $0
Total Other Expense $0 $0 $0
Net Other Income $0 $0 $0
Net Profit $2,190 $27,059 $63,691
Net Profit/Sales 1.18% 11.49% 20.98%
7.2 Important Assumptions
The financial plan depends on important assumptions, some of which are shown in the General Assumptions table as annual assumptions. Section 5.2 includes many of the sales-specific assumptions.
7.3 Break-even Analysis
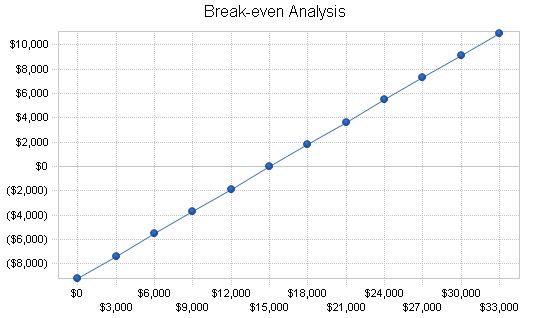
The following Break-even Analysis shows the break-even point for the business in necessary revenue. Neglecting outsourcing surcharges or other sources of revenue, 102 hours would need to be billed (if partner and associate hours were equal). This amount of consulting service represents 59% of the potential monthly billable hours.
Break-even Analysis
Monthly Revenue Break-even: $15,061
Assumptions:
– Average Percent Variable Cost: 39%
– Estimated Monthly Fixed Cost: $9,200
Projected Cash Flow
The annual cash flow is highlighted in the table below. The monthly numbers for 2004 are depicted in the Appendix. The net cash flow is worst (most negative) in February 2004 and becomes positive in September 2004. Overall, the net cash flow for 2004 is negative. However, the cash balance at the end of 2006 is respectable.
Pro Forma Cash Flow
| Cash Flow | |||
| Year 1 | Year 2 | Year 3 | |
| Cash Received | |||
| Operations | |||
| Cash Sales | $46,257 | $58,880 | $75,880 |
| Receivables | $108,426 | $168,358 | $216,488 |
| Total Cash from Operations | $154,682 | $227,237 | $292,368 |
| Additional Cash Received | |||
| Non-Operating Income | $0 | $0 | $0 |
| Sales Tax, VAT, HST/GST Received | $0 | $0 | $0 |
| Current Borrowing | $0 | $0 | $0 |
| Other Interest-free Liabilities | $0 | $0 | $0 |
| Long-term Liabilities | $0 | $0 | $0 |
| Sales of Other Current Assets | $0 | $0 | $0 |
| Sales of Long-term Assets | $0 | $0 | $0 |
| Investment Received | $0 | $0 | $0 |
| Total Cash Received | $154,682 | $227,237 | $292,368 |
7.5 Projected Balance Sheet
The pro forma balance sheet:
| Balance Sheet | |||
| Year 1 | Year 2 | Year 3 | |
| Assets | |||
| Current Assets | |||
| Cash | $20,259 | $39,078 | $93,327 |
| Accounts Receivable | $30,344 | $38,624 | $49,777 |
| Other Current Assets | $0 | $0 | $0 |
| Total Current Assets | $50,603 | $77,702 | $143,104 |
| Long-term Assets | |||
| Long-term Assets | $0 | $0 | $0 |
| Accumulated Depreciation | $0 | $0 | $0 |
| Total Long-term Assets | $0 | $0 | $0 |
| Total Assets | $50,603 | $77,702 | $143,104 |
| Liabilities and Capital | Year 1 | Year 2 | Year 3 |
| Current Liabilities | |||
| Accounts Payable | $8,413 | $8,454 | $10,165 |
| Current Borrowing | $0 | $0 | $0 |
| Other Current Liabilities | $0 | $0 | $0 |
| Total Current Liabilities | $8,413 | $8,454 | $10,165 |
| Long-term Liabilities | $0 | $0 | $0 |
| Total Liabilities | $8,413 | $8,454 | $10,165 |
| Paid-in Capital | $50,000 | $50,000 | $50,000 |
| Retained Earnings | ($10,000) | ($7,810) | $19,248 |
| Earnings | $2,190 | $27,059 | $63,691 |
| Total Capital | $42,190 | $69,248 | $132,939 |
| Total Liabilities and Capital | $50,603 | $77,702 | $143,104 |
| Net Worth | $42,190 | $69,248 | $132,939 |
7.6 Business Ratios
Comparison of industry ratios for the Process, Physical, Distribution and Logistics Consulting industry, NAICS code 541614, to the ratios calculated from the financial forecasts:
| Ratio Analysis | |||||||||||||
| Year 1 | Year 2 | Year 3 | Industry Profile | ||||||||||
| Sales Growth | 0.00% | 27.29% | 28.87% | 7.23% | |||||||||
| Percent of Total Assets | |||||||||||||
| Accounts Receivable | 59.96% | 49.71% | 34.78% | 19.36% | |||||||||
| Other Current Assets | 0.00% | 0.00% | 0.00% | 50.02% | |||||||||
| Total Current Assets | 100.00% | 100.00% | 100.00% | 70.95% | |||||||||
| Long-term Assets | |||||||||||||
| Total Long-term Assets | 0.00% | 0.00% | 0.00% | 29.05% | |||||||||
| Total Assets | 100.00% | 100.00% | 100.00% | 100.00% | |||||||||
| Current Liabilities | |||||||||||||
| Accounts Payable | 8.413% | 8.454% | 10.165% | 33.87% | |||||||||
| Long-term Liabilities | 0.00% | 0.00% | 0.00% | 15.64% | |||||||||
| Total Liabilities | 8.413% | 8.454% | 10.165% | 49.51% | |||||||||
| Net Worth | 83.37% | 89.12% | 92.90% | 50.49% | |||||||||
| Percent of Sales | |||||||||||||
| Sales | 100.00% | 100.00% | 100.00% | 100.00% | |||||||||
| Gross Margin | 61.09% | 66.88% | 72.15% | 24.27% | |||||||||
| Selling, General & Administrative Expenses | 60.02% | 55.39% | 51.05% | 11.90% | |||||||||
| Advertising Expenses | 0.00% | 0.00% | 0.00% | 0.57% | |||||||||
| Profit Before Interest and Taxes | 1.42% | 15.32% | 28.14% | 0.87% | |||||||||
| Main Ratios | |||||||||||||
| Current | 6.01 | 9.19 | 14.08 | 1.61 | |||||||||
| Quick | 6.01 | 9.19 | 14.08 | 1.32 | |||||||||
| Total Debt to Total Assets | 16.63% | 10.88% | 7.10% | 56.90% | |||||||||
| Pre-tax Return on Net Worth | 6.22% | 52.10% | 64.24% | 2.84% | |||||||||
| Pre-tax Return on Assets | 5.19% | 46.43% | 59.67% | 6.59% | |||||||||
| Additional Ratios | Year 1 | Year 2 | Year 3 | ||||||||||
| Net Profit Margin | 1.18% | 11.49% | 20.98% | n.a | |||||||||
| Return on Equity | 5.19% | 39.07% | 47.91% | n.a | |||||||||
| Activity Ratios | |||||||||||||
| Accounts Receivable Turnover | 4.57 | 4.57 | 4.57 | n.a | |||||||||
| Collection Days | 56 | 71 | 71 | n.a | |||||||||
| Accounts Payable Turnover | 10.32 | 12.17 | 12.17 | n.a | |||||||||
| Payment Days | 27 | 30 | 27 | n.a | |||||||||
| Total Asset Turnover | 3.66 | 3.03 | 2.12 | n.a | |||||||||
| Personnel Plan | |||||||||||||
| Month 1 | Month 2 | Month 3 | Month 4 | Month 5 | Month 6 | Month 7 | Month 8 | Month 9 | Month 10 | Month 11 | Month 12 | ||
| Ryan O’Connor | $8,000 | $8,000 | $8,000 | $8,000 | $8,000 | $8,000 | $8,000 | $8,000 | $8,000 | $8,000 | $8,000 | $8,000 | |
| Other | $0 | $0 | $0 | $0 | $0 | $0 | $0 | $0 | $0 | $0 | $0 | $0 | |
| Total People | 0 | 0 | 0 | 0 | 0 | 0 | 0 | 0 | 0 | 0 | 0 | 0 | |
| Total Payroll | $8,000 | $8,000 | $8,000 | $8,000 | $8,000 | $8,000 | $8,000 | $8,000 | $8,000 | $8,000 | $8,000 | $8,000 | |
| General Assumptions | |||||||||||||
| Month 1 | Month 2 | Month 3 | Month 4 | Month 5 | Month 6 | Month 7 | Month 8 | Month 9 | Month 10 | Month 11 | Month 12 | ||
| Plan Month | 1 | 2 | 3 | 4 | 5 | 6 | 7 | 8 | 9 | 10 | 11 | 12 | |
| Current Interest Rate | 7.00% | 7.00% | 7.00% | 7.00% | 7.00% | 7.00% | 7.00% | 7.00% | 7.00% | 7.00% | 7.00% | 7.00% | |
| Long-term Interest Rate | 6.00% | 6.00% | 6.00% | 6.00% | 6.00% | 6.00% | 6.00% | 6.00% | 6.00% | 6.00% | 6.00% | 6.00% | |
| Tax Rate | 30.00% | 25.00% | 25.00% | 25.00% | 25.00% | 25.00% | 25.00% | 25.00% | 25.00% | 25.00% | 25.00% | 25.00% | |
| Other | 0 | 0 | 0 | 0 | 0 | 0 | 0 | 0 | 0 | 0 | 0 | 0 | |
| Pro Forma Profit and Loss | |||||||||||||
| Month 1 | Month 2 | Month 3 | Month 4 | Month 5 | Month 6 | Month 7 | Month 8 | Month 9 | Month 10 | Month 11 | Month 12 | ||
| Sales | $10,800 | $11,460 | $12,165 | $12,918 | $13,724 | $14,586 | $15,509 | $16,497 | $17,555 | $18,690 | $19,908 | $21,214 | |
| Direct Cost of Sales | $6,000 | $6,000 | $6,000 | $6,000 | $6,000 | $6,000 | $6,000 | $6,000 | $6,000 | $6,000 | $6,000 | $6,000 | |
| Other Costs of Sales | $0 | $0 | $0 | $0 | $0 | $0 | $0 | $0 | $0 | $0 | $0 | $0 | |
| Total Cost of Sales | $6,000 | $6,000 | $6,000 | $6,000 | $6,000 | $6,000 | $6,000 | $6,000 | $6,000 | $6,000 | $6,000 | $6,000 | |
| Gross Margin | $4,800 | $5,460 | $6,165 | $6,918 | $7,724 | $8,586 | $9,509 | $10,497 | $11,555 | $12,690 | $13,908 | $15,214 | |
| Gross Margin % | 44.44% | 47.64% | 50.68% | 53.55% | 56.28% | 58.86% | 61.31% | 63.63% | 65.82% | 67.90% | 69.86% | 71.72% | |
| Expenses | |||||||||||||
| Payroll | $8,000 | $8,000 | $8,000 | $8,000 | $8,000 | $8,000 | $8,000 | $8,000 | $8,000 | $8,000 | $8,000 | $8,000 | |
| Sales and Marketing and Other Expenses | $0 | $0 | $0 | $0 | $0 | $0 | $0 | $0 | $0 | $0 | $0 | $0 | |
| Depreciation | $0 | $0 | $0 | $0 | $0 | $0 | $0 | $0 | $0 | $0 | $0 | $0 | |
| Rent | $0 | $0 | $0 | $0 | $0 | $0 | $0 | $0 | $0 | $0 | $0 | $0 | |
| Utilities | $0 | $0 |
Cash Received: – Cash from Operations: – Cash Sales: – Month 1: $2,700 – Month 2: $2,865 – Month 3: $3,041 – Month 4: $3,230 – Month 5: $3,431 – Month 6: $3,646 – Month 7: $3,877 – Month 8: $4,124 – Month 9: $4,389 – Month 10: $4,673 – Month 11: $4,977 – Month 12: $5,304 – Cash from Receivables: – Month 2: $270 – Month 3: $8,117 – Month 4: $8,613 – Month 5: $9,143 – Month 6: $9,709 – Month 7: $10,315 – Month 8: $10,963 – Month 9: $11,656 – Month 10: $12,399 – Month 11: $13,195 – Month 12: $14,048 – Subtotal Cash from Operations: – Month 1: $2,700 – Month 2: $3,135 – Month 3: $11,158 – Month 4: $11,842 – Month 5: $12,574 – Month 6: $13,355 – Month 7: $14,192 – Month 8: $15,087 – Month 9: $16,045 – Month 10: $17,071 – Month 11: $18,172 – Month 12: $19,352 Additional Cash Received: – Non Operating (Other) Income: $0 – Sales Tax, VAT, HST/GST Received: $0 – New Current Borrowing: $0 – New Other Liabilities (interest-free): $0 – New Long-term Liabilities: $0 – Sales of Other Current Assets: $0 – Sales of Long-term Assets: $0 – New Investment Received: $0 – Subtotal Cash Received: – Month 1: $2,700 – Month 2: $3,135 – Month 3: $11,158 – Month 4: $11,842 – Month 5: $12,574 – Month 6: $13,355 – Month 7: $14,192 – Month 8: $15,087 – Month 9: $16,045 – Month 10: $17,071 – Month 11: $18,172 – Month 12: $19,352 Expenditures: – Expenditures from Operations: – Cash Spending: – Month 1: $8,000 – Month 2: $8,000 – Month 3: $8,000 – Month 4: $8,000 – Month 5: $8,000 – Month 6: $8,000 – Month 7: $8,000 – Month 8: $8,000 – Month 9: $8,000 – Month 10: $8,000 – Month 11: $8,000 – Month 12: $8,000 – Bill Payments: – Month 1: $196 – Month 2: $5,893 – Month 3: $6,271 – Month 4: $6,448 – Month 5: $6,636 – Month 6: $6,838 – Month 7: $7,054 – Month 8: $7,285 – Month 9: $7,533 – Month 10: $7,798 – Month 11: $8,083 – Month 12: $8,388 – Subtotal Spent on Operations: – Month 1: $8,196 – Month 2: $13,893 – Month 3: $14,271 – Month 4: $14,448 – Month 5: $14,636 – Month 6: $14,838 – Month 7: $15,054 – Month 8: $15,285 – Month 9: $15,533 – Month 10: $15,798 – Month 11: $16,083 – Month 12: $16,388 Additional Cash Spent: – Non Operating (Other) Expense: $0 – Sales Tax, VAT, HST/GST Paid Out: $0 – Principal Repayment of Current Borrowing: $0 – Other Liabilities Principal Repayment: $0 – Long-term Liabilities Principal Repayment: $0 – Purchase Other Current Assets: $0 – Purchase Long-term Assets: $0 – Dividends: $0 – Subtotal Cash Spent: – Month 1: $8,196 – Month 2: $13,893 – Month 3: $14,271 – Month 4: $14,448 – Month 5: $14,636 – Month 6: $14,838 – Month 7: $15,054 – Month 8: $15,285 – Month 9: $15,533 – Month 10: $15,798 – Month 11: $16,083 – Month 12: $16,388 Net Cash Flow: – Month 1: ($5,496) – Month 2: ($10,758) – Month 3: ($3,113) – Month 4: ($2,605) – Month 5: ($2,063) – Month 6: ($1,483) – Month 7: ($862) – Month 8: ($199) – Month 9: $512 – Month 10: $1,273 – Month 11: $2,089 – Month 12: $2,964 Cash Balance: – Month 1: $34,504 – Month 2: $23,746 – Month 3: $20,633 – Month 4: $18,028 – Month 5: $15,965 – Month 6: $14,482 – Month 7: $13,620 – Month 8: $13,421 – Month 9: $13,933 – Month 10: $15,206 – Month 11: $17,295 – Month 12: $20,259 Pro forma balance sheet: [table] [tr] [td]Pro Forma Balance Sheet[/td] [/tr] [tr] [td]Month 1[/td] [td]Month 2[/td] [td]Month 3[/td] [td]Month 4[/td] [td]Month 5[/td] [td]Month 6[/td] [td]Month 7[/td] [td]Month 8[/td] [td]Month 9[/td] [td]Month 10[/td] [td]Month 11[/td] [td]Month 12[/td] [/tr] [tr] [td]Assets[/td] [td]Starting Balances[/td] [/tr] [tr] [td]Cash[/td] [td]$40,000[/td] [td]$34,504[/td] [td]$23,746[/td] [td]$20,633[/td] [td]$18,028[/td] [td]$15,965[/td] [td]$14,482[/td] [td]$13,620[/td] [td]$13,421[/td] [td]$13,933[/td] [td]$15,206[/td] [td]$17,295[/td] [td]$20,259[/td] [/tr] [tr] [td]Accounts Receivable[/td] [td]$0[/td] [td]$8,100[/td] [td]$16,425[/td] [td]$17,432[/td] [td]$18,508[/td] [td]$19,659[/td] [td]$20,889[/td] [td]$22,206[/td] [td]$23,616[/td] [td]$25,126[/td] [td]$26,745[/td] [td]$28,481[/td] [td]$30,344[/td] [/tr] [tr] [td]Other Current Assets[/td] [td]$0[/td] [td]$0[/td] [td]$0[/td] [td]$0[/td] [td]$0[/td] [td]$0[/td] [td]$0[/td] [td]$0[/td] [td]$0[/td] [td]$0[/td] [td]$0[/td] [td]$0[/td] [td]$0[/td] [/tr] [tr] [td]Total Current Assets[/td] [td]$40,000[/td] [td]$42,604[/td] [td]$40,171[/td] [td]$38,065[/td] [td]$36,536[/td] [td]$35,624[/td] [td]$35,372[/td] [td]$35,826[/td] [td]$37,037[/td] [td]$39,060[/td] [td]$41,952[/td] [td]$45,777[/td] [td]$50,603[/td] [/tr] [tr] [td]Long-term Assets[/td] [/tr] [tr] [td]Long-term Assets[/td] [td]$0[/td] [td]$0[/td] [td]$0[/td] [td]$0[/td] [td]$0[/td] [td]$0[/td] [td]$0[/td] [td]$0[/td] [td]$0[/td] [td]$0[/td] [td]$0[/td] [td]$0[/td] [td]$0[/td] [/tr] [tr] [td]Accumulated Depreciation[/td] [td]$0[/td] [td]$0[/td] [td]$0[/td] [td]$0[/td] [td]$0[/td] [td]$0[/td] [td]$0[/td] [td]$0[/td] [td]$0[/td] [td]$0[/td] [td]$0[/td] [td]$0[/td] [td]$0[/td] [/tr] [tr] [td]Total Long-term Assets[/td] [td]$0[/td] [td]$0[/td] [td]$0[/td] [td]$0[/td] [td]$0[/td] [td]$0[/td] [td]$0[/td] [td]$0[/td] [td]$0[/td] [td]$0[/td] [td]$0[/td] [td]$0[/td] [td]$0[/td] [/tr] [tr] [td]Total Assets[/td] [td]$40,000[/td] [td]$42,604[/td] [td]$40,171[/td] [td]$38,065[/td] [td]$36,536[/td] [td]$35,624[/td] [td]$35,372[/td] [td]$35,826[/td] [td]$37,037[/td] [td]$39,060[/td] [td]$41,952[/td] [td]$45,777[/td] [td]$50,603[/td] [/tr] [/table] Liabilities and Capital: [table] [tr] [td]Liabilities and Capital[/td] [/tr] [tr] [td]Month 1[/td] [td]Month 2[/td] [td]Month 3[/td] [td]Month 4[/td] [td]Month 5[/td] [td]Month 6[/td] [td]Month 7[/td] [td]Month 8[/td] [td]Month 9[/td] [td]Month 10[/td] [td]Month 11[/td] [td]Month 12[/td] [/tr] [tr] [td]Current Liabilities[/td] [/tr] [tr] [td]Accounts Payable[/td] [td]$0[/td] [td]$5,684[/td] [td]$6,056[/td] [td]$6,227[/td] [td]$6,409[/td] [td]$6,603[/td] [td]$6,812[/td] [td]$7,035[/td] [td]$7,273[/td] [td]$7,529[/td] [td]$7,803[/td] [td]$8,098[/td] [td]$8,413[/td] [/tr] [tr] [td]Current Borrowing[/td] [td]$0[/td] [td]$0[/td] [td>$0[/td> [td]$0[/td] [td]$0[/td> [td]$0[/td> [td]$0[/td> [td>$0[/td> [td]$0[/td> [td]$0[/td> [td]$0[/td> [td]$0[/td> [/tr] [tr] [td]Other Current Liabilities[/td] [td]$0[/td> [td]$0[/td> [td]$0[/td> [td]$0[/td> [td]$0[/td> [td]$0[/td> [td]$0[/td> [td]$0[/td> [td]$0[/td> [td]$0[/td> [td]$0[/td> [td]$0[/td> [td]$0[/td] [/tr] [tr] [td]Subtotal Current Liabilities[/td] [td>$0[/td> [td]$5,684[/td> [td>$6,056[/td> [td]$6,227[/td> [td]$6,409[/td> [td]$6,603[/td> [td]$6,812[/td> [td]$7,035[/td> [td]$7,273[/td> [td]$7,529[/td> [td]$7,803[/td> [td]$8,098[/td> [td]$8,413[/td] [/tr] [tr] [td]Long-term Liabilities[/td> [td]$0[/td> [td]$0[/td> [td]$0[/td> [td]$0[/td> [td]$0[/td> [td]$0[/td> [td>$0[/td> [td]$0[/td> [td]$0[/td> [td]$0[/td> [td]$0[/td> [td]$0[/td] [td]>$0[/td> [/tr] [tr] [td]Total Liabilities[/td> [td]$0[/td> [td]$5,684[/td> [td]$6,056[/td> [td]$6,227[/td> [td]$6,409[/td> [td]$6,603[/td> [td]$6,812[/td> [td]$7,035[/td> [td]$7,273[/td> [td]$7,529[/td> [td]$7,803[/td> [td]$8,098[/td> [td]$8,413[/td] [/tr] [tr] [td]Paid-in Capital[/td> [td]$50,000[/td> [td]$50,000[/td> [td]$50,000[/td> [td]$50,000[/td> [td]$50,000[/td> [td]$50,000[/td> [td]$50,000[/td> [td]$50,000[/td> [td]$50,000[/td> [td]$50,000[/td> [td]$50,000[/td> [td]$50,000[/td> [td]$50,000[/td] [/tr] [tr] [td]Retained Earnings[/td> [td]($10,000)[/td] [td]($10,000)[/td> [td]($10,000)[/td> [td]($10,000)[/td> [td]($10,000)[/td> [td]($10,000)[/td> [td](10,000)[/td> [td]($10,000)[/td> [td]($10,000)[/td> [td]($10,000)[/td> [td]($10,000)[/td> [td]($10,000)[/td> [td]($10,000)[/td] [/tr] [tr] [td]Earnings[/td> [td]$0[/td> [td]($3,080)[/td> [td]($5,885)[/td> [td]($8,161)[/td> [td]($9,872)[/td> [td]($10,979)[/td> [td]($11,440)[/td> [td]($11,208)[/td> [td]($10,236)[/td> [td]($8,470)[/td> [td]($5,852)[/td> [td]($2,321)[/td> [td]$2,190[/td] [/tr] [tr] [td]Total Capital[/td> [td]$40,000[/td> [td]$36,920[/td> [td]$34,115[/td> [td]$31,839[/td> [td]$30,128[/td> [td]$29,021[/td> [td]$28,560[/td> [td]$28,792[/td> [td]$29,764[/td> [td]$31,530[/td> [td]$34,148[/td> [td]$37,679[/td> [td]$42,190[/td] [/tr] [tr] [td]Total Liabilities and Capital[/td> [td]$40,000[/td> [td]$42,604[/td> [td]$40,171[/td> [td]$38,065[/td> [td]$36,536[/td> [td]$35,624[/td> [td]$35,372[/td> [td]$35,826[/td> [td]$37,037[/td> [td]$39,060[/td> [td]$41,952[/td> [td]$45,777[/td> [td]$50,603[/td] [/tr] [tr] [td]Net Worth[/td> [td]$40,000[/td> [td]$36,920[/td> [td]$34,115[/td> [td]$31,839[/td> [td]$30,128[/td> [td>$29,021[/td> [td]$28,560[/td> [td]$28,792[/td> [td]$29,764[/td> [td]$31,530[/td> [td]>$34,148[/td> [td]$37,679[/td> [td]$42,190[/td] [/tr] [/table]
Business Plan Outline
|
||||||||||
Hello!
I’m Andrew Brooks, a seasoned finance consultant from the USA and the mind behind phonenumber247.com.
My career is built on a foundation of helping individuals and businesses thrive financially in an ever-changing economic landscape. At phonenumber247.com, my aim is to demystify the complex world of finance, providing clear, actionable advice that can help you navigate your financial journey with confidence. Whether it’s personal finance management, investment strategies, or understanding the nuances of market dynamics, I’m here to share insights and tools that can propel you towards your financial goals.
Welcome to my digital space, where every piece of advice is a step closer to financial clarity and success!

