Management Consulting Business Plan:
Coaching Company offers high-quality professional development and coaching services. The principal officer believes small businesses and entrepreneurs face two main problems: a lack of training and the depth of knowledge needed to focus on their businesses. Both problems lead to lowered expectations, limited growth, and burnout. Coaching Company aims to exploit these weaknesses and gain local market share.
The objectives for Coaching Company in the next three years are:
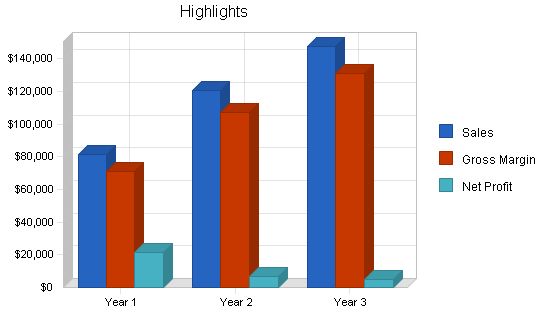
– Achieve sales revenues of $81,000 by year one.
– Achieve sales revenues of $150,000 by year three.
– Attain a client mix of 60% small businesses, 30% entrepreneurs, and 10% individuals annually.
– Move into a small office space by the end of the first year.
Coaching Company will provide its professional development services effectively, with a comprehensive quality-control program to ensure 100% client satisfaction. The company views each contract as a long-term, mutually beneficial partnership, leading to greater profits through referrals and repeat business.
To reach its goals, Coaching Company will implement the following key procedures:
– Create a unique and upscale environment that differentiates Coaching Company from other coaching businesses.
– Educate the business community on the benefits of business and strategic coaching.
– Establish a learning environment that brings together people with diverse backgrounds to overcome challenges.
– Provide affordable access to business coaching and other consulting resources.
Coaching Company is a start-up limited liability company (LLC) with one principal officer who has 15 years of industry experience. The company will collaborate with the national franchise, Coaching Company®, to deliver services. Initially, Coaching Company will operate from a home office in Anytown, MI, and use workshop facilities from professional venues.
The company plans to utilize its existing contacts and customer base to secure both short and long-term coaching contracts. Long-term profitability will depend on professional contracts secured through strategic alliances, a comprehensive marketing program, and a successful referral program.
Initially, Coaching Company will focus on professional development, strategic workshops, one-on-one coaching, and special project relationships. From year two onwards, the company will provide comprehensive career counseling services, including resume assistance, interviewing skills, job-seeking strategies, and networking opportunities. The company has carefully examined its financial projections, ensuring conservatism in profits and generosity in expenditures to account for unforeseen events. Cash flow projections are deemed realistic by the principal officer.
Coaching Company’s objectives for the first three years of operation are:
1. Create a unique, upscale, innovative environment that differentiates Coaching Company from other coaching or professional development businesses.
2. Educate the business community on the benefits of business and strategic coaching.
3. Form a learning environment that brings people with diverse interests and backgrounds together to overcome challenges, both professionally and personally.
4. Provide affordable access to business coaching and other development services.
The financial objectives for Coaching Company over the next three years are:
1. Achieve sales revenues of approximately $81,000 by the end of year one.
2. Achieve sales revenues of approximately $150,000 by year three.
3. Achieve a client mix of 60% small business/30% entrepreneurial/10% individual per year.
4. Move into small office space by the end of the first year.
5. Hire one salesperson/coach by the end of the second year.
Coaching Company offers reliable, high-quality business coaching, professional development, and management development to small business owners, managers, and entrepreneurs on both a local and national scale. Its mission is to help clients succeed in their business and personal lives by developing strategy, motivation, and accountability. Each contract is seen as a partnership to create a long-term, mutually beneficial relationship that generates referrals and repeat business. The company maintains financial balance by charging high value for its services and providing even higher value to its clients.
The keys to success for Coaching Company are:
1. Excellence in fulfilling the promise through completely confidential, reliable, trustworthy expertise and information.
2. Developing visibility to generate new business leads.
3. Leveraging expertise into multiple revenue generation opportunities, such as retainer coaching, project consulting, workshop facilitation, and individual coaching.
4. Consistently providing thought-provoking learning experiences to maintain growth and success with each client.
5. Utilizing state-of-the-art technology.
6. Providing easy access to services.
7. Establishing a seasoned advisory team.
Coaching Company, owned and operated by Frank Smith, is a start-up limited liability company. Mr. Smith has 15 years of industry experience in sales, professional development training, and business operations. The company was formed to address the perceived weaknesses of existing professional development opportunities in terms of quality and client satisfaction. Coaching Company will be located in a home office in Anytown, MI, and will use its existing contacts and customer base to generate coaching contracts. Long-term profitability will be achieved through strategic alliances, a comprehensive marketing program, and a successful referral program.
The True Group LLC is a privately owned limited liability company owned by Frank Smith.
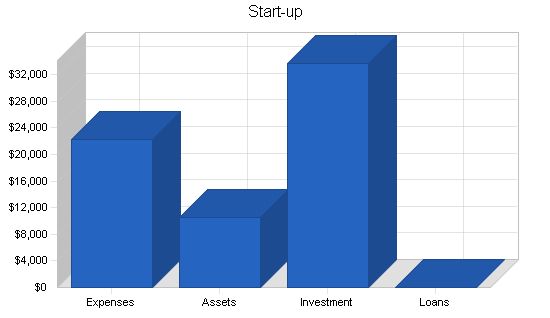
Total start-up expenses, including legal costs, logo design, stationery, franchise fee, and other related expenses, amount to $22,250. Start-up assets required include $2,500 in short-term assets (office furniture, etc.) and $8,000 in initial cash to cover the first few months of operations.
Start-up
Requirements
Start-up Expenses
– Legal: $1,000
– Stationery etc.: $450
– Insurance: $1,000
– Rent: $0
– Computer: $1,200
– Franchise Fee: $17,900
– Phone: $200
– Travel: $500
– Other: $0
– Total Start-up Expenses: $22,250
Start-up Assets
– Cash Required: $8,000
– Other Current Assets: $2,500
– Long-term Assets: $0
– Total Assets: $10,500
Total Requirements: $32,750
Services
Coaching Company provides strategic coaching, professional development, and counseling for small business owners, entrepreneurs, and self-employed professionals. The core services offered from day one are:
1. Two Year Strategic mindset Program: quarterly workshops including strategic planning, peer advisory counseling, marketing/sales planning, accountability processes, business planning, and work/life balance implementation.
2. One-on-One Coaching: ongoing reinforcement to support Strategic Coaching program, professional development coaching, leadership, career, or management coaching.
3. On Demand Coaching (for time restricted clients): private and objective business or professional coaching, affordable and “on-demand,” access to coaching via phone/email.
4. Special Projects: strategic business planning and implementation, marketing plans and implementation, leadership development, people management, and systematizing businesses.
Beginning in year two (2006), Coaching Company will provide a separate and comprehensive career counseling service including resumé assistance, interviewing skills, job seeking strategies, and networking opportunities.
Market Analysis Summary
Coaching Company will focus on small business owners, managers, and entrepreneurs who are concerned that their businesses have not grown at the desired rate, frustrated by excessive time spent in their businesses and potential burnout, and worried about their business’s survival without them. These companies will have revenues of $10 million or less.
According to the July 2002 census, there are approximately 81,600 small businesses in the 5-county Anytown Metropolitan area. While most are manufacturing-based, there are also a significant number of service-related companies. Coaching Company will position itself as a leadership and development expert rather than an industry expert, thus industry will not impact prospective markets.
Market Segmentation
Coaching Company will focus on two markets within the Anytown Metro area: the small business segment (businesses with more than one employee/owner) and the entrepreneur segment, including home-based and one-person business operations. The company can handle larger organizations, but the greatest benefit will come to businesses with under $10 million in annual sales. These companies often lack dedicated in-house staff for strategic planning, professional development, and coaching. Our goal is to eventually obtain about two-thirds of our business from the small business segment, as it generates the greatest cash flow and has the lowest percentage of variable costs. The small business segment is considered the company’s cash cow.
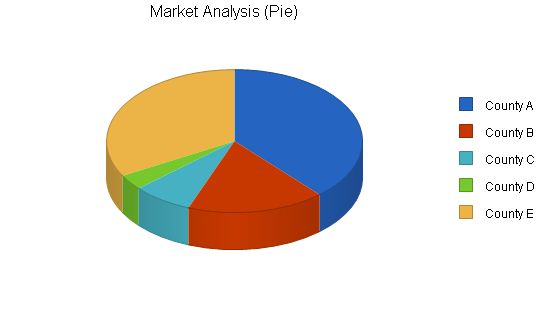
Initially, the company will focus on the two segments in A County and B County. However, by the end of the three-year projections, the company expects to serve the entire Anytown Metropolitan area. The Market Analysis table and chart show the number of small businesses in each county.
Market Analysis
Potential Customers Growth CAGR
County A 3% 31,424 32,367 33,338 34,338 35,368 3.00%
County B 2% 14,130 14,413 14,701 14,995 15,295 2.00%
County C 3% 6,189 6,375 6,566 6,763 6,966 3.00%
County D 2% 2,849 2,906 2,964 3,023 3,083 1.99%
County E 2% 27,008 27,548 28,099 28,661 29,234 2.00%
Total 2.46% 81,600 83,609 85,668 87,780 89,946 2.46%
4.2 Target Market Segment Strategy
The small business and entrepreneur markets are ideal targets for several reasons. As small or entrepreneurial businesses, resources are often limited to core functions such as production, administration, finance, and distribution. Professional development, training, coaching, or planning frequently goes unnoticed or forgotten. These companies are always looking for effective ways to make themselves more prosperous.
4.3 Service Business Analysis
The United States spends more per capita on education than any other country. Training or professional development in America is a $210+ billion industry. There are five basic groups that need training:
Government – Those employed in federal, state, and local governments, the military, post office personnel, school teachers, and administrators. This group spends over $23 billion on training annually.
4.3.1 Competition and Buying Patterns
The key element in purchase decisions made at Coaching Company client level is trust in the professional reputation and reliability of the firm. The professional development industry is disorganized, with thousands of smaller consulting organizations and individual consultants for every well-known company. Competitors range from major international consulting firms to tens of thousands of individuals. Coaching Company’s challenge will be establishing itself as a real professional development company, positioned as a relatively risk-free corporate purchase.
When dealing with the small or entrepreneurial business market, cost or price will be one of the greatest obstacles Coaching Company will face. It will be up to Coaching Company to assist its clients in discovering how much it may cost them NOT to pursue professional development and establish Coaching Company as the most effective solution to their challenges. Reputation and referrals will allow for a steady stream of new clients and regular price increases. This is a business to build reliability.
Strategy and Implementation Summary
Emphasize results. Differentiate ourselves with results. Establish our business offering as a clear and viable alternative for our target market, from unrefined, one-time seminar, consulting, and “feel good motivational” companies.
Build a relationship-oriented business. Build long-term relationships with clients, not single-visit deals. Become their advisor and partner of choice. Make them understand the value of long-term relationships.
Focus on target markets. Focus our offerings on small business owners and entrepreneurs who have a passion for their business and the willingness to work for what they receive. Do not compete for buyers seeking “get rich quick” resources. Sell to smart, quality-conscious clients.
5.1 Competitive Edge
The most unique benefit that Coaching Company offers to clients is the ability to experience ongoing development, versus a typical “one-time” seminar format. Coaching Company provides development and support for a year or more. Since each Strategic Workshop client will be immediately qualified for one-on-one coaching, we will monitor the specific progress of each client to ensure appropriate development.
Coaching Company plans to reach their target companies by four effective methods:
Lead Generation Program: Direct mailing to 3,000 potential customers in the A and B county areas. Interested companies reply by mail or phone. An average of 3% of recipients typically respond.
Sample Previews: Invitation-only workshops hosted for referral sources and target market businesses. The previews will be the actual first-year program offered to paying clients. The intention is to provide value and proof of the Strategic Workshop process to generate referrals.
Free Talks/Networking: Talks given to Chambers of Commerce, trade councils, professional organizations, etc. At least two talks and two networking events per month.
Referrals: Referrals will become a larger part of Coaching Company’s business in the second and third year, accounting for up to 50% of new business.
Other Income Generators: Special project assistance, including writing private programs for specific businesses, designing custom programs, and retainer-based coaching.
5.3 Sales Strategy
Coaching Company will make a significant profit through the delivery of top-of-the-line professional development services. The company will see profit within the first year due to word-of-mouth advertising and referral networking. The company expects to double its clientele every six months for the first 18 months.
Pricing
Strategic Workshops (two-year program) – $3000 for year one, $2500 for year two. Includes 1 hour per month of one-on-one coaching.
Platinum Package – $5000 for one year of Strategic Workshops, 1 hour per month of one-on-one coaching, and membership to the On Demand Coaching.
Gold Package – $4000 for one year of Strategic Workshops, 1 hour per month of one-on-one coaching.
Silver Package – $3000 for one year of Strategic Workshops.
Second year – $2500 per year for any client continuing with Strategic Workshops (applies to workshop only).
One-on-one Coaching – $125/hr for personalized coaching for non-workshop clients, $100/hr for workshop clients.
On Demand Coaching – $250 per month with a minimum purchase of 3 months.
Special Projects – Priced as needed.
5.3.1 Sales Forecast
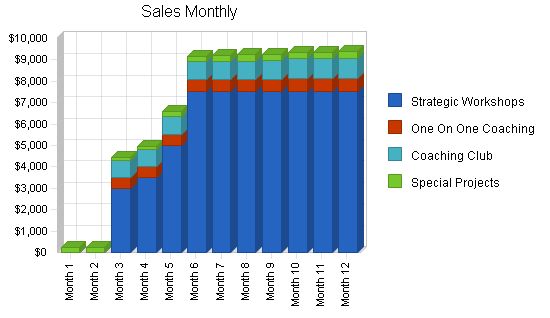
Coaching Company expects a slow start to 2005 but a strong finish with referral marketing replacing hard marketing dollars. The core business will be the Strategic Workshops, with a second year tied to the initial purchase. Based on this, we should be able to obtain and manage a 25% increase in sales. Sales exceeding 25% would place a burden on service delivery. Consistent efforts based on the marketing plan will drive enough opportunities for growth. By year four, Coaching Company will be in a position to hire one more salesperson.
Potential obstacles to achieving these results:
1. Prospecting/marketing plan not followed
2. Poor delivery of service
3. Any health problems of the owner.
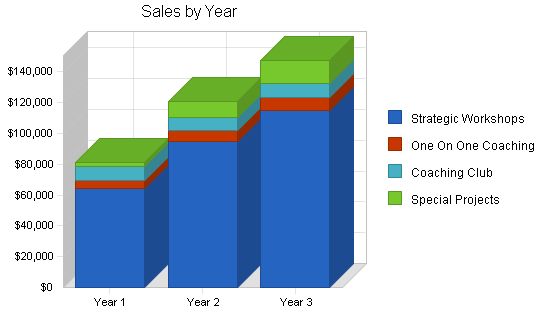
| Sales Forecast | |||
| Year 1 | Year 2 | Year 3 | |
| Sales | |||
| Strategic Workshops | $64,000 | $95,000 | $115,000 |
| One On One Coaching | $5,622 | $6,844 | $8,555 |
| Coaching Club | $8,760 | $8,760 | $8,760 |
| Special Projects | $3,085 | $10,000 | $15,000 |
| Total Sales | $81,467 | $120,604 | $147,315 |
| Direct Cost of Sales | Year 1 | Year 2 | Year 3 |
| Royalties | $5,654 | $7,236 | $8,839 |
| Marketing | $5,000 | $6,250 | $7,500 |
| Subtotal Direct Cost of Sales | $10,654 | $13,486 | $16,339 |
Contents
5.4 Milestones
Coaching Company has a big year coming. To achieve the sales and marketing goals outlined in this business plan, the company has deadlines and ideas to implement. Frank Smith is accountable for all items. Some of these are outlined below:
- March 1, 2005: Coaching Company must commence operations. This requires a trip to Anytown in January 2005 with final franchise agreements signed by February 1, 2005. Frank Smith will visit Anytown on January 14, 2005 to take care of this.
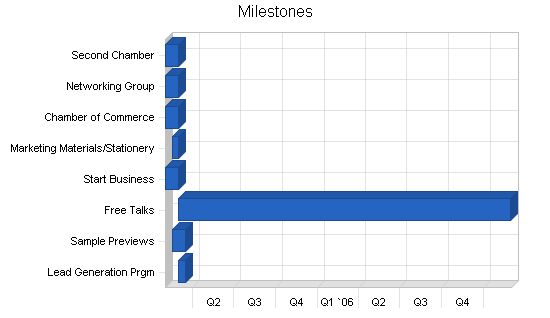
Milestones:
| Start Date | End Date | Budget | Manager | Department |
| 3/1/2005 | 3/15/2005 | $1,000 | ABC | Marketing |
| 2/15/2005 | 3/15/2005 | $300 | ABC | Marketing |
| 3/1/2005 | 3/1/2007 | $50 | ABC | Marketing |
| 2/1/2005 | 2/28/2005 | $17,900 | ABC | Finance |
| 2/15/2005 | 2/28/2005 | $500 | ABC | Marketing |
| 2/1/2005 | 2/28/2005 | $195 | ABC | Marketing |
| 2/1/2005 | 2/28/2005 | $360 | ABC | Marketing |
| 2/1/2005 | 2/28/2005 | $200 | ABC | Department |
| Total Budget | $20,505 |
Management Summary
The management team initially relies heavily on the founder. However, as we expand, we will hire additional consultants, salespeople, and marketers.
6.1 Personnel Plan
Below is the personnel plan for Coaching Company, which includes the hiring of a second full-time salesperson/coach in year 2.
| Year 1 | Year 2 | Year 3 | |
| $27,000 | $50,000 | $50,000 | |
| $0 | $20,000 | $42,000 | |
| 1 | 2 | 2 | |
| Total Payroll | $27,000 | $70,000 | $92,000 |
Financial Plan
Our financial plan is based on conservative estimates and assumptions. We will initially need investment to support our operations for the first year, but the owner is prepared to provide that funding.
In order to minimize risk factors, we will:
- Secure enough capital to sustain operations for the first year
- Maintain low overhead by utilizing shared office space and working from home during the first year
- Create a strong customer base through aggressive marketing
- Establish strong community ties and involvement
- Accept cash, credit, and debit card payments only to eliminate collection costs
7.1 Start-up Funding
The start-up costs will be covered by the owners’ personal funds.
| Start-up Expenses to Fund | $22,250 |
| Start-up Assets to Fund | $10,500 |
| Total Funding Required | $32,750 |
| Assets | |
| Non-cash Assets from Start-up | $2,500 |
| Cash Requirements from Start-up | $8,000 |
| Additional Cash Raised | $950 |
| Cash Balance on Starting Date | $8,950 |
| Total Assets | $11,450 |
| Liabilities and Capital | |
| Liabilities | |
| Current Borrowing | $0 |
| Long-term Liabilities | $0 |
| Other Current Liabilities (interest-free) | $0 |
| Total Liabilities | $0 |
| Capital | |
| Planned Investment | |
| Owner | $33,700 |
| Investor | $0 |
| Additional Investment Requirement | $0 |
| Total Planned Investment | $33,700 |
| Loss at Start-up (Start-up Expenses) | ($22,250) |
| Total Capital | $11,450 |
| Total Capital and Liabilities | $11,450 |
| Total Funding | $33,700 |
7.2 Projected Profit and Loss
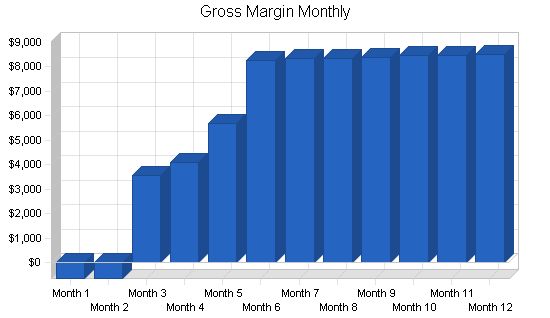
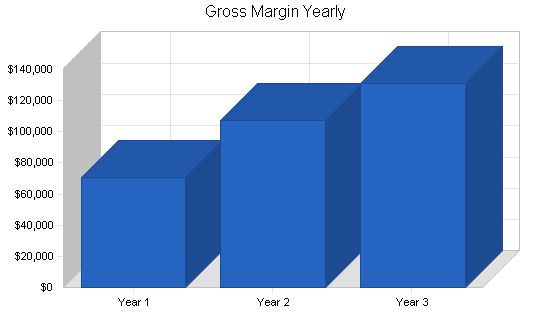
The following table and chart display the projected Profit and Loss for Coaching Company. The majority of our operating expenses consist of the owner’s payroll, benefits, and taxes. This includes a standard PPO health plan, as the owner is the sole provider of services. If the owner gets sick, sales will come to a halt. Marketing and Promotion is our second largest expense category, as it is crucial for establishing brand recognition and attracting new business as a start-up.
The moving expenses in December and the increased rent reflect our planned move into an office space, transitioning from working out of the owner’s home.
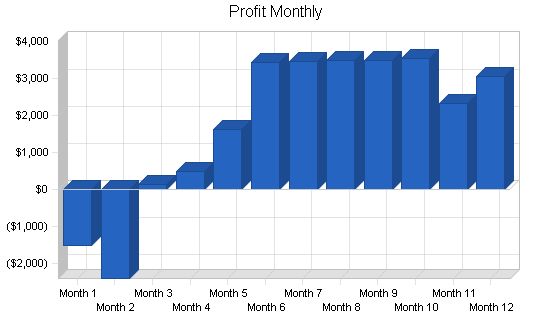
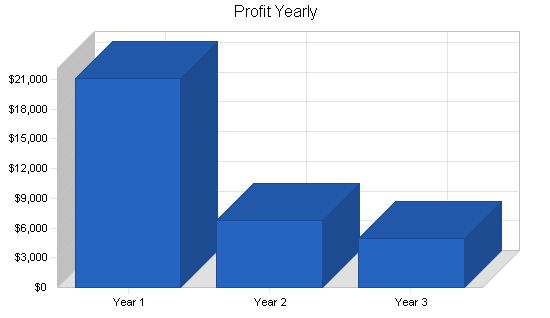
Pro Forma Profit and Loss
Sales:
Year 1: $81,467
Year 2: $120,604
Year 3: $147,315
Direct Cost of Sales:
Year 1: $10,654
Year 2: $13,486
Year 3: $16,339
Other Costs of Sales:
Year 1: $0
Year 2: $0
Year 3: $0
Total Cost of Sales:
Year 1: $10,654
Year 2: $13,486
Year 3: $16,339
Gross Margin:
Year 1: $70,813
Year 2: $107,118
Year 3: $130,976
Gross Margin %:
Year 1: 86.92%
Year 2: 88.82%
Year 3: 88.91%
Expenses:
Payroll:
Year 1: $27,000
Year 2: $70,000
Year 3: $92,000
Marketing/Promotion:
Year 1: $4,800
Year 2: $5,400
Year 3: $6,400
Depreciation:
Year 1: $0
Year 2: $0
Year 3: $0
Rent:
Year 1: $2,335
Year 2: $10,000
Year 3: $10,000
Utilities:
Year 1: $480
Year 2: $528
Year 3: $580
Insurance:
Year 1: $972
Year 2: $1,020
Year 3: $1,072
Payroll Taxes:
Year 1: $4,050
Year 2: $10,500
Year 3: $13,800
Moving Expenses:
Year 1: $1,000
Year 2: $0
Year 3: $0
Other:
Year 1: $0
Year 2: $0
Year 3: $0
Total Operating Expenses:
Year 1: $40,637
Year 2: $97,448
Year 3: $123,852
Profit Before Interest and Taxes:
Year 1: $30,176
Year 2: $9,670
Year 3: $7,124
EBITDA:
Year 1: $30,176
Year 2: $9,670
Year 3: $7,124
Interest Expense:
Year 1: $0
Year 2: $0
Year 3: $0
Taxes Incurred:
Year 1: $9,053
Year 2: $2,901
Year 3: $2,137
Net Profit:
Year 1: $21,123
Year 2: $6,769
Year 3: $4,987
Net Profit/Sales:
Year 1: 25.93%
Year 2: 5.61%
Year 3: 3.39%
7.3 Break-even Analysis
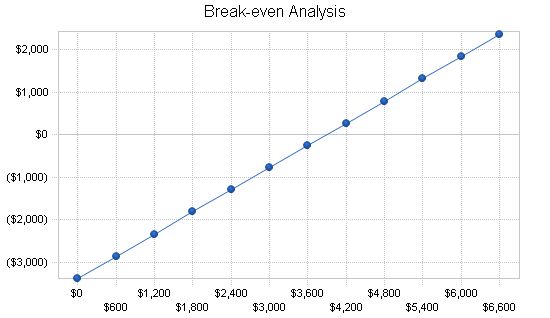
Break-even data is presented in the chart and table below.
Break-even Analysis
Monthly Revenue Break-even: $3,896.
Assumptions:
– Average Percent Variable Cost: 13%
– Estimated Monthly Fixed Cost: $3,386.
7.4 Projected Cash Flow
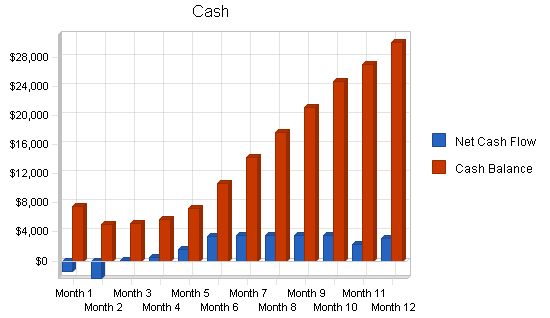
The table and chart below illustrate the Cash Flow for Coaching Company. Cash flow is expected to be positive for all months after the first six months. We anticipate a gradual decrease in cash balance until sales meet mid-year targets.
Pro Forma Cash Flow
| Pro Forma Cash Flow | |||
| Year 1 | Year 2 | Year 3 | |
| Cash Received | |||
| Cash from Operations | |||
| Cash Sales | $81,467 | $120,604 | $147,315 |
| Subtotal Cash from Operations | $81,467 | $120,604 | $147,315 |
| Additional Cash Received | |||
| Sales Tax, VAT, HST/GST Received | $0 | $0 | $0 |
| New Current Borrowing | $0 | $0 | $0 |
| New Other Liabilities (interest-free) | $0 | $0 | $0 |
| New Long-term Liabilities | $0 | $0 | $0 |
| Sales of Other Current Assets | $0 | $0 | $0 |
| Sales of Long-term Assets | $0 | $0 | $0 |
| New Investment Received | $0 | $0 | $0 |
| Subtotal Cash Received | $81,467 | $120,604 | $147,315 |
| Expenditures | |||
| Expenditures from Operations | |||
| Cash Spending | $60,344 | $113,835 | $142,328 |
| Subtotal Spent on Operations | $60,344 | $113,835 | $142,328 |
| Additional Cash Spent | |||
| Sales Tax, VAT, HST/GST Paid Out | $0 | $0 | $0 |
| Principal Repayment of Current Borrowing | $0 | $0 | $0 |
| Other Liabilities Principal Repayment | $0 | $0 | $0 |
| Long-term Liabilities Principal Repayment | $0 | $0 | $0 |
| Purchase Other Current Assets | $0 | $0 | $0 |
| Purchase Long-term Assets | $0 | $0 | $0 |
| Dividends | $0 | $0 | $0 |
| Subtotal Cash Spent | $60,344 | $113,835 | $142,328 |
| Net Cash Flow | $21,123 | $6,769 | $4,987 |
| Cash Balance | $30,073 | $36,842 | $41,829 |
7.5 Projected Balance Sheet
The following table presents the Balance Sheet for Coaching Company. It shows our projected steady increase in Net Worth over the next three years. As a consulting company, we do not need a great deal in the way of assets, so the largest factor in the Balance Sheet is our cash balance.
| Pro Forma Balance Sheet | |||
| Year 1 | Year 2 | Year 3 | |
| Assets | |||
| Current Assets | |||
| Cash | $30,073 | $36,842 | $41,829 |
| Other Current Assets | $2,500 | $2,500 | $2,500 |
| Total Current Assets | $32,573 | $39,342 | $44,329 |
| Long-term Assets | |||
| Total Long-term Assets | $0 | $0 | $0 |
| Total Assets | $32,573 | $39,342 | $44,329 |
| Liabilities and Capital | Year 1 | Year 2 | Year 3 |
| Current Liabilities | |||
| Current Borrowing | $0 | $0 | $0 |
| Other Current Liabilities | $0 | $0 | $0 |
| Total Liabilities | $0 | $0 | $0 |
| Paid-in Capital | $33,700 | $33,700 | $33,700 |
| Retained Earnings | ($22,250) | ($1,127) | $5,642 |
| Earnings | $21,123 | $6,769 | $4,987 |
| Total Capital | $32,573 | $39,342 | $44,329 |
| Total Liabilities and Capital | $32,573 | $39,342 | $44,329 |
| Net Worth | $32,573 | $39,342 | $44,329 |
7.6 Business Ratios
The following table shows the projected business ratios. We expect to maintain healthy ratios for profitability, risk, and return. The industry comparisons are for Management Consulting Services, SIC code 8742.
| Ratio Analysis | |||||||||||||
| Year 1 | Year 2 | Year 3 | Industry Profile | ||||||||||
| Sales Growth | 0.00% | 48.04% | 22.15% | 7.74% | |||||||||
| Percent of Total Assets | |||||||||||||
| Other Current Assets | 7.68% | 6.35% | 5.64% | 48.61% | |||||||||
| Total Current Assets | 100.00% | 100.00% | 100.00% | 77.64% | |||||||||
| Long-term Assets | 0.00% | 0.00% | 0.00% | 22.36% | |||||||||
| Total Assets | 100.00% | 100.00% | 100.00% | 100.00% | |||||||||
| Current Liabilities | 0.00% | 0.00% | 0.00% | 31.75% | |||||||||
| Long-term Liabilities | 0.00% | 0.00% | 0.00% | 18.72% | |||||||||
| Total Liabilities | 0.00% | 0.00% | 0.00% | 50.47% | |||||||||
| Net Worth | 100.00% | 100.00% | 100.00% | 49.53% | |||||||||
| Percent of Sales | |||||||||||||
| Sales | 100.00% | 100.00% | 100.00% | 100.00% | |||||||||
| Gross Margin | 86.92% | 88.82% | 88.91% | 100.00% | |||||||||
| Selling, General & Administrative Expenses | 60.99% | 83.21% | 85.52% | 83.82% | |||||||||
| Advertising Expenses | 0.00% | 0.00% | 0.00% | 1.12% | |||||||||
| Profit Before Interest and Taxes | 37.04% | 8.02% | 4.84% | 2.69% | |||||||||
| Main Ratios | |||||||||||||
| Current | 0.00 | 0.00 | 0.00 | 1.69 | |||||||||
| Quick | 0.00 | 0.00 | 0.00 | 1.36 | |||||||||
| Total Debt to Total Assets | 0.00% | 0.00% | 0.00% | 56.50% | |||||||||
| Pre-tax Return on Net Worth | 92.64% | 24.58% | 16.07% | 2.64% | |||||||||
| Pre-tax Return on Assets | 92.64% | 24.58% | 16.07% | 6.07% | |||||||||
| Additional Ratios | Year 1 | Year 2 | |||||||||||
| Pro Forma Balance Sheet | |||||||||||||
| Month 1 | Month 2 | Month 3 | Month 4 | Month 5 | Month 6 | Month 7 | Month 8 | Month 9 | Month 10 | Month 11 | Month 12 | ||
| Assets | Starting Balances | ||||||||||||
| Cash | $8,950 | $7,443 | $5,039 | $5,171 | $5,663 | $7,285 | $10,710 | $14,181 | $17,662 | $21,155 | $24,702 | $27,032 | $30,073 |
| Other Current Assets | $2,500 | $2,500 | $2,500 | $2,500 | $2,500 | $2,500 | $2,500 | $2,500 | $2,500 | $2,500 | $2,500 | $2,500 | $2,500 |
| Total Current Assets | $11,450 | $9,943 | $7,539 | $7,671 | $8,163 | $9,785 | $13,210 | $16,681 | $20,162 | $23,655 | $27,202 | $29,532 | $32,573 |
| Long-term Assets | |||||||||||||
| Long-term Assets | $0 | $0 | $0 | $0 | $0 | $0 | $0 | $0 | $0 | $0 | $0 | $0 | $0 |
| Accumulated Depreciation | $0 | $0 | $0 | $0 | $0 | $0 | $0 | $0 | $0 | $0 | $0 | $0 | $0 |
| Total Long-term Assets | $0 | $0 | $0 | $0 | $0 | $0 | $0 | $0 | $0 | $0 | $0 | $0 | $0 |
| Total Assets | $11,450 | $9,943 | $7,539 | $7,671 | $8,163 | $9,785 | $13,210 | $16,681 | $20,162 | $23,655 | $27,202 | $29,532 | $32,573 |
| Liabilities and Capital | |||||||||||||
| Month 1 | Month 2 | Month 3 | Month 4 | Month 5 | Month 6 | Month 7 | Month 8 | Month 9 | Month 10 | Month 11 | Month 12 | ||
| Current Liabilities | |||||||||||||
| Current Borrowing | $0 | $0 | $0 | $0 | $0 | $0 | $0 | $0 | $0 | $0 | $0 | $0 | $0 |
| Other Current Liabilities | $0 | $0 | $0 | $0 | $0 | $0 | $0 | $0 | $0 | $0 | $0 | $0 | $0 |
| Subtotal Current Liabilities | $0 | $0 | $0 | $0 | $0 | $0 | $0 | $0 | $0 | $0 | $0 | $0 | $0 |
| Long-term Liabilities | $0 | $0 | $0 | $0 | $0 | $0 | $0 | $0 | $0 | $0 | $0 | $0 | $0 |
| Total Liabilities | $0 | $0 | $0 | $0 | $0 | $0 | $0 | $0 | $0 | $0 | $0 | $0 | $0 |
| Paid-in Capital | $33,700 | $33,700 | $33,700 | $33,700 | $33,700 | $33,700 | $33,700 | $33,700 | $33,700 | $33,700 | $33,700 | $33,700 | $33,700 |
| Retained Earnings | ($22,250) | ($22,250) | ($22,250) | ($22,250) | ($22,250) | ($22,250) | ($22,250) | ($22,250) | ($22,250) | ($22,250) | ($22,250) | ($22,250) | ($22,250) |
| Earnings | $0 | ($1,507) | ($3,911) | ($3,779) | ($3,287) | ($1,665) | $1,760 | $5,231 | $8,712 | $12,205 | $15,752 | $18,082 | $21,123 |
| Total Capital | $11,450 | $9,943 | $7,539 | $7,671 | $8,163 | $9,785 | $13,210 | $16,681 | $20,162 | $23,655 | $27,202 | $29,532 | $32,573 |
| Total Liabilities and Capital | $11,450 | $9,943 | $7,539 | $7,671 | $8,163 | $9,785 | $13,210 | $16,681 | $20,162 | $23,655 | $27,202 | $29,532 | $32,573 |
| Net Worth | $11,450 | $9,943 | $7,539 | $7,671 | $8,163 | $9,785 | $13,210 | $16,681 | $20,162 | $23,655 | $27,202 | $29,532 | $32,573 |

Business Plan Outline
- Executive Summary
- Company Summary
- Services
- Market Analysis Summary
- Strategy and Implementation Summary
- Management Summary
- Financial Plan
- Appendix
Hello!
I’m Andrew Brooks, a seasoned finance consultant from the USA and the mind behind phonenumber247.com.
My career is built on a foundation of helping individuals and businesses thrive financially in an ever-changing economic landscape. At phonenumber247.com, my aim is to demystify the complex world of finance, providing clear, actionable advice that can help you navigate your financial journey with confidence. Whether it’s personal finance management, investment strategies, or understanding the nuances of market dynamics, I’m here to share insights and tools that can propel you towards your financial goals.
Welcome to my digital space, where every piece of advice is a step closer to financial clarity and success!
