The Athlete’s Foot in Pine Ridge Square will be the go-to athletic footwear store for Coral Springs, Florida. The city has a population of 29,000 school-aged children, with over 11,000 participating in athletic programs. There are also 27 schools within three miles of the store. Additionally, there are 57,000 adults aged 20 to 54 in the same radius, which is the prime age for Florida’s running community. For instance, 250 participants from Coral Springs, Coconut Creek, and Parkland took part in the Walt Disney Marathon & 1/2 Marathon in January. Currently, there are no stores in Coral Springs that offer a comprehensive collection of running shoes or provide education on proper style, fit, and sizing.
The store will be located at the intersection of University Drive and Wiles Road, with key co-tenants like Fresh Market, Bed Bath & Beyond, and Blockbuster Video. There is approximately 400,000 sq ft of retail space at this intersection, and University Drive and Wiles Road are both being extended. Around 55,000 cars pass through this intersection every day.
Competition in Coral Springs is minimal, as the existing "Mall" stores cater to fashion athletic footwear customers and lack technical knowledge and expertise for running shoes. They also make little effort to provide sports-specific footwear and accessories.
The Athlete’s Foot franchise is recognized worldwide as a leader in athletic footwear franchising, with over 700 company-owned and franchised stores in 33 countries. As a franchise, we will benefit from special vendor discounts, real estate selection support, proven store design and layout, a comprehensive merchandising system, training, ongoing support, a national advertising program, and access to advanced fit technician and research and development programs.
The primary objectives of the business plan for The Athlete’s Foot are:
1. Make The Athlete’s Foot the headquarters for athletic footwear by offering knowledgeable and professional customer service. Customer service will be measured through repeat business and multiple sales.
2. Be an active participant and supporter of the Coral Springs Athletic Community and develop a youth and adult running club to promote a healthy lifestyle through exercise.
3. Achieve a 33% increase in sales in year two and maintain a minimum annual increase of 15% thereafter.
The mission of The Athlete’s Foot is to specialize in the sale of true athletic footwear for the entire family. The store will emphasize the sale of children’s athletic shoes and a full assortment of men’s, women’s, and children’s running shoes and accessories. Consumers will receive technical knowledge on the proper fit and style of athletic footwear for their various needs. The store aims to be the only full-service athletic footwear store with knowledgeable sales help in the city.
The goal is to be the headquarters for the Coral Springs athlete. Coral Springs has one of the largest and most sophisticated community athletic programs in the United States, with approximately 29,000 school-aged children within three miles of the planned store location. To attain the headquarters position, the store will become a visible member of the athletic community through sponsorship, seminars, team and league promotions, and the development of a community running program.
The Athlete’s Foot sells quality athletic footwear for the entire family, specializing in running shoes and accessories. The store is located in a shopping center anchored by Fresh Market, Bed Bath and Beyond, Blockbuster Video, and four restaurants. The customer service quality and lack of competition in the city position the store to quickly become the footwear headquarters for the local individual athlete and various teams, leagues, and schools. Although part of a worldwide chain, this Athlete’s Foot store will be family owned and operated.
Start-up Summary:
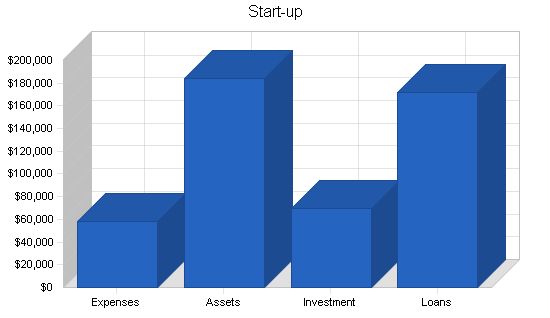
The start-up costs include store build-out, inventory control (computers and cash registers), the foot scanner and fixture, opening inventory, and the franchise fee. Start-up costs will be financed through a combination of owner investment, short-term loans and lines of credit, and long-term borrowing. The distribution of planned financing is shown in the start-up chart and table.
Start-up Funding
Start-up Expenses to Fund: $58,000
Start-up Assets to Fund: $184,000
Total Funding Required: $242,000
Assets
Non-cash Assets from Start-up: $156,000
Cash Requirements from Start-up: $28,000
Additional Cash Raised: $0
Cash Balance on Starting Date: $28,000
Total Assets: $184,000
Liabilities and Capital
Liabilities
Current Borrowing: $20,000
Long-term Liabilities: $150,000
Accounts Payable (Outstanding Bills): $2,000
Other Current Liabilities (interest-free): $0
Total Liabilities: $172,000
Capital
Planned Investment
Investor 1 HKL: $70,000
Investor 2: $0
Other: $0
Additional Investment Requirement: $0
Total Planned Investment: $70,000
Loss at Start-up (Start-up Expenses): ($58,000)
Total Capital: $12,000
Total Capital and Liabilities: $184,000
Total Funding: $242,000
Products
The Athlete’s Foot will sell the latest and most popular name brand athletic footwear for the family. Consumers will be educated about the proper size, style, fit, and design needed for their particular use and foot characteristics. We will offer athletic footwear and accessories for almost every sport and active use. We do not initially plan to sell golf shoes or skates.
The shoes are purchased from top manufacturers in the world, made possible through The Athlete’s Foot Corporation’s 700-store buying power. We stock styles from brands such as Nike, Adidas, Puma, Converse, New Balance, Asics, Saucony, and Brooks. Inventory is tracked through our online cash register and computerized tracking system. We know the style, size, and quantity of every item sold in the store each day. Re-orders are drop shipped by manufacturers or can be rush ordered directly from The Athlete’s Foot warehouse, if necessary.
The opening order will be placed through The Athlete’s Foot Corporate Warehouse, with their assistance on styles and size runs. We will also work with other franchisees who have family footwear and specialized running stores for input into our merchandise assortment. Over the first year, we will eventually place orders directly with manufacturers but always have The Athlete’s Foot as backup stock if needed due to high demand for a particular shoe.
Market Analysis Summary
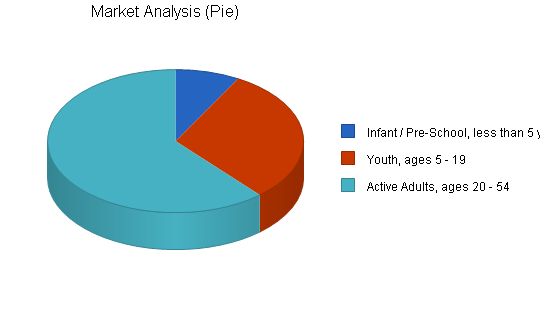
Approximately 110,000 residents live within three miles of Pine Ridge Square. Twenty-six percent (29,000) of them are between the ages of five and nineteen, and fifty-two percent (57,000) are between the ages of twenty and fifty-four. Coral Springs has a strong youth athletic program with 11,359 children participating in various sports programs throughout the year. Additionally, there are 3,500 children participating in non-municipal sponsored leagues and programs. This does not include residents of neighboring cities like Parkland and Coconut Creek, which are within the market area and have an additional 3,000 participants. The city has 47 public parks, with the six largest dedicated solely to athletics. The three-mile radius has four high schools, four middle schools, and 14 elementary schools in the public school system. There are also five private schools and three new schools planned for the next 18 months. Coral Springs is a young, active community, with outdoor sports played year-round. The need for cold weather boots and shoes does not exist, therefore, athletic shoes are worn year-round.
The residents of Coral Springs are in the upper income brackets, with an average income of approximately $68,000 per year. Eighteen percent of the population earns over $100,000 per year, and that percentage is expected to increase to 25% in the next three years. This affluent, active resident is willing to buy the latest athletic footwear if the service and assortment are strong.
The top two ACORN Consumer Groups within three miles are Prosperous Baby Boomers (30.7%) and Baby Boomers with Children (17.4%). These are our primary target markets.
While we have focused on the immediate three-mile radius, the co-tenancy of Fresh Market and Bed Bath and Beyond will generate customers from a 5-7 mile radius. Additionally, there are two specialty retailers in the center, Widensky’s Children’s Clothing and Jonathan Reed Young Men’s Clothing, which have a customer base throughout Broward and Palm Beach Counties.
We are confident that we will capture the true athletic adult with our assortment and service. By capturing the children’s business through the same assortment and service, we can also become the “family athletic footwear store.” While the typical “family adult” may not be as “active” as our target runner, the convenience and professional service we will provide will allow us to become “their” athletic footwear store.
To recap, our target markets are:
1. The True Athletic Adult
2. The True Athletic Participant Children.
By serving these customers well, the balance of the less active community will identify The Athlete’s Foot as the athletic footwear headquarters.
Market Segmentation
The Athlete’s Foot feels there are two types of customers the store needs to attract: the Runners and the Non-runners. These groups are subdivided as follows.
Runners
1. “True Runner” – Runs between 20-40 miles per week. Typically 30-45 years old, both male and female. May include high school track and cross country runners. Seeks the latest technology regardless of price.
2. “Weekend Warrior” – Runs up to 20-25 miles per week, mainly on weekends. Often parents of young families looking for quality and affordable price.
3. “Running for Attention” – Runs 6-10 miles per week to look like a runner. Frequently seen running in highly visible places. This segment includes both males and females between 30-55 years old.
4. “Running for Need” – Comprises two groups: ex-high school or college runners who need motivation to remain active and individuals who have been told to get into better shape. These individuals are prime targets for referral marketing.
Non-runners
1. Infants – Athletic style shoes are important as the first pair of shoes for most infants.
2. Children – With approximately 20,000 potential customers, this group requires a primary focus. Almost every child has at least one pair of athletic shoes.
3. Teens – Although the need for the latest styles has diminished, teens remain an important segment in athletic footwear. They require name brand, in-style athletic shoes for various purposes.
4. Adults/Non Participant – Almost all adults own a pair of athletic shoes, but their level of participation varies. The upper income adult seeks the latest styles, while the middle and lower income adults look for practical footwear.
5. Active Young Adult – This small segment, approximately 5,500 people, is highly active and participates in sports as a social activity.
6. Adults/Participant – This segment can be divided by income level. Active, upper-income participants seek quality, name-brand footwear, while active middle-income participants look for a quality shoe at a competitive price.
The Athlete’s Foot will focus on two primary market segments: the "Active Family" and the "True Runner/Weekend Warrior." The Active Family consists of parents in their late 30’s and early 40’s with two children who participate in sports. They need to purchase multiple pairs of shoes per year, making them a volume customer. Our goal is to have the entire family make purchases in our store. The average sale for this segment will be approximately $40.
The True Runner/Weekend Warrior segment includes participants in running and other athletic activities. The average sale for this segment will be between $70 – $90. We expect these customers to make additional purchases such as running socks, apparel, accessories, or supplements. By capturing the True Runner, we hope to attract less serious runners to our store as well.
We anticipate that 70% of our annual volume will come from these two segments, while the remaining customers will consist of sport-specific buyers and non-family participants.
The retail athletic footwear business has faced challenges in recent years, with several large store formats failing. High-priced basketball shoes and the decline in popularity of NBA/Logo clothing have contributed to this decline. The "superstore" concept in the sale of athletic shoes has proven to be unsuccessful, as it lacked competent customer service and overwhelmed consumers with too many styles. Successful athletic shoe stores are now focusing on quality customer service, strong assortment of new styles, and offering shoes in all price ranges to meet the needs of the entire family.
In Coral Springs, our primary competition comes from regional mall athletic footwear stores that cater to the "fashion athletic" customer. Our advantage over these stores is our superior customer service, technical knowledge, and more convenient atmosphere. We also have an advantage over children’s specialty stores in Coral Springs, as we offer a larger assortment, specialty sport shoes, and the ability to serve the entire family’s athletic footwear needs. Our challenge will be to provide non-athletic shoes for youth customers.
We also face competition from discount department stores and discount "rack" shoe stores, but we aim to be competitive with these stores by offering discontinued and clearance shoes.
Our strategy is to provide a service to the entire market, while focusing on our two primary segments. We will create an atmosphere appealing to the true athletic footwear customer and market ourselves as the place where athletes buy their shoes.
Our competitive edge lies in the recognition of The Athlete’s Foot as a national chain, our complete assortment, and high-tech design. We also offer superior customer service through our exclusive Athlete’s Foot Computerized Scanner, which prepares a "Fitprint" to determine the best shoe fit for customers. Additionally, we aim to become the meeting place for Coral Springs runners by sponsoring races, fun runs, and running clinics, and stocking a full assortment of running supplements and hydration fluids.
Our sales strategy focuses on providing timely and attentive service to all potential sales. We prioritize building long-term relationships with customers over immediate sales closures. We will market directly to customers through various channels, including mailings, phone calls, league presentations, and internet/email contact. We also encourage special orders to meet specialized needs and enforce a liberal return policy.
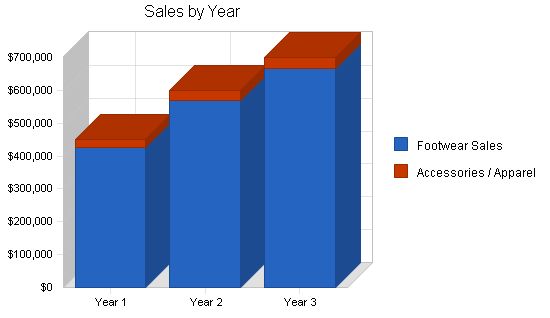
The Athlete’s Foot sales forecast predicts steady growth for the business.
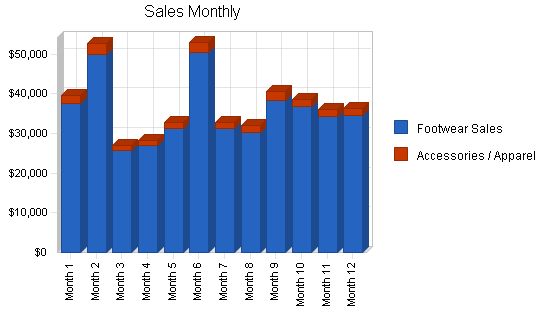
Sales Forecast
Year 1-Year 3
Sales
Footwear Sales: $427,500 – $570,000 – $665,000
Accessories / Apparel: $22,500 – $30,000 – $35,000
Total Sales: $450,000 – $600,000 – $700,000
Direct Cost of Sales
Year 1-Year 3
Footwear Sales: $235,125 – $313,500 – $365,750
Accessories / Apparel: $12,375 – $16,500 – $19,250
Subtotal Direct Cost of Sales: $247,500 – $330,000 – $385,000
Management Summary
The Athlete’s Foot Franchise will be owned by Jane and Howard Lefkowitz. Jane has been a public school teacher for 14 years in Dade County, Florida. Howard is the President of Sizeler Real Estate of Florida, Inc., which manages, leases, and develops 1 million sq. ft. of retail property in Florida for a NYSE REIT. Jane will run the daily operations of the business, including community relations. Howard will continue in his current position at Sizeler, but will assist in buying, financial planning, and weekend coverage.
Personnel Plan
The personnel plan is as follows:
Jane Lefkowitz, Owner/Manager: $18,000 – $20,700 – $23,500 per year
Assistant Store Manager: $18,000 – $20,700 – $23,500 per year
Key Associate: $8.00 per hour – 40 hours
Part-Time Associate "A": $6.00 per hour – 12 hours
Part-Time Associate "B": $6.00 per hour – 8 hours
Part-Time Associate "C": $6.00 per hour – 8 hours
Total People: 6 – 7 – 7
Total Payroll: $59,168 – $67,500 – $75,425
Sales growth will be aggressive in the first 18 months as we optimize our merchandise assortment, size scales, and stock levels. We anticipate a 33% increase in sales in the second year.
Marketing will average 3% of total sales.
Residual profits will be invested in reducing debt and lost income from cash holdings.
Company expansion is an option if sales projections are met or exceeded.
Important Assumptions
1. The Athlete’s Foot will have exclusive rights against competitive stores within a four-mile radius, except for the existing store in Coral Square Mall.
2. The Athlete’s Foot will continue its national promotion of better running shoes.
3. The selected store location requires minimal renovations.
4. Bed, Bath & Beyond, Fresh Market, and Blockbuster will remain in the center for the first three years.
5. We will sponsor community sports within the City of Coral Springs.
6. We anticipate opening in July 2000. If not, the opening will likely be in October.
Projected Profit and Loss
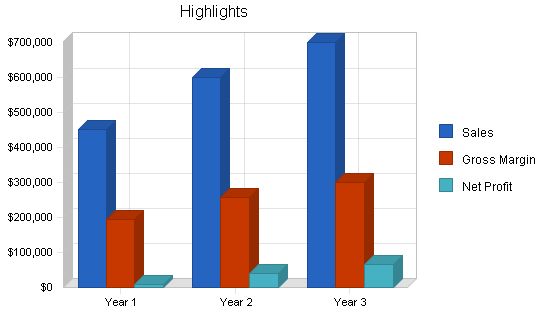
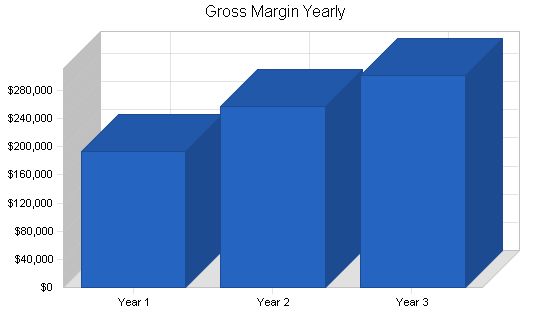
In the second year of operation, our customer service and assortment will allow us to generate approximately 5% profit. Our sales projections are conservative, but if sales increase as anticipated, the profit-to-sales ratio could reach 10% by the end of year three.
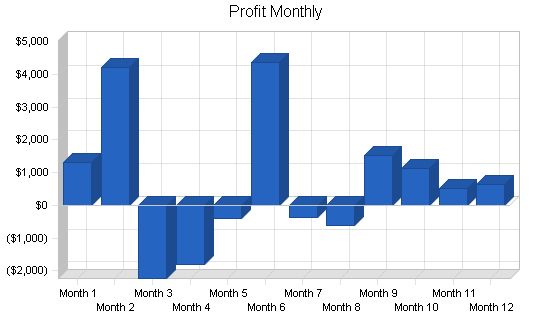
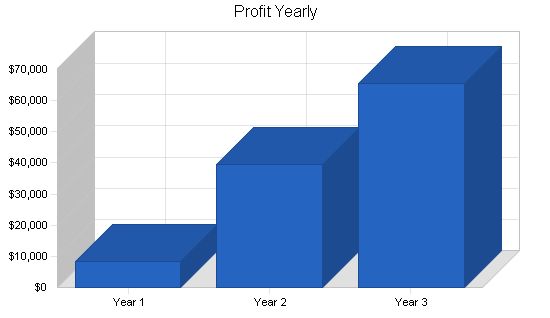
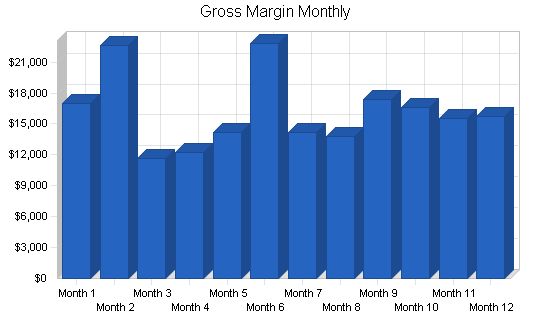
Pro Forma Profit and Loss:
Year 1 Year 2 Year 3
Sales: $450,000 $600,000 $700,000
Direct Cost of Sales: $247,500 $330,000 $385,000
Other: $9,000 $12,000 $14,000
Total Cost of Sales: $256,500 $342,000 $399,000
Gross Margin: $193,500 $258,000 $301,000
Gross Margin %: 43.00% 43.00% 43.00%
Expenses:
Payroll: $59,168 $67,500 $75,425
Sales and Marketing and Other Expenses: $44,627 $53,700 $59,750
Depreciation: $0 $0 $0
Royalties (5%): $22,500 $30,000 $35,000
Insurance: $5,850 $7,800 $9,100
Rent: $27,200 $27,200 $27,200
Payroll Taxes: $5,917 $6,750 $7,543
Other: $0 $0 $0
Total Operating Expenses: $165,262 $192,950 $214,018
Profit Before Interest and Taxes: $28,238 $65,050 $86,983
EBITDA: $28,238 $65,050 $86,983
Interest Expense: $15,281 $12,593 $9,788
Taxes Incurred: $4,683 $13,114 $11,579
Net Profit: $8,274 $39,343 $65,616
Net Profit/Sales: 1.84% 6.56% 9.37%
7.3 Break-even Analysis:
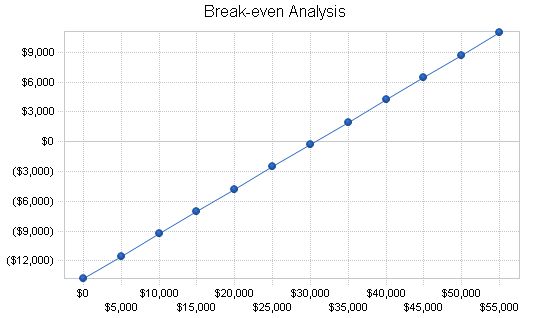
A Break-even Analysis table shows the average costs/prices. We need monthly sales to break even with fixed costs, per average sale, and average variable costs.
Break-even Analysis
Monthly Revenue Break-even: $30,604
Assumptions:
– Average Percent Variable Cost: 55%
– Estimated Monthly Fixed Cost: $13,772
7.4 Projected Cash Flow
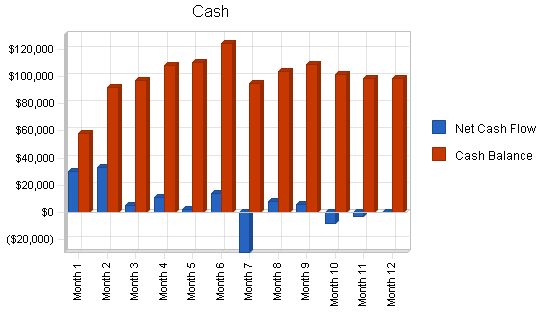
We position ourselves as a minimal risk concern with steady cash flows. Although not included in the projections, we expect to receive two or three months of free base rent after store opening. This will help reduce costs and increase marketing during the start-up period. Initially, we have allocated a more aggressive cash balance to quickly respond to unforeseen merchandise needs, missed classifications, "hot item" reorders, and potentially higher sales than anticipated, especially during the first two quarters of operations for back-to-school and holiday periods. If we successfully attract previous "mall customers" as planned, sales could increase by up to 25%.
Once we establish the required cash balance level (approximately six months after opening), we will decrease the projected cash balance to reduce debt and minimize excess cash.
Pro Forma Cash Flow
Year 1 Year 2 Year 3
Cash Received
Cash from Operations
Cash Sales $450,000 $600,000 $700,000
Subtotal Cash from Operations $450,000 $600,000 $700,000
Additional Cash Received
Sales Tax, VAT, HST/GST Received $0 $0 $0
New Current Borrowing $0 $0 $0
New Other Liabilities (interest-free) $0 $0 $0
New Long-term Liabilities $0 $0 $0
Sales of Other Current Assets $0 $0 $0
Sales of Long-term Assets $0 $0 $0
New Investment Received $0 $0 $0
Subtotal Cash Received $450,000 $600,000 $700,000
Expenditures
Year 1 Year 2 Year 3
Expenditures from Operations
Cash Spending $59,168 $67,500 $75,425
Bill Payments $291,509 $489,471 $558,653
Subtotal Spent on Operations $350,677 $556,971 $634,078
Additional Cash Spent
Sales Tax, VAT, HST/GST Paid Out $0 $0 $0
Principal Repayment of Current Borrowing $4,500 $4,500 $4,500
Other Liabilities Principal Repayment $0 $0 $0
Long-term Liabilities Principal Repayment $24,000 $24,000 $24,000
Purchase Other Current Assets $0 $0 $0
Purchase Long-term Assets $0 $0 $0
Dividends $0 $0 $0
Subtotal Cash Spent $379,177 $585,471 $662,578
Net Cash Flow $70,823 $14,529 $37,422
Cash Balance $98,823 $113,352 $150,774
7.5 Projected Balance Sheet
All of our tables will be updated monthly to reflect past performance and future assumptions. Future assumptions will not be based solely on past performance but rather on economic cycle activity, regional retail indicators, national athletic footwear trends, and future cash flow possibilities. We have been, and will continue to be, working with an experienced partner in a large and well respected regional CPA firm, who has both personal and professional experience in start-up retail operations.
We expect solid growth in net worth beyond the first fiscal year of operation.
Pro Forma Balance Sheet
Year 1 Year 2 Year 3
Assets
Current Assets
Cash $98,823 $113,352 $150,774
Inventory $22,052 $29,403 $34,303
Other Current Assets $1,000 $1,000 $1,000
Total Current Assets $121,875 $143,755 $186,077
Long-term Assets
Long-term Assets $70,000 $70,000 $70,000
Accumulated Depreciation $0 $0 $0
Total Long-term Assets $70,000 $70,000 $70,000
Total Assets $191,875 $213,755 $256,077
Liabilities and Capital
Year 1 Year 2 Year 3
Current Liabilities
Accounts Payable $30,101 $41,138 $46,345
Current Borrowing $15,500 $11,000 $6,500
Other Current Liabilities $0 $0 $0
Subtotal Current Liabilities $45,601 $52,138 $52,845
Long-term Liabilities
$126,000 $102,000 $78,000
Total Liabilities $171,601 $154,138 $130,845
Paid-in Capital $70,000 $70,000 $70,000
Retained Earnings ($58,000) ($49,726) ($10,383)
Earnings $8,274 $39,343 $65,616
Total Capital $20,274 $59,617 $125,233
Total Liabilities and Capital $191,875 $213,755 $256,077
Net Worth $20,274 $59,617 $125,233
7.6 Business Ratios
The following table contains important business ratios for the retail athletic shoe store industry, as determined by the Standard Industry Classification (SIC) Index code 5661.
Ratio Analysis
Year 1 Year 2 Year 3 Industry Profile
Sales Growth 0.00% 33.33% 16.67% 0.20%
Percent of Total Assets
Inventory 11.49% 13.76% 13.40% 46.40%
Other Current Assets 0.52% 0.47% 0.39% 25.30%
Total Current Assets 63.52% 67.25% 72.66% 80.30%
Long-term Assets 36.48% 32.75% 27.34% 19.70%
Total Assets 100.00% 100.00% 100.00% 100.00%
Current Liabilities
Accounts Payable 23.77% 24.39% 20.64% 38.40%
Long-term Liabilities 65.67% 47.72% 30.46% 14.50%
Total Liabilities 89.43% 72.11% 51.10% 52.90%
Net Worth 10.57% 27.89% 48.90% 47.10%
Percent of Sales
Sales 100.00% 100.00% 100.00% 100.00%
Gross Margin 43.00% 43.00% 43.00% 45.70%
Selling, General & Administrative Expenses 41.14% 36.44% 33.58% 28.60%
Advertising Expenses 0.55% 0.55% 0.55% 2.60%
Profit Before Interest and Taxes 6.28% 10.84% 12.43% 0.70%
Main Ratios
Current 2.67 2.76 3.52 2.28
Quick 2.19 2.19 2.87 0.63
Total Debt to Total Assets 89.43% 72.11% 51.10% 52.90%
Pre-tax Return on Net Worth 63.91% 87.99% 61.64% 1.50%
Pre-tax Return on Assets 6.75% 24.54% 30.15% 3.20%
Additional Ratios
Net Profit Margin 1.84% 6.56% 9.37% n.a
Return on Equity 40.81% 65.99% 52.40% n.a
Activity Ratios
Inventory Turnover 9.37 12.83 12.09 n.a
Accounts Payable Turnover 10.62 12.17 12.17 n.a
Payment Days 27 26 28 n.a
Total Asset Turnover 2.35 2.81 2.73 n.a
Debt Ratios
Debt to Net Worth 8.46 2.59 1.04 n.a
Current Liab. to Liab. 0.27 0.34 0.40 n.a
Liquidity Ratios
Net Working Capital $76,274 $91,617 $133,233 n.a
Interest Coverage 1.85 5.17 8.89 n.a
Additional Ratios
Assets to Sales 0.43 0.36 0.37 n.a
Current Debt/Total Assets 24% 24% 21% n.a
Acid Test 2.19 2.19 2.87 n.a
Sales/Net Worth 22.20 10.06 5.59 n.a
Dividend Payout 0.00 0.00 0.00 n.a
Appendix
Sales Forecast
Month 1 Month 2 Month 3 Month 4 Month 5 Month 6 Month 7 Month 8 Month 9 Month 10 Month 11 Month 12
Sales
Footwear Sales $37,620 $50,018 $25,650 $26,933 $31,208 $50,445 $31,208 $30,353 $38,475 $36,765 $34,200 $34,628
Accessories / Apparel $1,980 $2,633 $1,350 $1,418 $1,643 $2,655 $1,643 $1,598 $2,025 $1,935 $1,800 $1,823
Total Sales $39,600 $52,650 $27,000 $28,350 $32,850 $53,100 $32,850 $31,950 $40,500 $38,700 $36,000 $36,450
Direct Cost of Sales
Month 1 Month 2 Month 3 Month 4 Month 5 Month 6 Month 7 Month 8 Month 9 Month 10 Month 11 Month 12
Footwear Sales $20,691 $27,510 $14,108 $14,813 $17,164 $27,745 $17,164 $16,694 $21,161 $20,221 $18,810 $19,045
Accessories / Apparel $1,089 $1,448 $743 $780 $903 $1,460 $903 $879 $1,114 $1,064 $990 $1,002
Subtotal Direct Cost of Sales $21,780 $28,958 $14,850 $15,593 $18,068 $29,205 $18,068 $17,573 $22,275 $21,285 $19,800 $20,048
Personnel Plan
Jane Lefkowitz, Owner / Mgr. / $18.K / Yr. 0% $1,500 $1,500 $1,500 $1,500 $1,500 $1,500 $1,500 $1,500 $1,500 $1,500 $1,500 $1,500 $1,500
Assistant Store Manager / $18K / Yr. 0% $1,500 $1,500 $1,500 $1,500 $1,500 $1,500 $1,500 $1,500 $1,500 $1,500 $1,500 $1,500 $1,500
Key Assoc. / $8.00 hr. – 40 hrs. 0% $1,024 $1,280 $1,280 $1,280 $1,280 $1,280 $1,280 $1,280 $1,280 $1,280 $1,280 $1,280 $1,280
Part Time Assoc. “A” – $6.00 / Hr.- 12 hrs 0% $288 $288 $288 $288 $288 $288 $288 $288 $288 $288 $288 $288 $288
Part Time Assoc. “B” – $6.00 / Hr. – 8 hrs. 0% $192 $192 $192 $192 $192 $192 $192 $192 $192 $192 $192 $192 $192
Part Time Assoc. “C” – $6.00 / Hr. – 8 hrs. 0% $192 $192 $192 $192 $192 $192 $192 $192 $192 $192 $192 $192 $192
Total People 6 6 6 6 6 6 6 6 6 6 6 6 6
Total Payroll $4,696 $4,952 $4,952 $4,952 $4,952 $4,952 $4,952 $4,952 $4,952 $4,952 $4,952 $4,952 $4,952
General Assumptions
Plan Month 1 2 3 4 5 6 7 8 9 10 11 12
Current Interest Rate 9.00% 9.00% 9.00% 9.00% 9.00% 9.00% 9.00% 9.00% 9.00% 9.00% 9.00% 9.00% 9.00%
Long-term Interest Rate 10.00% 10.00% 10.00% 10.00% 10.00% 10.00% 10.00% 10.00% 10.00% 10.00% 10.00% 10.00% 10.00%
Tax Rate 30.00% 25.00% 0.00% 0.00% 0.00% 25.00% 0.00% 0.00% 25.00% 25.00% 25.00% 25.00% 25.00%
Other 0 0 0 0 0 0 0 0 0 0 0 0 0
Pro Forma Profit and Loss
Sales $39,600 $52,650 $27,000 $28,350 $32,850 $53,100 $32,850 $31,950 $40,500 $38,700 $36,000 $36,450
Direct Cost of Sales $21,780 $28,958 $14,850 $15,593 $18,068 $29,205 $18,068 $17,573 $22,275 $21,285 $19,800 $20,048
Other $792 $1,053 $540 $567 $657 $1,062 $657 $639 $810 $774 $720 $729
Total Cost of Sales $22,572 $30,011 $15,390 $16,160 $18,725 $30,267 $18,725 $18,212 $23,085 $22,059 $20,520 $20,777
Gross Margin $17,028 $22,640 $11,610 $12,190 $14,126 $22,833 $14,126 $13,739 $17,415 $16,641 $15,480 $15,674
Gross Margin % 43.00% 43.00% 43.00% 43.00% 43.00% 43.00% 43.00% 43.00% 43.00% 43.00% 43.00% 43.00% 43.00%
Expenses
Payroll $4,696 $4,952 $4,952 $4,952 $4,952 $4,952 $4,952 $4,952 $4,952 $4,952 $4,952 $4,952 $4,952
Sales and Marketing and Other Expenses $3,845 $4,636 $3,084 $3,166 $3,438 $4,663 $3,438 $3,383 $3,900 $3,791 $3,628 $3,656
Depreciation $0 $0 $0 $0 $0 $0 $0 $0 $0 $0 $0 $0 $0
Royalties (5%) $1,980 $2,633 $1,350 $1,418 $1,643 $2,655 $1,643 $1,598 $2,025 $1,935 $1,800 $1,823
Insurance $515 $684 $351 $369 $427 $690 $427 $415 $527 $503 $468 $474
Rent $2,267 $2,267 $2,267 $2,267 $2,267 $2,267 $2,267 $2,267 $2,267 $2,267 $2,267 $2,267 $2,267
Payroll Taxes 10% $470 $495 $495 $495 $495 $495 $495 $495 $495 $495 $495 $495 $495
Pro Forma Cash Flow
| Pro Forma Cash Flow | |||||||||||||
| Cash Received | |||||||||||||
| Cash from Operations | |||||||||||||
| Cash Sales | $39,600 | $52,650 | $27,000 | $28,350 | $32,850 | $53,100 | $32,850 | $31,950 | $40,500 | $38,700 | $36,000 | $36,450 | |
| Subtotal Cash from Operations | $39,600 | $52,650 | $27,000 | $28,350 | $32,850 | $53,100 | $32,850 | $31,950 | $40,500 | $38,700 | $36,000 | $36,450 | |
| Additional Cash Received | |||||||||||||
| Sales Tax, VAT, HST/GST Received | 0.00% | $0 | $0 | $0 | $0 | $0 | $0 | $0 | $0 | $0 | $0 | $0 | $0 |
| New Current Borrowing | $0 | $0 | $0 | $0 | $0 | $0 | $0 | $0 | $0 | $0 | $0 | $0 | $0 |
| New Other Liabilities (interest-free) | $0 | $0 | $0 | $0 | $0 | $0 | $0 | $0 | $0 | $0 | $0 | $0 | $0 |
| New Long-term Liabilities | $0 | $0 | $0 | $0 | $0 | $0 | $0 | $0 | $0 | $0 | $0 | $0 | $0 |
| Sales of Other Current Assets | $0 | $0 | $0 | $0 | $0 | $0 | $0 | $0 | $0 | $0 | $0 | $0 | $0 |
| Sales of Long-term Assets | $0 | $0 | $0 | $0 | $0 | $0 | $0 | $0 | $0 | $0 | $0 | $0 | $0 |
| New Investment Received | $0 | $0 | $0 | $0 | $0 | $0 | $0 | $0 | $0 | $0 | $0 | $0 | $0 |
| Subtotal Cash Received | $39,600 | $52,650 | $27,000 | $28,350 | $32,850 | $53,100 | $32,850 | $31,950 | $40,500 | $38,700 | $36,000 | $36,450 | |
| Expenditures | |||||||||||||
| Expenditures from Operations | |||||||||||||
| Cash Spending | $4,696 | $4,952 | $4,952 | $4,952 | $4,952 | $4,952 | $4,952 | $4,952 | $4,952 | $4,952 | $4,952 | $4,952 | $4,952 |
| Bill Payments | $2,394 | $11,902 | $14,362 | $9,878 | $23,204 | $31,853 | $54,694 | $16,375 | $27,474 | $38,947 | $31,452 | $28,976 | |
| Subtotal Spent on Operations | $7,090 | $16,854 | $19,314 | $14,830 | $28,156 | $36,805 | $59,646 | $21,327 | $32,426 | $43,899 | $36,404 | $33,928 | |
| Additional Cash Spent | |||||||||||||
| Sales Tax, VAT, HST/GST Paid Out | $0 | $0 | $0 | $0 | $0 | $0 | $0 | $0 | $0 | $0 | $0 | $0 | $0 |
| Principal Repayment of Current Borrowing | $375 | $375 | $375 | $375 | $375 | $375 | $375 | $375 | $375 | $375 | $375 | $375 | $375 |
| Other Liabilities Principal Repayment | $0 | $0 | $0 | $0 | $0 | $0 | $0 | $0 | $0 | $0 | $0 | $0 | $0 |
| Long-term Liabilities Principal Repayment | $2,000 | $2,000 | $2,000 | $2,000 | $2,000 | $2,000 | $2,000 | $2,000 | $2,000 | $2,000 | $2,000 | $2,000 | $2,000 |
| Purchase Other Current Assets | $0 | $0 | $0 | $0 | $0 | $0 | $0 | $0 | $0 | $0 | $0 | $0 | $0 |
| Purchase Long-term Assets | $0 | $0 | $0 | $0 | $0 | $0 | $0 | $0 | $0 | $0 | $0 | $0 | $0 |
| Dividends | $0 | $0 | $0 | $0 | $0 | $0 | $0 | $0 | $0 | $0 | $0 | $0 | $0 |
| Subtotal Cash Spent | $9,465 | $19,229 | $21,689 | $17,205 | $30,531 | $39,180 | $62,021 | $23,702 | $34,801 | $46,274 | $38,779 | $36,303 | |
| Net Cash Flow | $30,135 | $33,421 | $5,311 | $11,145 | $2,319 | $13,920 | ($29,171) | $8,248 | $5,699 | ($7,574) | ($2,779) | $147 | |
| Cash Balance | $58,135 | $91,556 | $96,868 | $108,013 | $110,332 | $124,252 | $95,081 | $103,329 | $109,028 | $101,454 | $98,676 | $98,823 |
Pro Forma Balance Sheet
| Pro Forma Balance Sheet | |||||||||||||
| Assets | Starting Balances | ||||||||||||
| Current Assets | |||||||||||||
| Cash | $28,000 | $58,135 | $91,556 | $96,868 | $108,013 | $110,332 | $124,252 | $95,081 | $103,329 | $109,028 | $101,454 | $98,676 | $98,823 |
| Inventory | $85,000 | $63,220 | $34,263 | $19,413 | $17,152 | $19,874 | $32,126 | $19,874 | $19,330 | $24,503 | $23,414 | $21,780 | $22,052 |
| Other Current Assets | $1,000 | $1,000 | $1,000 | $1,000 | $1,000 | $1,000 | $1,000 | $1,000 | $1,000 | $1,000 | $1,000 | $1,000 | $1,000 |
| Total Current Assets | $114,000 | $122,355 | $126,819 | $117,280 | $126,164 | $131,206 | $157,378 | $115,955 | $123,659 | $134,531 | $125,868 | $121,456 | $121,875 |
| Long-term Assets | |||||||||||||
| Long-term Assets | $70,000 | $70,000 | $70,000 | $70,000 | $70,000 | $70,000 | $70,000 | $70,000 | $70,000 | $70,000 | $70,000 | $70,000 | $70,000 |
| Accumulated Depreciation | $0 | $0 | $0 | $0 | $0 | $0 | $0 | $0 | $0 | $0 | $0 | $0 | $0 |
| Total Long-term Assets | $70,000 | $70,000 | $70,000 | $70,000 | $70,000 | $70,000 | $70,000 | $70,000 | $70,000 | $70,000 | $70,000 | $70,000 | $70,000 |
| Total Assets | $184,000 | $192,355 | $196,819 | $187,280 | $196,164 | $201,206 | $227,378 | $185,955 | $193,659 | $204,531 | $195,868 | $191,456 | $191,875 |
| Liabilities and Capital | |||||||||||||
| Current Liabilities | |||||||||||||
| Accounts Payable | $2,000 | $11,418 | $14,047 | $9,114 | $22,170 | $29,985 | $54,161 |
Hello!
I’m Andrew Brooks, a seasoned finance consultant from the USA and the mind behind phonenumber247.com.
My career is built on a foundation of helping individuals and businesses thrive financially in an ever-changing economic landscape. At phonenumber247.com, my aim is to demystify the complex world of finance, providing clear, actionable advice that can help you navigate your financial journey with confidence. Whether it’s personal finance management, investment strategies, or understanding the nuances of market dynamics, I’m here to share insights and tools that can propel you towards your financial goals.
Welcome to my digital space, where every piece of advice is a step closer to financial clarity and success!
