Barnum Painters offers top-quality interior and exterior painting services for residential and commercial properties. The company recognizes two major issues in this industry: inefficient project scheduling and employee retention problems. These problems lead to customer dissatisfaction, lack of repeat business, and low word-of-mouth referrals. However, Barnum Painters aims to address and leverage these weaknesses through their contractor business plan to gain a stronger local market presence.
The objectives for Barnum Painters in the next three years are to achieve sales revenues of approximately $620,000, with a customer mix of 30% commercial and 60% residential building contracts per year. Additionally, the company plans to expand its operations to include the Greater Seattle area, encompassing Kirkland, Renton, and the Kitsap Peninsula.
To achieve these goals, Barnum Painters will provide painting services in a timely manner, employing a comprehensive quality-control program to deliver 100% customer satisfaction. The company views each contract as a partnership, aiming to establish long-term relationships based on mutual benefit. This approach is expected to generate greater long-term profits through referrals and repeat business.
To facilitate their objectives, Barnum Painters will implement the following key procedures:
1. Create the position of inventory coordinator and assign at least one expediter to each project.
2. Appoint a dedicated project manager for each project to resolve quality-control issues.
3. Establish a profit-sharing program for all employees.
Barnum Painters is a start-up limited liability company led by three principal officers with a combined industry experience of 40 years. The company will be a partnership between Mr. William Barnum, Mr. Anthony Barnum, and Mr. Michael Kruger. The principals will invest significant amounts of their own capital, and they are also seeking a $7,000 loan to cover start-up costs and future growth. Additionally, the company has secured a $10,000 line of credit (not shown on financial statements) to address unforeseen expenses or opportunities.
The company’s headquarters will be in a rented suite in the Rucker Industrial Park on 710 Snoquamie Route, Suite 250 in Edmonds, WA. The facilities will house a reception area, offices for the principals, inventory storage, and an employee lounge. Barnum Painters offers a comprehensive range of services, including interior and exterior painting, drywall plastering, acoustical ceilings, pressure washing, and more. The objective is to provide clients with a one-stop solution, minimizing the need for multiple contractors. Barnum Painters will pursue a low-cost leadership strategy while maintaining high-quality standards.
Initially, the company will focus on residential and commercial customers in the Everett, Washington area. However, by the end of the three-year projections, Barnum Painters expects to have a presence throughout the entire Puget Sound region. The company has conducted a thorough examination of its financial projections, ensuring conservative profit estimates and sufficient expenditure allowances to account for unforeseen events. The principals of the company firmly believe in the accuracy and reliability of their cash flow projections.
The principal officers of Barnum Painters have extensive experience in the contracting business. They believe that most companies in this industry, including painting contractors, suffer from two major problems that Barnum Painters can improve upon and exploit.
The first problem is scheduling jobs. Many painting contractors struggle to maintain established schedules with their customers, resulting in decreased customer satisfaction and retention. This is due to poor management, unreliable employees, and delays in inventory procurement and distribution.
The second problem is retaining reliable and motivated personnel. Many painting companies rely on temporary or transient employees, leading to high turnover rates and decreased service quality.
Barnum Painters will address these problems by implementing the following key procedures:
– Create a position of inventory coordinator and assign at least one expediter to each project.
– Assign a dedicated project manager to handle quality control issues for each project.
– Introduce a program of profit sharing among all employees.
The mission of Barnum Painters is to provide top-quality interior and exterior residential and commercial painting services. The company aims to deliver these services in a timely manner and with an ongoing comprehensive quality control program to ensure 100% customer satisfaction. The principal officers view each contract as a partnership, aiming to create a close and mutually beneficial long-term relationship that will lead to greater profits through referrals and repeat business.
The objectives for Barnum Painters over the next three years are:
– Achieve sales revenues of approximately $450,000 by year three.
– Obtain a customer mix of 30% commercial and 60% residential building contracts per year.
– Expand operations to include the entire Greater Seattle area, including Kirkland, Renton, and the Kitsap Peninsula.
Barnum Painters is a start-up limited liability company consisting of three principle officers with a combined industry experience of 40 years. The company aims to capitalize on the perceived weaknesses and inadequacies of other regional companies in terms of quality and customer satisfaction. The company will be a partnership between Mr. William Barnum, Mr. Anthony Barnum, and Mr. Michael Kruger. The principles will invest significant amounts of their own capital into the company and seek a loan to cover start-up costs and future growth.
Barnum Painters will be located in a rented suite in the Rucker Industrial Park on 710 Snoquamie Route, Suite 250 in Edmonds, WA. The facilities will include a reception area, offices for the principals, storage area for inventory, and an employee lounge. The company plans to leverage its existing contacts and the customer base of Mr. Barnum and Mr. Kruger to generate short-term residential contracts. Long-term profitability will be achieved through a focus on commercial contracts, which will be obtained through strategic alliances and a comprehensive marketing program.
Barnum Painters is a privately owned limited liability partnership, with each of the principal officers holding an equal share in the company.
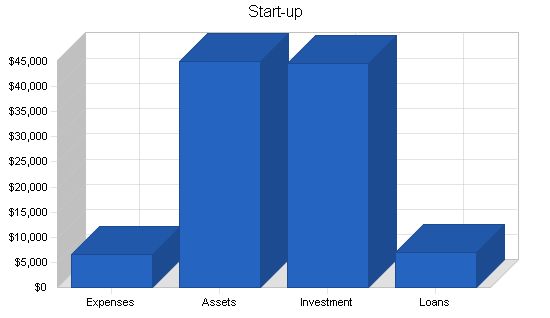
Please refer to the table and chart below for the start-up costs of Barnum Painters.
Start-up Requirements:
– Legal: $400
– Stationery etc.: $300
– Brochures: $500
– Consultants: $750
– Insurance: $600
– Rent: $4,000
– Expensed equipment: $0
– Other: $0
– Total Start-up Expenses: $6,550
Start-up Assets:
– Cash Required: $40,150
– Start-up Inventory: $850
– Other Current Assets: $0
– Long-term Assets: $4,000
– Total Assets: $45,000
Total Requirements: $51,550
Start-up Funding:
– Start-up Expenses to Fund: $6,550
– Start-up Assets to Fund: $45,000
– Total Funding Required: $51,550
Assets:
– Non-cash Assets from Start-up: $4,850
– Cash Requirements from Start-up: $40,150
– Additional Cash Raised: $0
– Cash Balance on Starting Date: $40,150
– Total Assets: $45,000
Liabilities and Capital:
– Liabilities:
– Current Borrowing: $7,000
– Long-term Liabilities: $0
– Accounts Payable (Outstanding Bills): $0
– Other Current Liabilities (interest-free): $0
– Total Liabilities: $7,000
– Capital:
– Planned Investment:
– William Barnum: $15,000
– Anthony Barnum: $18,550
– Michael Kruger: $11,000
– Additional Investment Requirement: $0
– Total Planned Investment: $44,550
– Loss at Start-up (Start-up Expenses): ($6,550)
– Total Capital: $38,000
– Total Capital and Liabilities: $45,000
– Total Funding: $51,550
Company Locations and Facilities:
Barnum Painters will be located in a rented suite in the Rucker Industrial Park on 710 Snoquamie Route, Suite 250 in Edmonds, WA. The facilities will include a reception area, offices for the principals, storage area for inventory, a painting booth, tool area, and employee lounge.
Services:
Barnum Painters offers comprehensive interior and exterior painting services for the residential and commercial markets.
Service Description:
Barnum Painters services include:
– Full prep work.
– Drywall contouring.
– Fine detailing.
– Small carpentry work.
– Specialty wall coatings.
– Refinishings.
– Acoustical ceilings.
– Pressure washing/roof cleaning.
Each project is customized to the client’s wants and needs. Prices are determined by the project’s scope, materials needed, wear and tear on equipment, and required profit margin.
Competitive Comparison:
The contracting and painting market is highly competitive with low barriers to entry and exit, resulting in a large number of rival firms with high turnover rates. Buyers have significant power and loyalty is usually low. Painting companies must compete on quality, timeliness of service, customer relations, and price.
Barnum Painters believes it can improve on the quality and timeliness of services by avoiding mistakes made by other firms, such as delayed schedules and high employee turnover. The company will be competitive in price and maintain close ties with clients throughout each project, building a reputation for better quality service at competitive prices.
Market Analysis Summary:
Barnum Painters will focus on two markets within the industry: the residential segment (including apartment buildings) and the commercial segment (including buildings used for professional purposes).
In the commercial market, completion of projects takes the least amount of time and customization is usually minimal. Maintaining schedule and keeping stakeholders informed of progress is crucial.
In the residential segment, time is less critical. Quality and meeting the client’s needs/wants are top priorities. Clients are often willing to wait for the project to be done to their specifications.
Over the past decade, the industry has seen tremendous growth in the economy, the high technology boom, and the rise of substitute services like Home Depot.
Market Segmentation:
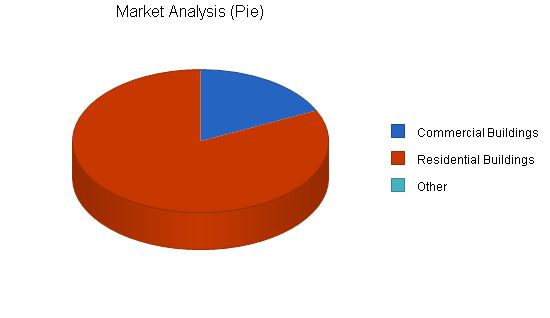
Barnum Painters will focus on the residential segment (including apartment buildings) and the commercial segment (buildings used for professional purposes). The company can handle buildings of any size. The goal is to have approximately one-third of business coming from the commercial segment, which generates the most cash flow and has the lowest variable costs. The residential segment is considered the company’s cash cow. The company expects to expand and serve the entire Puget Sound area within three years.
Market Analysis
| Market Analysis | |||||||
| Year 1 | Year 2 | Year 3 | Year 4 | Year 5 | |||
| Potential Customers | Growth | CAGR | |||||
| Commercial Buildings | 4% | 300,000 | 310,500 | 321,368 | 332,616 | 344,258 | 3.50% |
| Residential Buildings | 3% | 1,375,000 | 1,409,375 | 1,444,609 | 1,480,724 | 1,517,742 | 2.50% |
| Other | 0% | 0 | 0 | 0 | 0 | 0 | 0.00% |
| Total | 2.68% | 1,675,000 | 1,719,875 | 1,765,977 | 1,813,340 | 1,862,000 | 2.68% |
Target Market Segment Strategy
Each market segment has differing needs and trends. The following sections detail how the company will address them.
Market Trends
Over the past decade, new trends have emerged in this industry. The economy’s growth has fueled the painting contractors industry as people have spent more and saved less. The high technology boom has created opportunities in the Pacific Northwest from which the industry has also benefited. However, the growth of companies like Home Depot, which promotes do-it-yourself painting and construction, has caused a decline in sales for the residential segment. This trend poses a significant threat to the industry. Barnum Painters plans to focus more on the commercial segment to drive revenue and income.
Service Business Analysis
Most industry analysis is contained in the Competitive Comparison section, which highlights the competitive nature of the industry, its opportunities and threats, and the company’s pricing flexibility. Barnum Painters operates in a purely competitive market with unlimited competition and high demand. The company’s ability to differentiate its services or enter niche markets is limited. It will adopt a low-cost leadership strategy while maintaining quality.
The painting contracting industry is dominated by a few large firms that compete for major projects, while a large number of smaller companies compete for the rest. Market consolidation is always a threat within the largest company section.
Competition and Buying Patterns
This industry experiences high seasonality, with the busiest times during the summer months. During the winter months, businesses must focus on marketing to secure contracts.
Main Competitors
Barnum Painters’ main competitors include Kolby and Wilson, DMB Enterprises, Sun Painting, and Milbrant Commercial Painters. These competitors achieve profitability through marketing, volume, or high-end contracts. They pose a significant threat to Barnum Painters due to their deep pockets and acquisition intentions. Barnum Painters will compete with them through superior marketing and service.
Strategy and Implementation Summary
As mentioned earlier, the company will focus on enhancing service through better scheduling, project management, and personnel alignment by implementing profit sharing. It aims to use up-to-date communications and scheduling technology to meet deadlines effectively. Additionally, the company intends to establish a reliable pool of painters and eventually hire them full-time with salary and benefits.
The company plans to implement an aggressive marketing plan starting in year three. This includes utilizing various marketing platforms such as literature, TV, radio, billboards, and strategic alliances with other contractors that lack painting services, such as Marble Construction, Talbot Construction, and Burns & Associates.
The following sections outline Barnum Painters’ marketing strategy.
Promotion Strategy
The company will engage in an aggressive marketing program, including mailers, phone solicitation, TV, radio, billboards, and other platforms to generate service awareness and communicate its value proposition. However, the company’s immediate goal is to generate enough profit to cover these expenses. The full marketing plan will be implemented starting in year three. Prior to that, the company will utilize more modest marketing tools such as mailers, word-of-mouth marketing, and Yellow Pages ads.
Pricing Strategy
The company will price each project based on time, materials, and a flat 5-10% profit margin, depending on the segment. In the first year or two, the company will prioritize securing contracts over maintaining its pricing structure. Therefore, the profit margin may be lower during the initial period.
Sales Strategy
Sales forecasts are based on the existing client base of the three principal officers of the company and their ability to generate new sales through their contacts. By combining Mr. Kruger’s commercial painting experience and Mr. Barnum’s residential experience, the company will generate sales in both sectors. The company’s growing marketing program will drive the necessary growth for its survival.
See Sales Strategy.
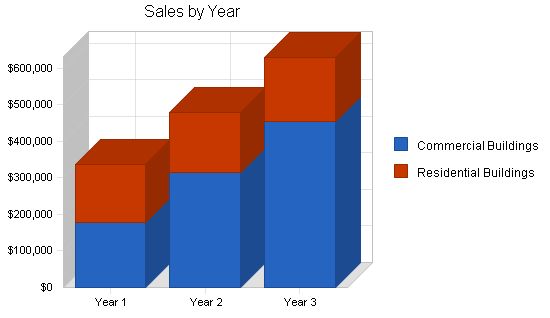
Sales Forecast
| Sales Forecast | |||
| Year 1 | Year 2 | Year 3 | |
| $179,000 | $315,130 | $455,404 | |
| $157,500 | $165,375 | $173,644 | |
| $336,500 | $480,505 | $629,048 | |
| Year 1 | Year 2 | Year 3 | |
| $40,480 | $78,783 | $100,189 | |
| $47,250 | $52,920 | $55,566 | |
| $87,730 | $131,703 | $155,755 | |
Strategic Alliances
The company is in negotiations to form a strategic alliance with a large contractor company. Barnum Painters will provide painting services for the contractor’s clients and vice versa. The company will seek alliances with contractors that have high standards of customer service and retention.
Management Summary
Management consists of three individuals with extensive experience in the painting contractors industry. William Barnum, Anthony Barnum, and Michael Kruger each bring a unique outlook and skill set that will drive sales and profits.
William Barnum will be the president and head of operations, Michael Kruger will be in charge of inventory, expediter and Q&A, and Anthony Barnum will handle sales and contracting.
Organizational Structure
The company will follow a hierarchical structure with William Barnum as president and Anthony Barnum and Michael Kruger as department heads. The sales and contracting department, along with inventory, expediters, and Q&A, will consist of only those individuals until growth requires more staff, anticipated to occur in years three to five.
Management Team
Mr. William Barnum has 15 years of experience in the painting industry, working with residential owners. He started as a carpenter and painter and later became a project manager and financial analyst.
Mr. Anthony Barnum has eight years of experience in sales and communications, with a B.S. degree from Washington State University.
Mr. Michael Kruger has 20 years of experience in the painting industry, including bidding and completing commercial painting projects.
Personnel Plan
| Personnel Plan | |||
| Year 1 | Year 2 | Year 3 | |
| $22,800 | $30,000 | $30,000 | |
| $0 | $0 | $30,000 | |
| $12,900 | $13,500 | $14,000 | |
| $12,900 | $13,500 | $14,000 | |
| $12,900 | $13,500 | $14,000 | |
| $7,525 | $13,500 | $14,000 | |
| $7,525 | $13,500 | $14,000 | |
| $7,525 | $13,500 | $14,000 | |
| $0 | $0 | $14,000 | |
| $0 | $0 | $14,000 | |
| $0 | $0 | $0 | |
| $84,075 | $111,000 | $172,000 | |
| $30,000 | $30,000 | $30,000 | |
| $0 | $0 | $0 | |
| $30,000 | $30,000 | $30,000 | |
| $30,000 | $30,000 | $30,000 | |
| $0 | $18,000 | $18,000 | |
| $0 | $0 | $18,000 | |
| $60,000 | $78,000 | $96,000 | |
| $0 | $0 | $0 | |
| 7 | 11 | 14 | |
| $174,075 | $219,000 | $298,000 | |
The following sections outline the Financial Plan of Barnum Painters.
Important Assumptions
The following table shows the General Assumptions for Barnum Painters.
| General Assumptions | |||
| Year 1 | Year 2 | Year 3 | |
| 1 | 2 | 3 | |
| 10.00% | 10.00% | 10.00% | |
| 10.00% | 10.00% | 10.00% | |
| 30.00% | 30.00% | 30.00% | |
| 0 | 0 | 0 | |
Key Financial Indicators
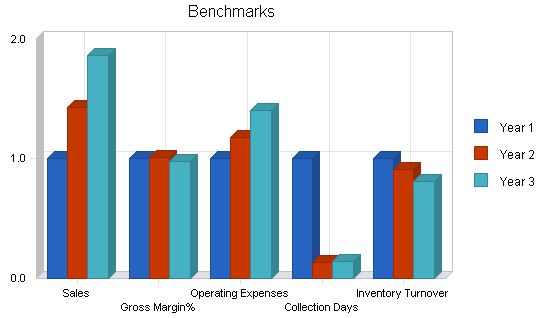
The chart below shows the Benchmarks for Barnum Painters.
Break-even Analysis
The Break-even Analysis shows how many projects Barnum Painters must bid for each month to cover costs. Because Barnum Painters provides customized services with unique project requirements, revenue and cost estimates are arbitrary. Additionally, the company experiences seasonality in contracts, leading to unprofitable months in late fall, winter, and early spring.
Fixed costs are estimated by company officers and include employee payroll. Variable costs are based on a 26% estimate of average sales per unit. Average revenue is estimated by experienced industry officers, considering the types of contracts the company will initially receive and their project requirements.
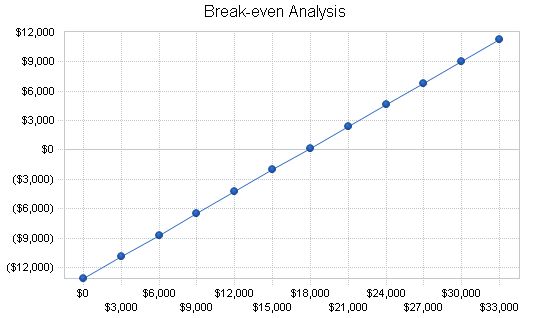
Break-even Analysis:
Monthly Revenue Break-even: $17,755
Assumptions:
– Average Percent Variable Cost: 26%
– Estimated Monthly Fixed Cost: $13,126
Projected Profit and Loss:
The table and chart below display the projected Profit and Loss for Barnum Painters.
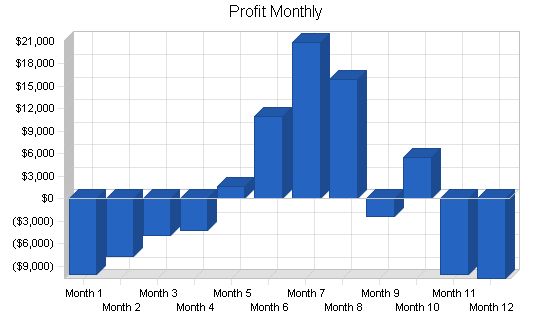
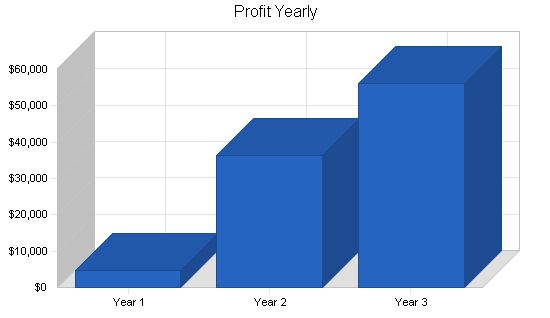
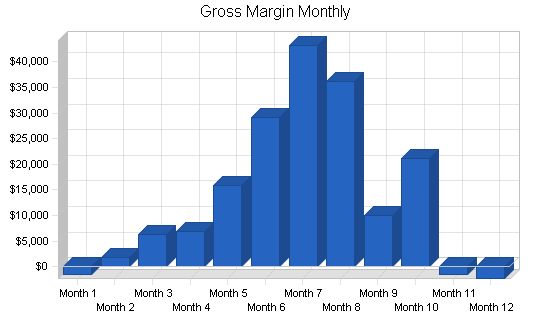
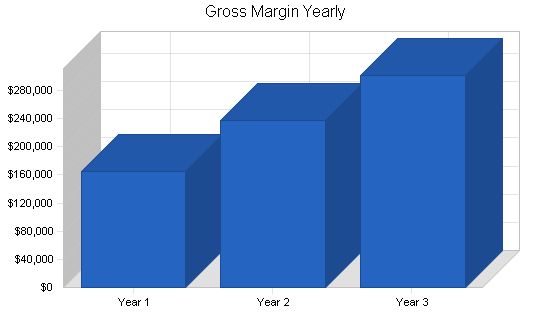
Pro Forma Profit and Loss
Year 1 Year 2 Year 3
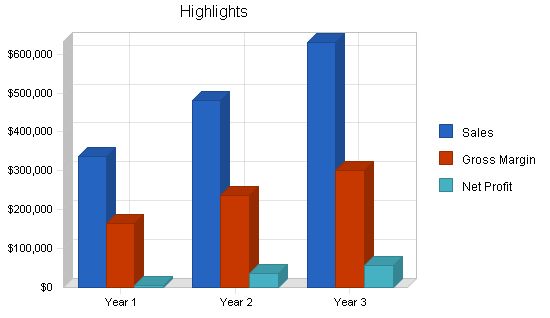
Sales $336,500 $480,505 $629,048
Direct Cost of Sales $87,730 $131,703 $155,755
Production Payroll $84,075 $111,000 $172,000
Other Production Expenses $0 $0 $0
Total Cost of Sales $171,805 $242,703 $327,755
Gross Margin $164,695 $237,803 $301,293
Gross Margin % 48.94% 49.49% 47.90%
Operating Expenses
Sales and Marketing Expenses
Sales and Marketing Payroll $30,000 $30,000 $30,000
Advertising/Promotion $3,600 $5,000 $10,000
Travel $2,400 $3,500 $4,000
Miscellaneous $2,400 $3,000 $3,000
Total Sales and Marketing Expenses $38,400 $41,500 $47,000
Sales and Marketing % 11.41% 8.64% 7.47%
General and Administrative Expenses
General and Administrative Payroll $60,000 $78,000 $96,000
Sales and Marketing and Other Expenses $0 $0 $0
Depreciation $1,200 $1,200 $1,200
Leased Equipment $0 $0 $0
Utilities $1,800 $1,800 $1,800
Insurance $3,600 $3,600 $3,600
Rent $24,000 $24,000 $24,000
Payroll Taxes $26,111 $32,850 $44,700
Other General and Administrative Expenses $0 $0 $0
Total General and Administrative Expenses $116,711 $141,450 $171,300
General and Administrative % 34.68% 29.44% 27.23%
Other Expenses:
Other Payroll $0 $0 $0
Consultants $0 $0 $0
Bookkeeper and Accountant $2,400 $2,500 $2,750
Total Other Expenses $2,400 $2,500 $2,750
Other % 0.71% 0.52% 0.44%
Total Operating Expenses $157,511 $185,450 $221,050
Profit Before Interest and Taxes $7,184 $52,353 $80,243
EBITDA $8,384 $53,553 $81,443
Interest Expense $574 $350 $117
Taxes Incurred $1,983 $15,601 $24,038
Net Profit $4,627 $36,402 $56,088
Net Profit/Sales 1.38% 7.58% 8.92%
Projected Cash Flow
The following table and chart is the Cash Flow for Barnum Painters.
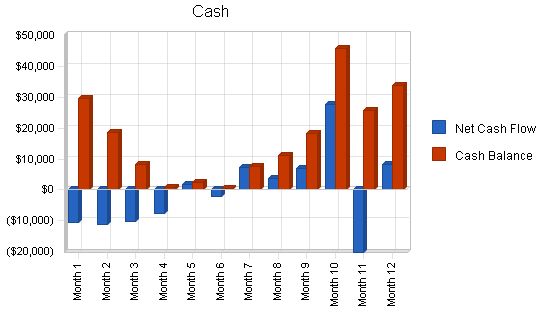
Pro Forma Cash Flow
| Year 1 | Year 2 | Year 3 | |
| Cash Sales | $168,250 | $240,253 | $314,524 |
| Cash from Receivables | $163,833 | $238,362 | $312,574 |
| Subtotal Cash from Operations | $332,083 | $478,615 | $627,098 |
| Sales Tax, VAT, HST/GST Received | $0 | $0 | $0 |
| New Current Borrowing | $0 | $0 | $0 |
| New Other Liabilities (interest-free) | $0 | $0 | $0 |
| New Long-term Liabilities | $0 | $0 | $0 |
| Sales of Other Current Assets | $0 | $0 | $0 |
| Sales of Long-term Assets | $0 | $0 | $0 |
| New Investment Received | $3,000 | $0 | $0 |
| Subtotal Cash Received | $335,083 | $478,615 | $627,098 |
| Expenditures | Year 1 | Year 2 | Year 3 |
| Cash Spending | $174,075 | $219,000 | $298,000 |
| Bill Payments | $164,958 | $217,088 | $269,271 |
| Subtotal Spent on Operations | $339,033 | $436,088 | $567,271 |
| Principal Repayment of Current Borrowing | $2,334 | $2,333 | $2,333 |
| Other Liabilities Principal Repayment | $0 | $0 | $0 |
| Long-term Liabilities Principal Repayment | $0 | $0 | $0 |
| Purchase Other Current Assets | $0 | $0 | $0 |
| Purchase Long-term Assets | $0 | $0 | $0 |
| Dividends | $0 | $0 | $0 |
| Subtotal Cash Spent | $341,367 | $438,421 | $569,604 |
| Net Cash Flow | ($6,283) | $40,194 | $57,494 |
| Cash Balance | $33,867 | $74,061 | $131,555 |
Projected Balance Sheet
The following table presents the Balance Sheet for Barnum Painters.
| Year 1 | Year 2 | Year 3 | |
| Assets | |||
| Cash | $33,867 | $74,061 | $131,555 |
| Accounts Receivable | $4,417 | $6,307 | $8,256 |
| Inventory | $9,906 | $21,772 | $20,284 |
| Other Current Assets | $0 | $0 | $0 |
| Total Current Assets | $48,189 | $102,140 | $160,096 |
| Long-term Assets | |||
| Total Long-term Assets | $2,800 | $1,600 | $400 |
| Total Assets | $50,989 | $103,740 | $160,496 |
| Liabilities and Capital | Year 1 | Year 2 | Year 3 |
| Current Liabilities | |||
| Accounts Payable | $696 | $19,378 | $22,378 |
| Current Borrowing | $4,666 | $2,333 | $0 |
| Other Current Liabilities | $0 | $0 | $0 |
| Subtotal Current Liabilities | $5,362 | $21,711 | $22,378 |
| Long-term Liabilities | $0 | $0 | $0 |
| Total Liabilities | $5,362 | $21,711 | $22,378 |
| Paid-in Capital | $47,550 | $47,550 | $47,550 |
| Retained Earnings | ($6,550) | ($1,923) | $34,479 |
| Earnings | $4,627 | $36,402 | $56,088 |
| Total Capital | $45,627 | $82,029 | $138,117 |
| Total Liabilities and Capital | $50,989 | $103,740 | $160,496 |
| Net Worth | $45,627 | $82,029 | $138,117 |
Business ratios for the years of this plan are shown below. Industry profile ratios based on the Standard Industrial Classification (SIC) code 1721, Painting and Paper Hanging, are shown for comparison.
| Year 1 | Year 2 | Year 3 | Industry Profile | |
| Sales Growth | n.a. | 42.79% | 30.91% | 5.90% |
| Percent of Total Assets | ||||
| Accounts Receivable | 8.66% | 6.08% | 5.14% | 34.60% |
| Inventory | 19.43% | 20.99% | 12.64% | 5.40% |
| Other Current Assets | 0.00% | 0.00% | 0.00% | 29.80% |
| Total Current Assets | 94.51% | 98.46% | 99.75% | 69.80% |
| Long-term Assets | 5.49% | 1.54% | 0.25% | 30.20% |
| Total Assets | 100.00% | 100.00% | 100.00% | 100.00% |
| Current Liabilities | ||||
| Accounts Payable | 10.52% | 20.93% | 13.94% | 43.40% |
| Long-term Liabilities | 0.00% | 0.00% | 0.00% | 12.40% |
| Total Liabilities | 10.52% | 20.93% | 13.94% | 55.80% |
| Net Worth | 89.48% | 79.07% | 86.06% | 44.20% |
| Percent of Sales | ||||
| Sales | 100.00% | 100.00% | 100.00% | 100.00% |
| Gross Margin | 48.94% | 49.49% | 47.90% | 27.20% |
| Selling, General & Administrative Expenses | 47.59% | 41.97% | 39.05% | 15.40% |
| Advertising Expenses | 1.07% | 1.04% | 1.59% | 0.40% |
| Profit Before Interest and Taxes | 2.13% | 10.90% | 12.76% | 2.50% |
| Main Ratios | ||||
| Current |
| Personnel Plan | |||||||||||||
| Production Personnel | |||||||||||||
| Project Forman #1 | $1,900 | $1,900 | $1,900 | $1,900 | $1,900 | $1,900 | $1,900 | $1,900 | $1,900 | $1,900 | $1,900 | ||
| Project Foreman #2 | $0 | $0 | $0 | $0 | $0 | $0 | $0 | $0 | $0 | $0 | $0 | ||
| Residential Painter | $1,075 | $1,075 | $1,075 | $1,075 | $1,075 | $1,075 | $1,075 | $1,075 | $1,075 | $1,075 | $1,075 | ||
| Residential Painter | $1,075 | $1,075 | $1,075 | $1,075 | $1,075 | $1,075 | $1,075 | $1,075 | $1,075 | $1,075 | $1,075 | ||
| Residential Painter | $1,075 | $1,075 | $1,075 | $1,075 | $1,075 | $1,075 | $1,075 | $1,075 | $1,075 | $1,075 | $1,075 | ||
| Commercial Painter | $0 | $0 | $1,075 | $0 | $1,075 | $1,075 | $1,075 | $1,075 | $1,075 | $0 | $0 | ||
| Commercial Painter | $0 | $0 | $1,075 | $0 | $1,075 | $1,075 | $1,075 | $1,075 | $1,075 | $0 | $0 | ||
| Commercial Painter | $0 | $0 | $1,075 | $0 | $1,075 | $1,075 | $1,075 | $1,075 | $1,075 | $0 | $0 | ||
| Commercial Painter | $0 | $0 | $0 | $0 | $0 | $0 | $0 | $0 | $0 | $0 | $0 | ||
| Commercial Painter | $0 | $0 | $0 | $0 | $0 | $0 | $0 | $0 | $0 | $0 | $0 | ||
| Other | $0 | $0 | $0 | $0 | $0 | $0 | $0 | $0 | $0 | $0 | $0 | ||
| Subtotal | $5,125 | $5,125 | $8,350 | $5,125 | $8,350 | $8,350 | $8,350 | $8,350 | $8,350 | $5,125 | $5,125 | ||
General Assumptions
| General Assumptions | |||||||||||||
| Plan Month | 1 | 2 | 3 | 4 | 5 | 6 | 7 | 8 | 9 | 10 | 11 | 12 | |
| Current Interest Rate | 10.00% | 10.00% | 10.00% | 10.00% | 10.00% | 10.00% | 10.00% | 10.00% | 10.00% | 10.00% | 10.00% | 10.00% | |
| Long-term Interest Rate | 10.00% | 10.00% | 10.00% | 10.00% | 10.00% | 10.00% | 10.00% | 10.00% | 10.00% | 10.00% | 10.00% | 10.00% | |
| Tax Rate | 30.00% | 30.00% | 30.00% | 30.00% | 30.00% | 30.00% | 30.00% | 30.00% | 30.00% | 30.00% | 30.00% | 30.00% | |
| Other | 0 | 0 | 0 | 0 | 0 | 0 | 0 | 0 | 0 | 0 | 0 | ||
Pro Forma Profit and Loss:
Sales:
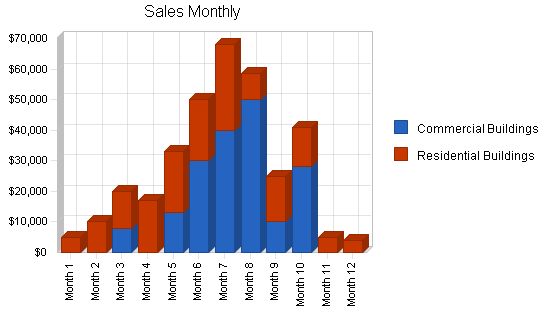
Month 1: $5,000
Month 2: $10,000
Month 3: $20,000
Month 4: $17,000
Month 5: $33,000
Month 6: $50,000
Month 7: $68,000
Month 8: $58,500
Month 9: $25,000
Month 10: $41,000
Month 11: $5,000
Month 12: $4,000
Direct Cost of Sales:
Month 1: $1,500
Month 2: $3,000
Month 3: $5,360
Month 4: $5,100
Month 5: $8,860
Month 6: $12,600
Month 7: $16,400
Month 8: $14,050
Month 9: $6,700
Month 10: $11,460
Month 11: $1,500
Month 12: $1,200
Production Payroll:
Month 1: $5,125
Month 2: $5,125
Month 3: $8,350
Month 4: $5,125
Month 5: $8,350
Month 6: $8,350
Month 7: $8,350
Month 8: $8,350
Month 9: $8,350
Month 10: $8,350
Month 11: $5,125
Month 12: $5,125
Other Production Expenses:
Month 1: $0
Month 2: $0
Month 3: $0
Month 4: $0
Month 5: $0
Month 6: $0
Month 7: $0
Month 8: $0
Month 9: $0
Month 10: $0
Month 11: $0
Month 12: $0
Total Cost of Sales:
Month 1: $6,625
Month 2: $8,125
Month 3: $13,710
Month 4: $10,225
Month 5: $17,210
Month 6: $20,950
Month 7: $24,750
Month 8: $22,400
Month 9: $15,050
Month 10: $19,810
Month 11: $6,625
Month 12: $6,325
Gross Margin:
Month 1: ($1,625)
Month 2: $1,875
Month 3: $6,290
Month 4: $6,775
Month 5: $15,790
Month 6: $29,050
Month 7: $43,250
Month 8: $36,100
Month 9: $9,950
Month 10: $21,190
Month 11: ($1,625)
Month 12: ($2,325)
Gross Margin %:
Month 1: -32.50%
Month 2: 18.75%
Month 3: 31.45%
Month 4: 39.85%
Month 5: 47.85%
Month 6: 58.10%
Month 7: 63.60%
Month 8: 61.71%
Month 9: 39.80%
Month 10: 51.68%
Month 11: -32.50%
Month 12: -58.13%
Operating Expenses:
Sales and Marketing Expenses:
Sales and Marketing Payroll:
Month 1: $2,500
Month 2: $2,500
Month 3: $2,500
Month 4: $2,500
Month 5: $2,500
Month 6: $2,500
Month 7: $2,500
Month 8: $2,500
Month 9: $2,500
Month 10: $2,500
Month 11: $2,500
Month 12: $2,500
Advertising/Promotion:
Month 1: $300
Month 2: $300
Month 3: $300
Month 4: $300
Month 5: $300
Month 6: $300
Month 7: $300
Month 8: $300
Month 9: $300
Month 10: $300
Month 11: $300
Month 12: $300
Travel:
Month 1: $200
Month 2: $200
Month 3: $200
Month 4: $200
Month 5: $200
Month 6: $200
Month 7: $200
Month 8: $200
Month 9: $200
Month 10: $200
Month 11: $200
Month 12: $200
Miscellaneous:
Month 1: $200
Month 2: $200
Month 3: $200
Month 4: $200
Month 5: $200
Month 6: $200
Month 7: $200
Month 8: $200
Month 9: $200
Month 10: $200
Month 11: $200
Month 12: $200
Total Sales and Marketing Expenses:
Month 1: $3,200
Month 2: $3,200
Month 3: $3,200
Month 4: $3,200
Month 5: $3,200
Month 6: $3,200
Month 7: $3,200
Month 8: $3,200
Month 9: $3,200
Month 10: $3,200
Month 11: $3,200
Month 12: $3,200
Sales and Marketing %:
Month 1: 64.00%
Month 2: 32.00%
Month 3: 16.00%
Month 4: 18.82%
Month 5: 9.70%
Month 6: 6.40%
Month 7: 4.71%
Month 8: 5.47%
Month 9: 12.80%
Month 10: 7.80%
Month 11: 64.00%
Month 12: 80.00%
General and Administrative Expenses:
General and Administrative Payroll:
Month 1: $5,000
Month 2: $5,000
Month 3: $5,000
Month 4: $5,000
Month 5: $5,000
Month 6: $5,000
Month 7: $5,000
Month 8: $5,000
Month 9: $5,000
Month 10: $5,000
Month 11: $5,000
Month 12: $5,000
Sales and Marketing and Other Expenses:
Month 1: $0
Month 2: $0
Month 3: $0
Month 4: $0
Month 5: $0
Month 6: $0
Month 7: $0
Month 8: $0
Month 9: $0
Month 10: $0
Month 11: $0
Month 12: $0
Depreciation:
Month 1: $100
Month 2: $100
Month 3: $100
Month 4: $100
Month 5: $100
Month 6: $100
Month 7: $100
Month 8: $100
Month 9: $100
Month 10: $100
Month 11: $100
Month 12: $100
Leased Equipment:
Month 1: $0
Month 2: $0
Month 3: $0
Month 4: $0
Month 5: $0
Month 6: $0
Month 7: $0
Month 8: $0
Month 9: $0
Month 10: $0
Month 11: $0
Month 12: $0
Utilities:
Month 1: $150
Month 2: $150
Month 3: $150
Month 4: $150
Month 5: $150
Month 6: $150
Month 7: $150
Month 8: $150
Month 9: $150
Month 10: $150
Month 11: $150
Month 12: $150
Insurance:
Month 1: $300
Month 2: $300
Month 3: $300
Month 4: $300
Month 5: $300
Month 6: $300
Month 7: $300
Month 8: $300
Month 9: $300
Month 10: $300
Month 11: $300
Month 12: $300
Rent:
Month 1: $2,000
Month 2: $2,000
Month 3: $2,000
Month 4: $2,000
Month 5: $2,000
Month 6: $2,000
Month 7: $2,000
Month 8: $2,000
Month 9: $2,000
Month 10: $2,000
Month 11: $2,000
Month 12: $2,000
Payroll Taxes:
Month 1: 15%
Month 2: $1,894
Month 3: $1,894
Month 4: $2,378
Month 5: $1,894
Month 6: $2,378
Month 7: $2,378
Month 8: $2,378
Month 9: $2,378
Month 10: $2,378
Month 11: $2,378
Month 12: $1,894
Month 12: $1,894
Other General and Administrative Expenses:
Month 1: $0
Month 2: $0
Month 3: $0
Month 4: $0
Month 5: $0
Month 6: $0
Month 7: $0
Month 8: $0
Month 9: $0
Month 10: $0
Month 11: $0
Month 12: $0
Total General and Administrative Expenses:
Month 1: $9,444
Month 2: $9,444
Month 3: $9,928
Month 4: $9,444
Month 5: $9,928
Month 6: $9,928
Month 7: $9,928
Month 8: $9,928
Month 9: $9,928
Month 10: $9,928
Month 11: $9,444
Month 12: $9,444
General and Administrative %:
Month 1: 188.88%
Month 2: 94.44%
Month 3: 49.64%
Month 4: 55.55%
Month 5: 30.08%
Month 6: 19.86%
Month 7: 14.60%
Month 8: 16.97%
Month 9: 39.71%
Month 10: 24.21%
Month 11: 188.88%
Month 12: 236.09%
Other Expenses:
Other Payroll:
Month 1: $0
Month 2: $0
Month 3: $0
Month 4: $0
Month 5: $0
Month 6: $0
Month 7: $0
Month 8: $0
Month 9: $0
Month 10: $0
Month 11: $0
Month 12: $0
Consultants:
Month 1: $0
Month 2: $0
Month 3: $0
Month 4: $0
Month 5: $0
Month 6: $0
Month 7: $0
Month 8: $0
Month 9: $0
Month 10: $0
Month 11: $0
Month 12: $0
Bookkeeper and accountant:
Month 1: $200
Month 2: $200
Month 3: $200
Month 4: $200
Month 5: $200
Month 6: $200
Month 7: $200
Month 8: $200
Month 9: $200
Month 10: $200
Month 11: $200
Month 12: $200
Total Other Expenses:
Month 1: $200
Month 2: $200
Month 3: $200
Month 4: $200
Month 5: $200
Month 6: $200
Month 7: $200
Month 8: $200
Month 9: $200
Month 10: $200
Month 11: $200
Month 12: $200
Other %:
Month 1: 4.00%
Month 2: 2.00%
Month 3: 1.00%
Month 4: 1.18%
Month 5: 0.61%
Month 6: 0.40%
Month 7: 0.29%
Month 8: 0.34%
Month 9: 0.80%
Month 10: 0.49%
Month 11: 4.00%
Month 12: 5.00%
Total Operating Expenses:
Month 1: $12,844
Month 2: $12,844
Month 3: $13,328
Month 4: $12,844
Month 5: $13,328
Month 6: $13,328
Month 7: $13,328
Month 8: $13,328
Month 9: $13,328
Month 10: $13,328
Month 11: $12,844
Month 12: $12,844
Profit Before Interest and Taxes:
Month 1: ($14,469)
Month 2: ($10,969)
Month 3: ($7,038)
Month 4: ($6,069)
Month 5: $2,463
Month 6: $15,723
Month 7: $29,923
Month 8: $22,773
Month 9: ($3,378)
Month 10: $7,863
Month 11: ($14,469)
Month 12: ($15,169)
EBITDA:
Month 1: ($14,369)
Month 2: ($10,869)
Month 3: ($6,938)
Month 4: ($5,969)
Month 5: $2,563
Month 6: $15,823
Month 7: $30,023
Month 8: $22,873
Month 9: ($3,278)
Month 10: $7,963
Month 11: ($14,369)
Month 12: ($15,069)
Interest Expense:
Month 1: $57
Month 2: $55
Month 3: $53
Month 4: $52
Month 5: $50
Month 6: $49
Month 7: $47
Month 8: $45
Month 9: $44
Month 10: $42
Month 11: $41
Month 12: $39
Taxes Incurred:
Month 1: ($4,358)
Month 2: ($3,307)
Month 3: ($2,127)
Month 4: ($1,836)
Month 5: $724
Month 6: $4,702
Month 7: $8,963
Month 8: $6,818
Month 9: ($1,026)
Month 10: $2,346
Month 11: ($4,353)
Month 12: ($4,562)
Net Profit:
Month 1: ($10,168)
Month 2
Pro Forma Cash Flow
| Pro Forma Cash Flow | |||||||||||||
| Month 1 | Month 2 | Month 3 | Month 4 | Month 5 | Month 6 | Month 7 | Month 8 | Month 9 | Month 10 | Month 11 | Month 12 | ||
| Cash Received | |||||||||||||
| Cash Sales | $2,500 | $5,000 | $10,000 | $8,500 | $16,500 | $25,000 | $34,000 | $29,250 | $12,500 | $20,500 | $2,500 | $2,000 | |
| Cash from Receivables | $0 | $83 | $2,583 | $5,167 | $9,950 | $8,767 | $16,783 | $25,300 | $33,842 | $28,692 | $12,767 | $19,900 | |
| Subtotal Cash from Operations | $2,500 | $5,083 | $12,583 | $13,667 | $26,450 | $33,767 | $50,783 | $54,550 | $46,342 | $49,192 | $15,267 | $21,900 | |
| Additional Cash Received | |||||||||||||
| Sales Tax, VAT, HST/GST Received | 0.00% | ||||||||||||
| New Current Borrowing | $0 | ||||||||||||
| New Other Liabilities (interest-free) | $0 | ||||||||||||
| New Long-term Liabilities | $0 | ||||||||||||
| Sales of Other Current Assets | $0 | ||||||||||||
| Sales of Long-term Assets | $0 | ||||||||||||
| New Investment Received | $0 | $3,000 | |||||||||||
| Subtotal Cash Received | $2,500 | $5,083 | $12,583 | $16,667 | $26,450 | $33,767 | $50,783 | $54,550 | $46,342 | $49,192 | $15,267 | $21,900 | |
| Expenditures | |||||||||||||
| Month 1 | Month 2 | Month 3 | Month 4 | Month 5 | Month 6 | Month 7 | Month 8 | Month 9 | Month 10 | Month 11 | Month 12 | ||
| Expenditures from Operations | |||||||||||||
| Cash Spending | $12,625 | $12,625 | $15,850 | $12,625 | $15,850 | $15,850 | $15,850 | $15,850 | $15,850 | $15,850 | $12,625 | $12,625 | |
| Bill Payments | $108 | $3,356 | $6,807 | $11,498 | $8,648 | $19,754 | $27,463 | $34,942 | $23,412 | $5,368 | $22,677 | $924 | |
| Subtotal Spent on Operations | $12,733 | $15,981 | $22,657 | $24,123 | $24,498 | $35,604 | $43,313 | $50,792 | $39,262 | $21,218 | $35,302 | $13,549 | |
| Additional Cash Spent | |||||||||||||
| Sales Tax, VAT, HST/GST Paid Out | $0 | ||||||||||||
| Principal Repayment of Current Borrowing | $194 | $194 | $194 | $194 | $194 | $194 | $194 | $194 | $194 | $194 | $200 | ||
| Other Liabilities Principal Repayment | $0 | ||||||||||||
| Long-term Liabilities Principal Repayment | $0 | ||||||||||||
| Purchase Other Current Assets | $0 | ||||||||||||
| Purchase Long-term Assets | $0 | ||||||||||||
| Dividends | $0 | ||||||||||||
| Subtotal Cash Spent | $12,927 | $16,175 | $22,851 | $24,317 | $24,692 | $35,798 | $43,507 | $50,986 | $39,456 | $21,412 | $35,496 | $13,749 | |
| Net Cash Flow | ($10,427) | ($11,092) | ($10,268) | ($7,651) | $1,758 | ($2,031) | $7,276 | $3,564 | $6,885 | $27,780 | ($20,229) | $8,151 | |
| Cash Balance | $29,723 | $18,631 | $8,363 | $712 | $2,471 | $440 | $7,716 | $11,280 | $18,165 | $45,945 | $25,716 | $33,867 | |
Hello!
I’m Andrew Brooks, a seasoned finance consultant from the USA and the mind behind phonenumber247.com.
My career is built on a foundation of helping individuals and businesses thrive financially in an ever-changing economic landscape. At phonenumber247.com, my aim is to demystify the complex world of finance, providing clear, actionable advice that can help you navigate your financial journey with confidence. Whether it’s personal finance management, investment strategies, or understanding the nuances of market dynamics, I’m here to share insights and tools that can propel you towards your financial goals.
Welcome to my digital space, where every piece of advice is a step closer to financial clarity and success!
