Nonprofit Law Firm Business Plan
Advocates for Legal Equal Access is a not-for-profit law firm that provides civil rights legal representation to indigent Portland citizens. The firm offers legal aid to those who cannot afford it and are not served by other organizations. In America, attorneys are generally needed to enforce and assert legal rights, making civil rights a compromised issue for those without financial resources. Advocates for Legal Equal Access aims to address this problem by offering legal aid to those who are unable to afford it.
Al Rand, founder and leader of Advocates for Legal Equal Access, will utilize his networking and marketing skills to increase the organization’s visibility and attract donations. The firm will rely on donations from law firms and corporations, as well as pro bono contributions from other attorneys. It will be initially financed by Al’s time and money, and will sustain itself through ongoing donations.
Contents
1.1 Objectives
The first three years of operation objectives:
- Create a service-based organization to exceed customer expectations
- Provide legal representation for the Portland community members who can’t afford it
- Increase donations by 20% annually
1.2 Mission
Advocates for Legal Equal Access’ mission is to provide legal services for civil rights issues to the Portland indigent community. We exist to attract and maintain customers. When we adhere to this maxim, everything else will fall into place. Our services will exceed customer expectations.
Organization Summary
Advocates for Legal Equal Access will be established as an Oregon nonprofit organization, qualifying for 501C(3) status.
2.1 Start-up Summary
Advocates for Legal Equal Access’s start-up costs include:
- Three networked computers, printer, CD-RW drive, DSL connection with a router
- Three desks and chairs purchased at a used furniture store for increased value
- Assorted office supplies
- Stationary
- Website development fees primarily used for visibility with corporations and law firms to legitimize the organization
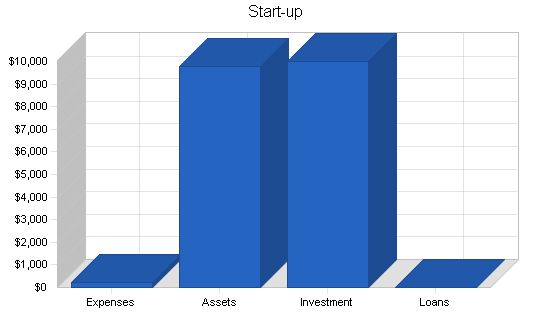
Start-up Funding
Start-up Expenses to Fund: $200
Start-up Assets to Fund: $9,800
Total Funding Required: $10,000
Assets
Non-cash Assets from Start-up: $4,700
Cash Requirements from Start-up: $5,100
Additional Cash Raised: $0
Cash Balance on Starting Date: $5,100
Total Assets: $9,800
Liabilities and Capital
Liabilities
Current Borrowing: $0
Long-term Liabilities: $0
Accounts Payable (Outstanding Bills): $0
Other Current Liabilities (interest-free): $0
Total Liabilities: $0
Capital
Planned Investment: $10,000
Donor 2: $0
Other: $0
Additional Investment Requirement: $0
Total Planned Investment: $10,000
Loss at Start-up (Start-up Expenses): ($200)
Total Capital: $9,800
Total Capital and Liabilities: $9,800
Total Funding: $10,000
Start-up
Requirements
Start-up Expenses
Legal: $0
Stationery etc.: $200
Other: $0
Total Start-up Expenses: $200
Start-up Assets
Cash Required: $5,100
Other Current Assets: $0
Long-term Assets: $4,700
Total Assets: $9,800
Total Requirements: $10,000
Services
Advocates for Legal Equal Access provides civil rights legal services for the Portland indigent community. These services range from discrimination, fair housing practices, 1st amendment issues, to due process claims. These services apply to individuals who qualify using the Advocates minimum qualification system, based on factors including income, access to other legal alternatives, and the type of litigation sought or defended.
Market Analysis Summary
Advocates for Legal Equal Access provides legal services to people who do not qualify for other types of legal aid due to economic reasons or because other organizations do not have the time, resources, or specialize in that particular area of law. Advocates for Legal Equal Access maintains constant contact with other legal aid organizations to develop a referral system for the Portland indigent community.
Market Segmentation
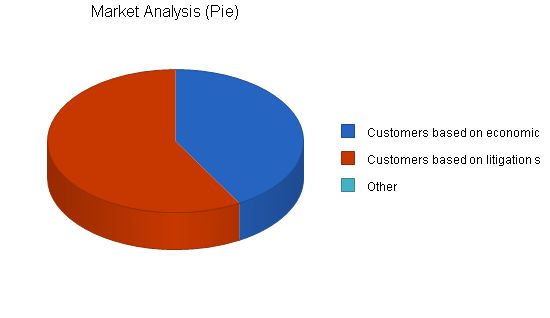
The Advocates’ market can be segmented into two segments:
– People who do not qualify for other legal aid agencies for economic reasons but qualify for Advocates.
– People who have legal needs not currently addressed by existing legal aid agencies.
Market Analysis:
| Year 1 | Year 2 | Year 3 | Year 4 | Year 5 | CAGR | ||
| Potential Customers | Growth | CAGR | |||||
| Customers based on economic restraint | 9% | 22,547 | 24,576 | 26,788 | 29,199 | 31,827 | 9.00% |
| Customers based on litigation subject | 9% | 31,455 | 34,286 | 37,372 | 40,735 | 44,401 | 9.00% |
| Other | 0% | 0 | 0 | 0 | 0 | 0 | 0.00% |
| Total | 9.00% | 54,002 | 58,862 | 64,160 | 69,934 | 76,228 | 9.00% |
4.2 Target Market Segment Strategy
Advocates for Legal Equal Access will target different segments by building relationships with legal aid organizations to obtain new clients when unable to serve.
Advocates will also create awareness by engaging with courts to refer people to them.
If proper agencies and organizations know about Advocates, getting clients won’t be difficult as demand in the legal aid sector exceeds supply.
Strategy and Implementation Summary
Advocates for Legal Equal Access will rely on Al’s marketing and fundraising for raising awareness and soliciting donations. Al’s extensive network will help raise funds and secure donations of time from fellow attorneys.
5.1 Competitive Edge
Advocates for Legal Equal Access’ competitive edge is their effectiveness as fundraisers. The legal aid market has high demand and being able to fund the organization is essential. Advocates founder, Al Rand, has an extensive network and will leverage it to secure donations.
Al’s marketing skills will be used to set up programs with large firms, encouraging more donations of time from attorneys and meeting pro bono requirements.
To develop effective strategies, perform a SWOT analysis of your business. Learn how to perform a SWOT analysis with our free guide and template.
5.2 Marketing Strategy
Advocates for Legal Equal Access will market themselves to law firms for donations of cash and attorneys’ time, and to corporations for financial contributions.
Al will use his marketing skills to promote Advocates as an organization offering support to the greater Portland community.
Approximately 40% of Al’s time will be spent on fundraising/marketing, meeting with leaders of organizations to gain support and legitimacy in the community.
The efficiency and value of donating time to Advocates will be emphasized to convince attorneys to donate their time.
5.3 Fundraising Strategy
This topic was covered in the previous marketing sections since these activities are intertwined in nonprofit organizations.
5.3.1 Funding Forecast
Initial funding will be slow for the first few months. After month four, when the organization has gained visibility, donations will start flowing in regularly, both in terms of fiscal contributions and attorneys’ time.
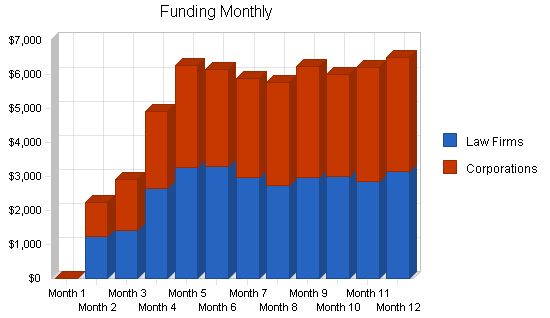
Funding Forecast:
Law Firms
Year 1: $29,546
Year 2: $38,954
Year 3: $38,985
Corporations
Year 1: $29,445
Year 2: $37,455
Year 3: $41,888
Total Funding
Year 1: $58,991
Year 2: $76,409
Year 3: $80,873
Direct Cost of Funding:
Law Firms
Year 1: $0
Year 2: $0
Year 3: $0
Corporations
Year 1: $0
Year 2: $0
Year 3: $0
Subtotal Cost of Funding:
Year 1: $0
Year 2: $0
Year 3: $0
5.4 Milestones:
Advocates for Legal Equal Access will have several milestones early on:
1. Business plan completion: This will be done as a roadmap for the organization, serving as an indispensable tool for ongoing performance and improvement.
2. Set up the office.
3. Official release of the website.
4. The first case won.
5. Donations exceeding $50,000.
Milestones:
Milestone Start Date End Date Budget Manager Department
Business plan completion 1/1/2001 2/1/2001 $0 ABC Marketing
Set up the office 1/1/2001 2/1/2001 $0 ABC Department
Official release of the website 1/1/2001 2/1/2001 $0 ABC Department
The first case won 1/1/2001 4/1/2001 $0 ABC Department
Donations exceeding $50,000 1/1/2001 11/30/2001 $0 ABC Department
Totals
Management Summary:
Al Rand received his Bachelor of Arts from Oberlin College in OH. After college, Al spent two years in Ghana, Africa with the Peace Corps developing sustainable agriculture for local villages. Following his time with the Peace Corps, Al was accepted to Willamette University’s College of Law and Atkinson Graduate School of Management. During his time in school, Al was involved with Willamette’s public interest student organization. Summers were spent working for Stoel Rives, with the hope of gaining experience and participating in their pro bono program after graduation.
Upon graduation, Al accepted an offer from Stoel. He practiced in the domestic affairs corporate divisions for ten years, establishing a network within the legal and corporate community in Portland. After a decade of practice, Al felt he had developed enough skills, networking, and financial stability to start his own nonprofit public interest law firm.
6.1 Personnel Plan:
Al will work full-time for Advocates. Approximately 40% of his time will be spent on marketing/fundraising, with the remaining time dedicated to legal work and administrative/management details. An administrative assistant/paralegal will be hired at month three. These will be the only paid positions.
Advocates for Legal Equal Access will also receive law student interns from Lewis and Clark and Willamette University. Local attorneys will donate their time to assist with the caseload.
Personnel Plan:
Al Year 1: $22,500 Year 2: $33,000 Year 3: $35,000
Adminstrative assistant/paralegal Year 1: $16,000 Year 2: $20,000 Year 3: $20,000
Other Year 1: $0 Year 2: $0 Year 3: $0
Total People 2 2 2
Total Payroll Year 1: $38,500 Year 2: $53,000 Year 3: $55,000
The following sections outline important financial information.
7.1 Important Assumptions:
The following table details important financial assumptions.
General Assumptions:
Plan Month Year 1: 1 Year 2: 2 Year 3: 3
Current Interest Rate 10.00% 10.00% 10.00%
Long-term Interest Rate 10.00% 10.00% 10.00%
Tax Rate 0.00% 0.00% 0.00%
Other 0 0 0
7.2 Projected Surplus or Deficit:
The following table indicates surplus or deficit.
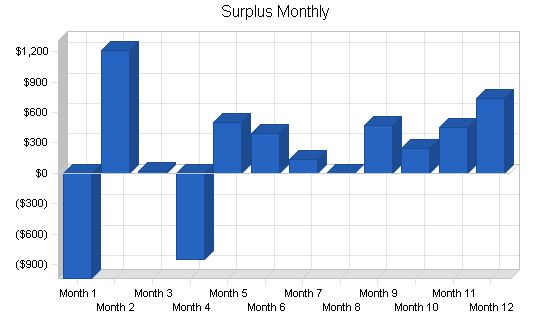
Surplus and Deficit
Year 1 Year 2 Year 3
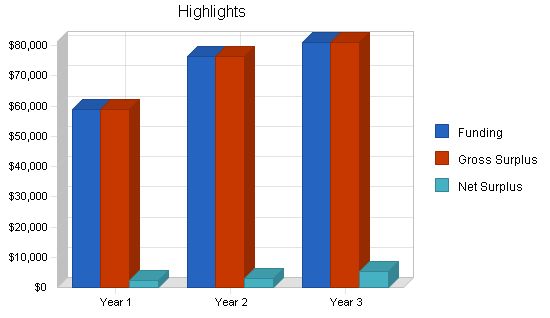
Funding $58,991 $76,409 $80,873
Direct Cost $0 $0 $0
Other Production Expenses $0 $0 $0
Total Direct Cost $0 $0 $0
Gross Surplus $58,991 $76,409 $80,873
Gross Surplus % 100.00% 100.00% 100.00%
Expenses
Payroll $38,500 $53,000 $55,000
Sales and Marketing and Other Expenses $1,200 $1,200 $1,200
Depreciation $936 $936 $936
Web site + DSL $1,620 $1,620 $1,620
Utilities $600 $600 $600
Insurance $2,100 $2,100 $2,100
Rent $6,000 $6,000 $6,000
Payroll Taxes $5,775 $7,950 $8,250
Other $0 $0 $0
Total Operating Expenses $56,731 $73,406 $75,706
Surplus Before Interest and Taxes $2,260 $3,003 $5,167
EBITDA $3,196 $3,939 $6,103
Interest Expense $0 $0 $0
Taxes Incurred $0 $0 $0
Net Surplus $2,260 $3,003 $5,167
Net Surplus/Funding 3.83% 3.93% 6.39%
The Break-even Analysis is shown below.
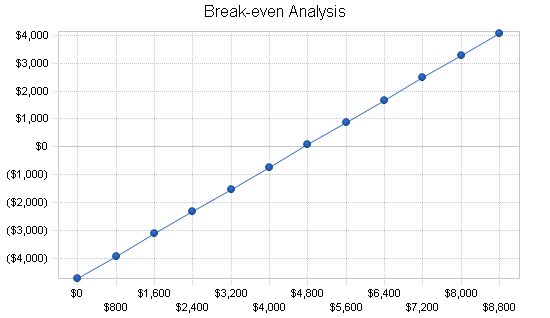
Break-even Analysis:
Monthly Revenue Break-even: $4,728.
Assumptions:
– Average Percent Variable Cost: 0%
– Estimated Monthly Fixed Cost: $4,728.
7.4 Projected Cash Flow:
The chart and table below indicate projected cash flow.
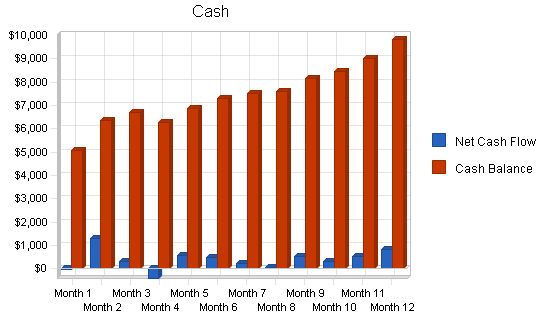
Pro Forma Cash Flow
| Cash Flow | |||
| Year 1 | Year 2 | Year 3 | |
| Cash Received | |||
| Cash from Operations | |||
| Cash Funding | $58,991 | $76,409 | $80,873 |
| Subtotal Cash from Operations | $58,991 | $76,409 | $80,873 |
| Additional Cash Received | |||
| Sales Tax, VAT, HST/GST Received | $0 | $0 | $0 |
| New Current Borrowing | $0 | $0 | $0 |
| New Other Liabilities (interest-free) | $0 | $0 | $0 |
| New Long-term Liabilities | $0 | $0 | $0 |
| Sales of Other Current Assets | $0 | $0 | $0 |
| Sales of Long-term Assets | $0 | $0 | $0 |
| New Investment Received | $0 | $0 | $0 |
| Subtotal Cash Received | $58,991 | $76,409 | $80,873 |
| Expenditures | |||
| Expenditures from Operations | |||
| Cash Spending | $38,500 | $53,000 | $55,000 |
| Bill Payments | $15,773 | $19,392 | $19,745 |
| Subtotal Spent on Operations | $54,273 | $72,392 | $74,745 |
| Additional Cash Spent | |||
| Sales Tax, VAT, HST/GST Paid Out | $0 | $0 | $0 |
| Principal Repayment of Current Borrowing | $0 | $0 | $0 |
| Other Liabilities Principal Repayment | $0 | $0 | $0 |
| Long-term Liabilities Principal Repayment | $0 | $0 | $0 |
| Purchase Other Current Assets | $0 | $0 | $0 |
| Purchase Long-term Assets | $0 | $0 | $0 |
| Dividends | $0 | $0 | $0 |
| Subtotal Cash Spent | $54,273 | $72,392 | $74,745 |
| Net Cash Flow | $4,719 | $4,017 | $6,128 |
| Cash Balance | $9,819 | $13,835 | $19,963 |
Projected Balance Sheet
The following table indicates the projected balance sheet.
| Balance Sheet | |||
| Year 1 | Year 2 | Year 3 | |
| Assets | |||
| Current Assets | |||
| Cash | $9,819 | $13,835 | $19,963 |
| Other Current Assets | $0 | $0 | $0 |
| Total Current Assets | $9,819 | $13,835 | $19,963 |
| Long-term Assets | |||
| Long-term Assets | $4,700 | $4,700 | $4,700 |
| Accumulated Depreciation | $936 | $1,872 | $2,808 |
| Total Long-term Assets | $3,764 | $2,828 | $1,892 |
| Total Assets | $13,583 | $16,663 | $21,855 |
| Liabilities and Capital | Year 1 | Year 2 | Year 3 |
| Current Liabilities | |||
| Accounts Payable | $1,523 | $1,600 | $1,625 |
| Current Borrowing | $0 | $0 | $0 |
| Other Current Liabilities | $0 | $0 | $0 |
| Subtotal Current Liabilities | $1,523 | $1,600 | $1,625 |
| Long-term Liabilities | $0 | $0 | $0 |
| Total Liabilities | $1,523 | $1,600 | $1,625 |
| Paid-in Capital | $10,000 | $10,000 | $10,000 |
| Accumulated Surplus/Deficit | ($200) | $2,060 | $5,063 |
| Surplus/Deficit | $2,260 | $3,003 | $5,167 |
| Total Capital | $12,060 | $15,063 | $20,230 |
| Total Liabilities and Capital | $13,583 | $16,663 | $21,855 |
| Net Worth | $12,060 | $15,063 | $20,230 |
The following table outlines important ratios from the Lawyers industry.
| Ratio Analysis | ||||
| Year 1 | Year 2 | Year 3 | Industry Profile | |
| Funding Growth | 0.00% | 29.53% | 5.84% | 8.50% |
| Percent of Total Assets | ||||
| Other Current Assets | 0.00% | 0.00% | 0.00% | 66.90% |
| Total Current Assets | 72.29% | 83.03% | 91.34% | 75.50% |
| Long-term Assets | 27.71% | 16.97% | 8.66% | 24.50% |
| Total Assets | 100.00% | 100.00% | 100.00% | 100.00% |
| Current Liabilities | 11.21% | 9.60% | 7.44% | 50.20% |
| Long-term Liabilities | 0.00% | 0.00% | 0.00% | 12.90% |
| Total Liabilities | 11.21% | 9.60% | 7.44% | 63.10% |
| Net Worth | 88.79% | 90.40% | 92.56% | 36.90% |
| Percent of Funding | ||||
| Funding | 100.00% | 100.00% | 100.00% | 100.00% |
| Gross Surplus | 100.00% | 100.00% | 100.00% | 0.00% |
| Selling, General & Administrative Expenses | 96.17% | 96.07% | 93.61% | 58.20% |
| Advertising Expenses | 0.00% | 0.00% | 0.00% | 0.
General Assumptions Month 1 Month 2 Month 3 Month 4 Month 5 Month 6 Month 7 Month 8 Month 9 Month 10 Month 11 Month 12 Plan Month 1 2 3 4 5 6 7 8 9 10 11 12 Current Interest Rate 10.00% 10.00% 10.00% 10.00% 10.00% 10.00% 10.00% 10.00% 10.00% 10.00% 10.00% 10.00% 10.00% Long-term Interest Rate 10.00% 10.00% 10.00% 10.00% 10.00% 10.00% 10.00% 10.00% 10.00% 10.00% 10.00% 10.00% 10.00% Tax Rate 0.00% 0.00% 0.00% 0.00% 0.00% 0.00% 0.00% 0.00% 0.00% 0.00% 0.00% 0.00% 0.00% Other 0 0 0 0 0 0 0 0 0 0 0 0 0 Surplus and Deficit Month 1 Month 2 Month 3 Month 4 Month 5 Month 6 Month 7 Month 8 Month 9 Month 10 Month 11 Month 12 Funding $0 $2,245 $2,900 $4,899 $6,254 $6,145 $5,885 $5,750 $6,223 $5,999 $6,201 $6,490 Direct Cost $0 $0 $0 $0 $0 $0 $0 $0 $0 $0 $0 $0 Other Production Expenses $0 $0 $0 $0 $0 $0 $0 $0 $0 $0 $0 $0 $0 Total Direct Cost $0 $0 $0 $0 $0 $0 $0 $0 $0 $0 $0 $0 $0 Gross Surplus $0 $2,245 $2,900 $4,899 $6,254 $6,145 $5,885 $5,750 $6,223 $5,999 $6,201 $6,490 Gross Surplus % 0.00% 100.00% 100.00% 100.00% 100.00% 100.00% 100.00% 100.00% 100.00% 100.00% 100.00% 100.00% 100.00% Expenses Payroll $0 $0 $1,600 $4,100 $4,100 $4,100 $4,100 $4,100 $4,100 $4,100 $4,100 $4,100 $4,100 Sales and Marketing and Other Expenses $100 $100 $100 $100 $100 $100 $100 $100 $100 $100 $100 $100 $100 Depreciation $78 $78 $78 $78 $78 $78 $78 $78 $78 $78 $78 $78 $78 Web site + DSL $135 $135 $135 $135 $135 $135 $135 $135 $135 $135 $135 $135 $135 Utilities $50 $50 $50 $50 $50 $50 $50 $50 $50 $50 $50 $50 $50 Insurance $175 $175 $175 $175 $175 $175 $175 $175 $175 Pro Forma Balance Sheet |
| Pro Forma Balance Sheet | |||||||||||||
| Month 1 | Month 2 | Month 3 | Month 4 | Month 5 | Month 6 | Month 7 | Month 8 | Month 9 | Month 10 | Month 11 | Month 12 | ||
| Assets | Starting Balances | ||||||||||||
| Cash | $5,100 | $5,068 | $6,353 | $6,685 | $6,272 | $6,851 | $7,321 | $7,531 | $7,606 | $8,154 | $8,478 | $9,004 | $9,819 |
| Other Current Assets | $0 | $0 | $0 | $0 | $0 | $0 | $0 | $0 | $0 | $0 | $0 | $0 | $0 |
| Total Current Assets | $5,100 | $5,068 | $6,353 | $6,685 | $6,272 | $6,851 | $7,321 | $7,531 | $7,606 | $8,154 | $8,478 | $9,004 | $9,819 |
| Long-term Assets | |||||||||||||
| Long-term Assets | $4,700 | $4,700 | $4,700 | $4,700 | $4,700 | $4,700 | $4,700 | $4,700 | $4,700 | $4,700 | $4,700 | $4,700 | $4,700 |
| Accumulated Depreciation | $0 | $78 | $156 | $234 | $312 | $390 | $468 | $546 | $624 | $702 | $780 | $858 | $936 |
| Total Long-term Assets | $4,700 | $4,622 | $4,544 | $4,466 | $4,388 | $4,310 | $4,232 | $4,154 | $4,076 | $3,998 | $3,920 | $3,842 | $3,764 |
| Total Assets | $9,800 | $9,690 | $10,897 | $11,151 | $10,660 | $11,161 | $11,553 | $11,685 | $11,682 | $12,152 | $12,398 | $12,846 | $13,583 |
| Liabilities and Capital | |||||||||||||
| Month 1 | Month 2 | Month 3 | Month 4 | Month 5 | Month 6 | Month 7 | Month 8 | Month 9 | Month 10 | Month 11 | Month 12 | ||
| Current Liabilities | |||||||||||||
| Accounts Payable | $0 | $928 | $928 | $1,160 | $1,523 | $1,523 | $1,523 | $1,523 | $1,523 | $1,523 | $1,523 | $1,523 | $1,523 |
| Current Borrowing | $0 | $0 | $0 | $0 | $0 | $0 | $0 | $0 | $0 | $0 | $0 | $0 | $0 |
| Other Current Liabilities | $0 | $0 | $0 | $0 | $0 | $0 | $0 | $0 | $0 | $0 | $0 | $0 | $0 |
| Subtotal Current Liabilities | $0 | $928 | $928 | $1,160 | $1,523 | $1,523 | $1,523 | $1,523 | $1,523 | $1,523 | $1,523 | $1,523 | $1,523 |
| Long-term Liabilities | $0 | $0 | $0 | $0 | $0 | $0 | $0 | $0 | $0 | $0 | $0 | $0 | $0 |
| Total Liabilities | $0 | $928 | $928 | $1,160 | $1,523 | $1,523 | $1,523 | $1,523 | $1,523 | $1,523 | $1,523 | $1,523 | $1,523 |
| Paid-in Capital | $10,000 | $10,000 | $10,000 | $10,000 | $10,000 | $10,000 | $10,000 | $10,000 | $10,000 | $10,000 | $10,000 | $10,000 | $10,000 |
| Accumulated Surplus/Deficit | ($200) | ($200) | ($200) | ($200) | ($200) | ($200) | ($200) | ($200) | ($200) | ($200) | ($200) | ($200) | ($200) |
| Surplus/Deficit | $0 | ($1,038) | $169 | $191 | ($663) | ($162) | $230 | $362 | $359 | $829 | $1,075 | $1,523 | $2,260 |
| Total Capital | $9,800 | $8,762 | $9,969 | $9,991 | $9,137 | $9,638 | $10,030 | $10,162 | $10,159 | $10,629 | $10,875 | $11,323 | $12,060 |
| Total Liabilities and Capital | $9,800 | $9,690 | $10,897 | $11,151 | $10,660 | $11,161 | $11,553 | $11,685 | $11,682 | $12,152 | $12,398 | $12,846 | $13,583 |
| Net Worth | $9,800 | $8,762 | $9,969 | $9,991 | $9,137 | $9,638 | $10,030 | $10,162 | $10,159 | $10,629 | $10,875 | $11,323 | $12,060 |

Business Plan Outline
- Executive Summary
- Organization Summary
- Services
- Market Analysis Summary
- Strategy and Implementation Summary
- Management Summary
- Financial Plan
- Appendix
Hello!
I’m Andrew Brooks, a seasoned finance consultant from the USA and the mind behind phonenumber247.com.
My career is built on a foundation of helping individuals and businesses thrive financially in an ever-changing economic landscape. At phonenumber247.com, my aim is to demystify the complex world of finance, providing clear, actionable advice that can help you navigate your financial journey with confidence. Whether it’s personal finance management, investment strategies, or understanding the nuances of market dynamics, I’m here to share insights and tools that can propel you towards your financial goals.
Welcome to my digital space, where every piece of advice is a step closer to financial clarity and success!
