Contents
Custom Pottery Business Plan
Kaolin Calefactors (KC) is an Oregon company that designs and manufactures custom dishware. Sue Glazer specializes in modern and popular art. The typical customer is someone looking for a unique handmade gift or unusual everyday dishware.
Kaolin Calefactors is a unique business that allows Sue Glazer to combine her love for ceramics and turn it into a profitable venture.
Kaolin Calefactors will gain market share in the custom dishware niche by offering a customer-centric business model. Profitability is expected by month nine, with projected revenues of $78,000 by year three.
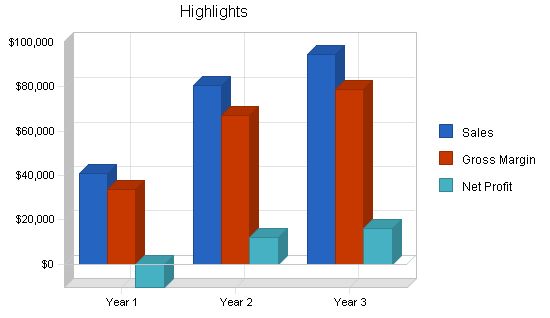
1.1 Objectives
The objectives for the first three years of operation:
- To create a company that exceeds customer’s expectations.
- To increase the number of custom clients by 20% annually.
- To develop a sustainable start-up business that leverages a hobby.
1.2 Mission
Kaolin Calefactors’ mission is to design and construct the finest dishware pottery, attracting and maintaining customers. Our services exceed customer expectations.
1.3 Keys to Success
The key to success is innovative design and a customer-centric approach.
Company Summary
Kaolin Calefactors is an Eugene, OR based start-up company that handcrafts production and custom ceramic dishware. KC sells their products in local crafts stores, craft fairs, and their website.
2.1 Company Ownership
Kaolin Calefactors is a sole proprietorship founded and owned by Sue Glazer.
2.2 Start-up Summary
Kaolin Calefactors will incur the following start-up costs:
- Computer system with a CD-RW, printer, Microsoft Office, and QuickBooks Pro.
- Commercial kiln.
- Electric potters wheel.
- Storage containers for clay and glazes.
- Assorted tools for trimming, edging, and glazing.
- Shelves and large tables for storage and workspaces.
- Website development.
Note that assets used for more than a year will be labeled long-term assets and depreciated using G.A.A.P. approved straight-line depreciation method.
| Start-up | |
| Requirements | |
| Start-up Expenses | |
| Legal | $500 |
| Website development | $0 |
| Brochures | $150 |
| Other | $0 |
| Total Start-up Expenses | $650 |
| Start-up Assets | |
| Cash Required | $11,750 |
| Other Current Assets | $0 |
| Long-term Assets | $5,600 |
| Total Assets | $17,350 |
| Total Requirements | $18,000 |
| Start-up Funding | |
| Start-up Expenses to Fund | $650 |
| Start-up Assets to Fund | $17,350 |
| Total Funding Required | $18,000 |
| Assets | |
| Non-cash Assets from Start-up | $5,600 |
| Cash Requirements from Start-up | $11,750 |
| Additional Cash Raised | $0 |
| Cash Balance on Starting Date | $11,750 |
| Total Assets | $17,350 |
| Liabilities and Capital | |
| Liabilities | |
| Current Borrowing | $0 |
| Long-term Liabilities | $0 |
| Accounts Payable (Outstanding Bills) | $0 |
| Other Current Liabilities (interest-free) | $0 |
| Total Liabilities | $0 |
| Capital | |
| Planned Investment | |
| Sue | $18,000 |
| Investor 2 | $0 |
| Other | $0 |
| Additional Investment Requirement | $0 |
| Total Planned Investment | $18,000 |
| Loss at Start-up (Start-up Expenses) | ($650) |
| Total Capital | $17,350 |
| Total Capital and Liabilities | $17,350 |
| Total Funding | $18,000 |
Products
Kaolin Calefactors makes production and custom dishware. KC manufactures 12 production styles of dishware as well as offers custom designs based on past creations or customer’s own ideas.
Please note that the term production refers to items made for inventory regardless of whether there is an order for them. Production, in this case, does not imply "mass production."
The offered dishware includes serving platters, dinner plates, bowls, coffee cups, saucers, and additional requested pieces. They come in different shapes and glazing options. Kaolin Calefactors products are high-quality, handmade pieces that can be customized to the customer’s preferences. The price/positioning strategy targets the high-end market.
Market Analysis Summary
The market can be divided into two groups: gift purchasers and end consumers. 80% of the consumer market for pottery comprises of adult females.
4.1 Market Segmentation
The market can be segmented into two groups:
- People purchasing pottery as gifts, looking for unique and standout designs. They often choose from the production line.
- People buying pottery for themselves, often opting for custom designs to match their specific style. Custom work is more expensive and unique, appealing to those buying for personal use.
| Market Analysis | |||||||
| Year 1 | Year 2 | Year 3 | Year 4 | Year 5 | |||
| Potential Customers | Growth | CAGR | |||||
| Gift purchasers | 8% | 21,455 | 23,171 | 25,025 | 27,027 | 29,189 | 8.00% |
| End consumers | 9% | 19,886 | 21,676 | 23,627 | 25,753 | 28,071 | 9.00% |
| Total | 8.48% | 41,341 | 44,847 | 48,652 | 52,780 | 57,260 | 8.48% |
4.2 Target Market Segment Strategy
Targeting these two groups involves increasing visibility for Kaolin Calefactors in areas where individuals interested in fine, handmade dishware are likely to be found. This includes participating in local craft fairs, which gather various craftspeople to showcase their creations, attracting those seeking unique handmade designs.
Kaolin Calefactors will also have a comprehensive website displaying production designs and Sue’s portfolio of past and present designs, serving as inspiration for custom designs.
In addition, each product includes an information card promoting Kaolin Calefactors, Sue, and the website, particularly useful for retail sales in craft stores. The flyer encourages visits to the website to explore the infinite number of custom designs available.
4.3 Industry Analysis
The craft industry comprises of woodworkers, ceramic artists, doll painters, and jewelers. Most craftspeople attend weekend craft shows while maintaining other jobs. Combining a hobby with a minor money-making venture is common in this industry.
A minority of craftsmen, like Sue, transition their hobby into a full-time job.
While most craftspeople work at home, potters typically require dedicated space due to their equipment and different phases of pottery production, such as drying, kilning, and glazing.
4.3.1 Competition and Buying Patterns
Competition comes from various sources:
- Commercial dishware manufacturers targeting those seeking general dishware based on function rather than aesthetics.
- Assorted craftspeople catering to those purchasing ceramics as gifts.
- Other potters, who are direct competitors but often not involved in producing competing dishware, focusing on cups and vases.
Strategy and Implementation Summary
The strategy for building customers revolves around Kaolin Calefactors’ customer-centric approach, involving customers in the design and production process of their dishware.
5.1 Competitive Edge
Kaolin Calefactors’ competitive edge lies in their customer-centric approach, visible in the collaboration between Sue and the customer to create the perfect design. This approach is both intuitive and effective, as it prioritizes customer satisfaction and loyalty.
5.2 Sales Strategy
The sales strategy focuses on emphasizing the pride and appreciation that comes with owning production or custom dishware. Dishware is used daily and influences the food presentation, making it a long-term investment. Customers are engaged in the creation process, enhancing the overall experience.
5.2.1 Sales Forecast
The first month will be dedicated to setting up the work studio, establishing retail sales outlets, scheduling craft fairs, and designing the website. Business will gradually increase from month two to month five.
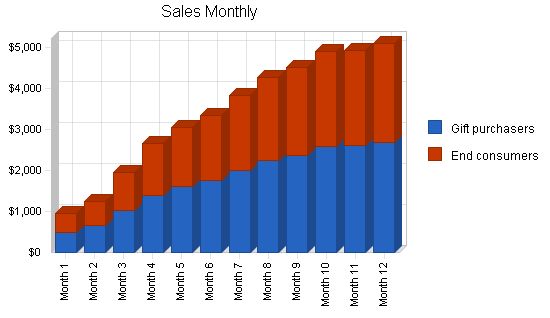
| Sales Forecast | |||
| Year 1 | Year 2 | Year 3 | |
| Sales | |||
| Gift purchasers | $21,436 | $42,457 | $49,854 |
| End consumers | $19,292 | $38,211 | $44,869 |
| Total Sales | $40,728 | $80,668 | $94,723 |
| Direct Cost of Sales | Year 1 | Year 2 | Year 3 |
| Gift purchasers | $3,644 | $7,218 | $8,475 |
| End consumers | $3,280 | $6,496 | $7,628 |
| Subtotal Direct Cost of Sales | $6,924 | $13,714 | $16,103 |
5.3 Milestones
Kaolin Calefactors milestones:
- Business plan completion: roadmap for the organization to improve performance.
- Office/work space set up.
- Establishment of retail sales outlets.
| Milestones | |||||
| Milestone | Start Date | End Date | Budget | Manager | Department |
| Business plan completion | 1/1/2001 | 2/1/2001 | $0 | ABC | Marketing |
| Office/work space set up | 1/1/2001 | 2/1/2001 | $0 | ABC | Department |
| Establishment of retail sales outlets | 1/1/2001 | 3/1/2001 | $0 | ABC | Department |
| Totals | $0 | ||||
Management Summary
Sue Glazer has a Bachelor of Arts from Washington and Jefferson. After taking various classes, including ceramics, she pursued her Masters in Art at Carnegie Mellon University.
After completing her academic program, she taught ceramics at W&J for four years before moving to the Pacific Northwest.
6.1 Personnel Plan
Kaolin Calefactors is a sole proprietorship with Sue as the only employee. She will be responsible for strategic relationships, administrative details, and creating the art.
| Personnel Plan | |||
| Year 1 | Year 2 | Year 3 | |
| Sue | $30,000 | $35,000 | $40,000 |
| Other | $0 | $0 | $0 |
| Total People | 1 | 1 | 1 |
| Total Payroll | $30,000 | $35,000 | $40,000 |
Financial Plan
The following sections outline important financial information.
Please note that there is a discrepancy in the Ratios table under gross margin and selling/general and administrative expense categories. This is due to the categorization of costs relative to the industry average.
7.1 Important Assumptions
The table below details important financial assumptions.
| General Assumptions | |||
| Year 1 | Year 2 | Year 3 | |
| Plan Month | 1 | 2 | 3 |
| Current Interest Rate | 10.00% | 10.00% | 10.00% |
| Long-term Interest Rate | 10.00% | 10.00% | 10.00% |
| Tax Rate | 30.00% | 30.00% | 30.00% |
| Other | 0 | 0 | 0 |
7.2 Break-even Analysis
The Break-even Analysis indicates that approximately $4,400 in monthly revenue is needed to reach the break-even point.
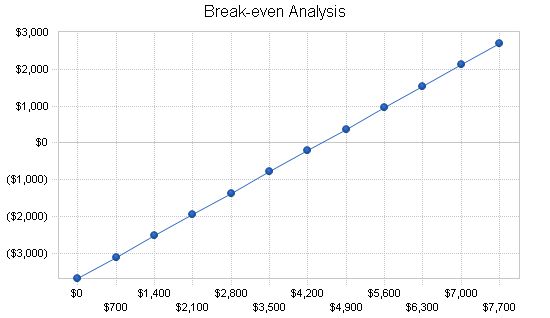
Break-even Analysis
Monthly Revenue Break-even: $4,449
Assumptions:
Average Percent Variable Cost: 17%
Estimated Monthly Fixed Cost: $3,693
Projected Profit and Loss
Pro Forma Profit and Loss
Year 1 Year 2 Year 3
Sales $40,728 $80,668 $94,723
Direct Cost of Sales $6,924 $13,714 $16,103
Other Production Expenses $0 $0 $0
Total Cost of Sales $6,924 $13,714 $16,103
Gross Margin $33,805 $66,955 $78,620
Gross Margin % 83.00% 83.00% 83.00%
Expenses
Payroll $30,000 $35,000 $40,000
Sales and Marketing and Other Expenses $2,100 $1,900 $1,700
Depreciation $1,116 $1,116 $1,116
Leased Equipment $0 $0 $0
Utilities/ DSL/ web hosting $1,800 $1,800 $1,800
Insurance $600 $600 $600
Rent $4,200 $4,200 $4,200
Payroll Taxes $4,500 $5,250 $6,000
Other $0 $0 $0
Total Operating Expenses $44,316 $49,866 $55,416
Profit Before Interest and Taxes ($10,511) $17,089 $23,204
EBITDA ($9,395) $18,205 $24,320
Interest Expense $0 $0 $0
Taxes Incurred $0 $5,127 $6,961
Net Profit ($10,511) $11,962 $16,243
Net Profit/Sales -25.81% 14.83% 17.15%
Projected Cash Flow
The following chart and table will indicate projected cash flow.
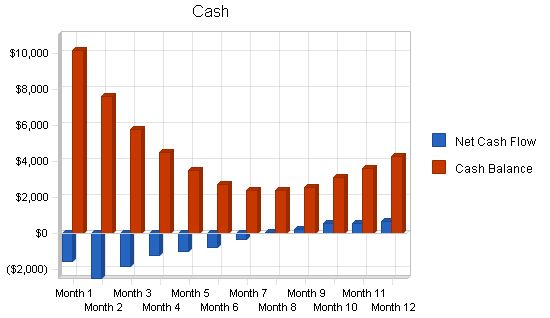
| Pro Forma Cash Flow | |||
| Year 1 | Year 2 | Year 3 | |
| Cash Received | |||
| Cash from Operations | |||
| Cash Sales | $40,728 | $80,668 | $94,723 |
| Subtotal Cash from Operations | $40,728 | $80,668 | $94,723 |
| Additional Cash Received | |||
| Sales Tax, VAT, HST/GST Received | $0 | $0 | $0 |
| New Current Borrowing | $0 | $0 | $0 |
| New Other Liabilities (interest-free) | $0 | $0 | $0 |
| New Long-term Liabilities | $0 | $0 | $0 |
| Sales of Other Current Assets | $0 | $0 | $0 |
| Sales of Long-term Assets | $0 | $0 | $0 |
| New Investment Received | $0 | $0 | $0 |
| Subtotal Cash Received | $40,728 | $80,668 | $94,723 |
| Expenditures | Year 1 | Year 2 | Year 3 |
| Expenditures from Operations | |||
| Cash Spending | $30,000 | $35,000 | $40,000 |
| Bill Payments | $18,222 | $31,814 | $36,972 |
| Subtotal Spent on Operations | $48,222 | $66,814 | $76,972 |
| Additional Cash Spent | |||
| Sales Tax, VAT, HST/GST Paid Out | $0 | $0 | $0 |
| Principal Repayment of Current Borrowing | $0 | $0 | $0 |
| Other Liabilities Principal Repayment | $0 | $0 | $0 |
| Long-term Liabilities Principal Repayment | $0 | $0 | $0 |
| Purchase Other Current Assets | $0 | $0 | $0 |
| Purchase Long-term Assets | $0 | $0 | $0 |
| Dividends | $0 | $0 | $0 |
| Subtotal Cash Spent | $48,222 | $66,814 | $76,972 |
| Net Cash Flow | ($7,493) | $13,854 | $17,751 |
| Cash Balance | $4,257 | $18,111 | $35,862 |
7.5 Projected Balance Sheet
The following table indicates the projected balance sheet.
| Pro Forma Balance Sheet | |||
| Year 1 | Year 2 | Year 3 | |
| Assets | |||
| Cash | $4,257 | $18,111 | $35,862 |
| Other Current Assets | $0 | $0 | $0 |
| Total Current Assets | $4,257 | $18,111 | $35,862 |
| Long-term Assets | |||
| Long-term Assets | $5,600 | $5,600 | $5,600 |
| Accumulated Depreciation | $1,116 | $2,232 | $3,348 |
| Total Long-term Assets | $4,484 | $3,368 | $2,252 |
| Total Assets | $8,741 | $21,479 | $38,114 |
| Liabilities and Capital | Year 1 | Year 2 | Year 3 |
| Current Liabilities | |||
| Accounts Payable | $1,902 | $2,679 | $3,071 |
| Current Borrowing | $0 | $0 | $0 |
| Other Current Liabilities | $0 | $0 | $0 |
| Subtotal Current Liabilities | $1,902 | $2,679 | $3,071 |
| Long-term Liabilities | $0 | $0 | $0 |
| Total Liabilities | $1,902 | $2,679 | $3,071 |
| Paid-in Capital | $18,000 | $18,000 | $18,000 |
| Retained Earnings | ($650) | ($11,161) | $801 |
| Earnings | ($10,511) | $11,962 | $16,243 |
| Total Capital | $6,839 | $18,801 | $35,043 |
| Total Liabilities and Capital | $8,741 | $21,479 | $38,114 |
| Net Worth | $6,839 | $18,801 | $35,043 |
7.6 Business Ratios
The following Ratios table compares standard ratios based on the Standard Industry Code #3269, Pottery Products, to the planned numbers for Kaolin Calefactors.
| Ratio Analysis | ||||
| Year 1 | Year 2 | Year 3 | Industry Profile | |
| Sales Growth | 0.00% | 98.06% | 17.42% | 5.10% |
| Percent of Total Assets | ||||
| Other Current Assets | 0.00% | 0.00% | 0.00% | 39.20% |
| Total Current Assets | 48.70% | 84.32% | 94.09% | 76.70% |
| Long-term Assets | 51.30% | 15.68% | 5.91% | 23.30% |
| Total Assets | 100.00% | 100.00% | 100.00% | 100.00% |
| Current Liabilities | ||||
| Accounts Payable | 21.76% | 12.47% | 8.06% | 34.10% |
| Long-term Liabilities | 0.00% | 0.00% | 0.00% | 19.80% |
| Total Liabilities | 21.76% | 12.47% | 8.06% | 53.90% |
| Net Worth | 78.24% | 87.53% | 91.94% | 46.10% |
| Percent of Sales | ||||
| Sales | 100.00% | 100.00% | 100.00% | 100.00% |
| Gross Margin | 83.00% | 83.00% | 83.00% | 38.40% |
| Selling, General & Administrative Expenses | 108.81% | 68.17% | 65.85% | 21.60% |
| Advertising Expenses | 2.21% | 1.12% | 0.95% | 1.20% |
| Profit Before Interest and Taxes | -25.81% | 21.18% | 24.50% | 2.80% |
| Main Ratios | ||||
| Current | 2.24 | 6.76 | 11.68 | 1.77 |
| Quick | 2.24 | 6.76 | 11.68 | 1.01 |
| Total Debt to Total Assets | 21.76% | 12.47% | 8.06% | 53.90% |
| Pre-tax Return on Net Worth | -153.71% | 90.89% | 66.21% | 3.40% |
| Pre-tax Return on Assets | -120.26% | 79.56% | 60.88% | 7.40% |
| Additional Ratios | Year 1 | Year 2 | Year 3 | |
| Net Profit Margin | -25.81% | 14.83% | 17.15% | n/a |
| Return on Equity | -153.71% | 63.63% | 46.35% | n/a |
| Activity Ratios | ||||
| Accounts Payable Turnover | 10.58 | 12.17 | 12.17 | n/a |
| Payment Days | 27 | 26 | 28 | n/a |
| Total Asset Turnover | 4.66 | 3.76 | 2.49 | n/a |
| Debt Ratios | ||||
| Debt to Net Worth | 0.28 | 0.14 | 0.09 | n/a |
| Current Liab. to Liab. | 1.00 | 1.00 | 1.00 | n/a |
| Liquidity Ratios | ||||
| Net Working Capital | $2,355 | $15,433 | $32,791 | n/a |
| Interest Coverage | 0.00 | 0.00 | 0.00 | n/a |
| Additional Ratios | ||||
| Assets to Sales | 0.21 | 0.27 | 0.40 | n/a |
| Pro Forma Balance Sheet | |||||||||||||
| Month 1 | Month 2 | Month 3 | Month 4 | Month 5 | Month 6 | Month 7 | Month 8 | Month 9 | Month 10 | Month 11 | Month 12 | ||
| Assets | Starting Balances | ||||||||||||
| Current Assets | |||||||||||||
| Cash | $11,750 | $10,158 | $7,630 | $5,763 | $4,488 | $3,474 | $2,696 | $2,352 | $2,364 | $2,556 | $3,084 | $3,593 | $4,257 |
| Other Current Assets | $0 | $0 | $0 | $0 | $0 | $0 | $0 | $0 | $0 | $0 | $0 | $0 | $0 |
| Total Current Assets | $11,750 | $10,158 | $7,630 | $5,763 | $4,488 | $3,474 | $2,696 | $2,352 | $2,364 | $2,556 | $3,084 | $3,593 | $4,257 |
| Long-term Assets | |||||||||||||
| Long-term Assets | $5,600 | $5,600 | $5,600 | $5,600 | $5,600 | $5,600 | $5,600 | $5,600 | $5,600 | $5,600 | $5,600 | $5,600 | $5,600 |
| Accumulated Depreciation | $0 | $93 | $186 | $279 | $372 | $465 | $558 | $651 | $744 | $837 | $930 | $1,023 | $1,116 |
| Total Long-term Assets | $5,600 | $5,507 | $5,414 | $5,321 | $5,228 | $5,135 | $5,042 | $4,949 | $4,856 | $4,763 | $4,670 | $4,577 | $4,484 |
| Total Assets | $17,350 | $15,665 | $13,044 | $11,084 | $9,716 | $8,609 | $7,738 | $7,301 | $7,220 | $7,319 | $7,754 | $8,170 | $8,741 |
| Liabilities and Capital | |||||||||||||
| Current Liabilities | |||||||||||||
| Accounts Payable | $0 | $1,219 | $1,266 | $1,383 | $1,500 | $1,563 | $1,612 | $1,692 | $1,764 | $1,806 | $1,868 | $1,875 | $1,902 |
| Current Borrowing | $0 | $0 | $0 | $0 | $0 | $0 | $0 | $0 | $0 | $0 | $0 | $0 | $0 |
| Other Current Liabilities | $0 | $0 | $0 | $0 | $0 | $0 | $0 | $0 | $0 | $0 | $0 | $0 | $0 |
| Subtotal Current Liabilities | $0 | $1,219 | $1,266 | $1,383 | $1,500 | $1,563 | $1,612 | $1,692 | $1,764 | $1,806 | $1,868 | $1,875 | $1,902 |
| Long-term Liabilities | $0 | $0 | $0 | $0 | $0 | $0 | $0 | $0 | $0 | $0 | $0 | $0 | $0 |
| Total Liabilities | $0 | $1,219 | $1,266 | $1,383 | $1,500 | $1,563 | $1,612 | $1,692 | $1,764 | $1,806 | $1,868 | $1,875 | $1,902 |
| Paid-in Capital | $18,000 | $18,000 | $18,000 | $18,000 | $18,000 | $18,000 | $18,000 | $18,000 | $18,000 | $18,000 | $18,000 | $18,000 | $18,000 |
| Retained Earnings | ($650) | ($650) | ($650) | ($650) | ($650) | ($650) | ($650) | ($650) | ($650) | ($650) | ($650) | ($650) | ($650) |
| Earnings | $0 | ($2,905) | ($5,572) | ($7,649) | ($9,134) | ($10,304) | ($11,225) | ($11,742) | ($11,894) | ($11,837) | ($11,465) | ($11,056) | ($10,511) |
| Total Capital | $17,350 | $14,446 | $11,778 | $9,701 | $8,216 | $7,046 | $6,125 | $5,608 | $5,456 | $5,513 | $5,885 | $6,294 | $6,839 |
| Total Liabilities and Capital | $17,350 | $15,665 | $13,044 | $11,084 | $9,716 | $8,609 | $7,738 | $7,301 | $7,220 | $7,319 | $7,754 | $8,170 | $8,741 |
| Net Worth | $17,350 | $14,446 | $11,778 | $9,701 | $8,216 | $7,046 | $6,125 | $5,608 | $5,456 | $5,513 | $5,885 | $6,294 | $6,839 |

Business Plan Outline
- Executive Summary
- Company Summary
- Products
- Market Analysis Summary
- Strategy and Implementation Summary
- Management Summary
- Financial Plan
- Appendix
Hello!
I’m Andrew Brooks, a seasoned finance consultant from the USA and the mind behind phonenumber247.com.
My career is built on a foundation of helping individuals and businesses thrive financially in an ever-changing economic landscape. At phonenumber247.com, my aim is to demystify the complex world of finance, providing clear, actionable advice that can help you navigate your financial journey with confidence. Whether it’s personal finance management, investment strategies, or understanding the nuances of market dynamics, I’m here to share insights and tools that can propel you towards your financial goals.
Welcome to my digital space, where every piece of advice is a step closer to financial clarity and success!
