Automotive Repair – Sales – Valet Business Plan
Mad Keen Motors is a family-owned business located in Backwater Downs, a suburb of London. It has been under the ownership of the Keen family for 35 years and has grown from a single mechanical repair shop to five locations that deal with body and mechanical repairs, vehicle storage and towing, washing and valeting, and used car sales.
This plan is an internal document, outlining the effects of adding a website to the company. The Mad Keen Motors website will act as an additional customer service element for all our garages, offering advice on car maintenance, information about our services, staff, and location, and discount offers for website visitors on featured repairs and maintenance.
Our current customer service is excellent but requires potential customers to actively contact the company to learn about us. Most of our new business comes from referrals from current satisfied customers. We hope to make the referral process easier by encouraging existing customers to point out our website to their friends, colleagues, neighbors, and family members, building familiarity with our company long before they need emergency car care or consider buying another car. The "advice" section will establish customers’ trust in our expertise, as will our affiliation with nationally-syndicated car experts.
By helping local customers help themselves, Mad Keen hopes to build trust and relationships with existing and potential customers.
1.1 Mission
Mad Keen Motors provides excellent automotive care and service to all our customers, whether they need to buy a used car, contract major bodywork, or get a simple wash and wax.
1.2 Keys to Success
The keys to the company’s website success will be:
- Compiling an extensive and thorough listing of questions and answers to encourage customers to return to the site whenever they have a problem with their cars.
- Providing additional expert advice for unanswered questions in a timely and thorough manner.
- Offering web-based promotions to encourage customers to book cars into the garage through the website.
- Communicating the site’s existence to local businesses and residents.
- Getting existing customers to recommend the website to others.
1.3 Objectives
The objectives of the Mad Keen Motors website are:
- To drive traffic from the website to the garage.
- To expand the community of Mad Keen Motors customers.
- To provide customers with a substantial list of questions and answers regarding typical car repairs.
- To allow convenient bookings for service and repairs.
Mad Keen Motors is a family-owned business in Backwater Downs, London. Owned by the Keen family for 35 years, it has expanded from one repair shop to five locations offering body and mechanical repairs, vehicle storage and towing, washing and valeting, and used car sales.
2.1 Company History:
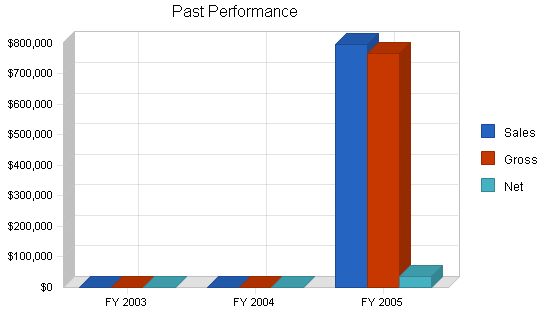
Mad Keen Motors has been successful, with annual net profits surpassing £30,000 for the past two years. We reduced the marketing budget last year, resulting in a slight sales decline. To compensate, we allocated the saved funds (and more) to create a website, aiming to boost overall sales and net profits. The table only presents last year’s performance.
Past Performance:
FY 2003 FY 2004 FY 2005
Sales £0 £0 £798,000
Gross Margin £0 £0 £767,853
Gross Margin % 0.00% 0.00% 96.22%
Operating Expenses £0 £0 £695,820
Inventory Turnover 0.00 0.00 5.01
Balance Sheet:
FY 2003 FY 2004 FY 2005
Current Assets:
Cash £0 £0 £203,488
Inventory £0 £0 £12,040
Other Current Assets £0 £0 £70,000
Total Current Assets £0 £0 £285,528
Long-term Assets:
Long-term Assets £0 £0 £1,250,000
Accumulated Depreciation £0 £0 £15,000
Total Long-term Assets £0 £0 £1,235,000
Total Assets £0 £0 £1,520,528
Current Liabilities:
Accounts Payable £0 £0 £20,000
Current Borrowing £0 £0 £0
Other Current Liabilities (interest free) £0 £0 £0
Total Current Liabilities £0 £0 £20,000
Long-term Liabilities:
Total Liabilities £0 £0 £770,000
Paid-in Capital £0 £0 £400,000
Retained Earnings £0 £0 £314,488
Earnings £0 £0 £36,040
Total Capital £0 £0 £750,528
Total Capital and Liabilities £0 £0 £1,520,528
Other Inputs:
Payment Days 0 0 30
Products and Services:
Mad Keen Motors offers body and mechanical repairs, vehicle storage and towing, washing and valeting, and used car sales.
Market Analysis Summary:
Mad Keen will target the following market segments with its website:
1. New car owners
2. Older luxury car owners
3. Sports car owners
4. Lifetime owners
5. Buyers
4.1 Market Segmentation:
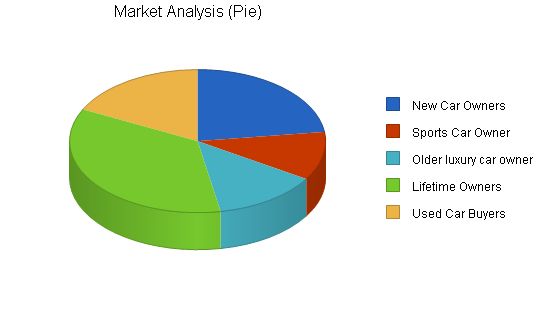
Mad Keen Motors segments its customers by type of car ownership. We believe that the type of car a person owns says volumes about their driving and therefore their garage requirements.
New car owners: Owners of newer cars are likely not to use the company’s garage repair service. If they have problems with their car, they will return to the dealer where they bought it. However, these owners will bring their cars often to the wash and valet service. The goal with these customers is to promote regular use of the wash and valet service. Eventually, as their warranty runs out, the goal will be to sell them on the efficiency, excellent service, and price competitiveness of Mad Keen Motors’ repair services.
Market Analysis
| Market Analysis | |||||||
| 2005 | 2006 | 2007 | 2008 | 2009 | |||
| New Car Owners | 2% | 52,000 | 53,040 | 54,101 | 55,183 | 56,287 | 2.00% |
| Sports Car Owner | 5% | 25,000 | 26,250 | 27,563 | 28,941 | 30,388 | 5.00% |
| Older luxury car owner | 10% | 30,000 | 33,000 | 36,300 | 39,930 | 43,923 | 10.00% |
| Lifetime Owners | 2% | 80,000 | 81,600 | 83,232 | 84,897 | 86,595 | 2.00% |
| Used Car Buyers | 12% | 40,000 | 44,800 | 50,176 | 56,197 | 62,941 | 12.00% |
| Total | 5.40% | 227,000 | 238,690 | 251,372 | 265,148 | 280,134 | 5.40% |
4.2 Target Market Segment Strategy
We target owners of older cars or cars in need of maintenance to maximize revenue.
4.3 Service Business Analysis
The garage repair business is fragmented. Major dealerships exist, alongside smaller repair shops like Mad Keen Motors. Dealers target new and used car buyers, while small garages gain customers through word of mouth and emergency car care needs.
4.3.1 Competition and Buying Patterns
Word of mouth is crucial in the car repair business. Mad Keen Motors leads local competition through decades of reliable service. Dealerships face competition as car design becomes more specialized, but small garages like Mad Keen offer lower prices for repair work.
Strategy and Implementation Summary
Due to a limited marketing budget, we will rely on grassroots and viral marketing to promote the website. The business’s narrow geographical focus does not require extensive advertising. We will communicate with neighbors, nearby businesses, and existing customers to spread awareness of the website.
5.1 Competitive Edge
The website’s competitive advantage includes providing a local service, drawing from 60 years of automobile repair experience, and offering an additional communication channel for customers. The website improves convenience by enabling online bookings and faster customer service.
To develop effective strategies, perform a SWOT analysis of your business using our free guide and template. Learn how to perform a SWOT analysis.
5.2 Marketing Strategy
We will tailor different sections of the website to target each car-owning group identified in the Market Segmentation.
Our marketing strategy involves mailing fliers to existing customers, neighbors, and nearby businesses. The fliers will include a special savings code, providing a 10% discount on the next visit when entered on the website.
5.3 Sales Strategy
We prioritize customer service, maintaining attractive and clean facilities, and preparing prompt repair work estimates. Building trust with customers is crucial since they often shop around for a trustworthy garage.
5.3.1 Sales Forecast
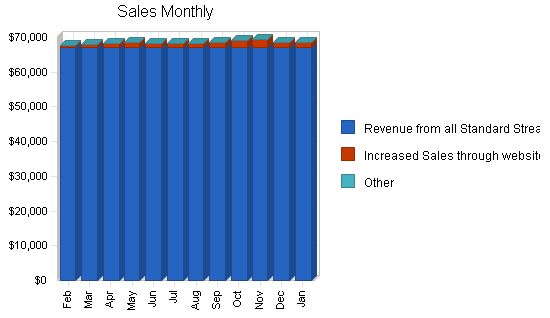
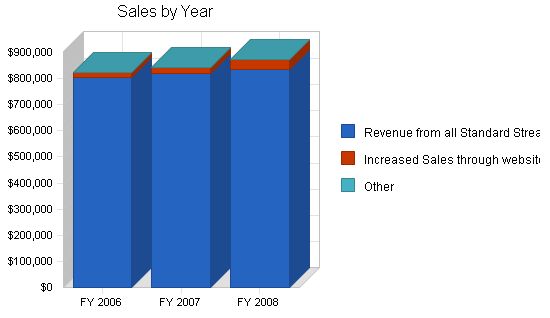
"Standard revenues" represent projected existing revenue streams over the next three years. The website is expected to contribute approximately 2.5% of monthly sales by the end of 2006, increasing to 4% by the end of 2008.
Sales Forecast (FY 2006 – FY 2008)
Sales
– Revenue from all Standard Streams: £804,000, £820,080, £836,482
– Increased Sales through website: £18,360, £23,000, £35,000
– Other: £0, £0, £0
– Total Sales: £822,360, £843,080, £871,482
Direct Cost of Sales (FY 2006 – FY 2008)
– Direct Costs: £32,894, £33,723, £34,859
– Other: £0, £0, £0
– Subtotal Direct Cost of Sales: £32,894, £33,723, £34,859
5.4 Milestones
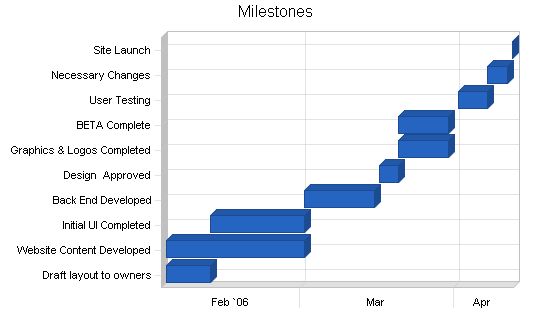
The following milestones illustrate the timeline for the development and implementation of our website.
Milestones:
Milestone Start Date End Date Budget Manager Department
Draft layout to owners 2/1/2006 2/10/2006 £250 Adrian Consultant
Website Content Developed 2/1/2006 3/1/2006 £0 Mark/Barry Owners
Initial UI Completed 2/10/2006 3/1/2006 £500 Adrian Consultant
Back End Developed 3/1/2006 3/15/2006 £700 Adrian Consultant
Design Approved 3/16/2006 3/20/2006 £0 Mark/Barry Owners
Graphics & Logos Completed3/20/2006 3/30/2006 £0 Elisabeth Admin
BETA Complete 3/20/2006 3/30/2006 £500 Adrian Consultant
User Testing 4/1/2006 4/7/2006 £200 Adrian Consultant
Necessary Changes 4/7/2006 4/11/2006 £200 Adrian Consultant
Site Launch 4/12/2006 4/12/2006 £0 Adrian Consultant
Totals £2,350
Web Plan Summary:
The development of the website is championed by Mark Keen, co-owner of Mad Keen Motors. He will manage the site’s development and work closely with Adrian Monkey on design and creation. He will also handle promotions and maintain the "Ask the Mechanic" section.
Adrian Monkey, the consultant, will handle most of the site development. He will be paid a fee for each stage of development and later receive a monthly retainer for site maintenance.
Barry Keen and Mark will collaborate on developing the content section that addresses typical car problems and maintenance tips.
Website Demographics Strategy:
The website will focus on the first three segments and target people in the local area who are interested in moving into these categories. It will provide information on buying used cars as well as links to sites with new car reviews and pricing information.
Traffic Forecast:
Based on research of other local service websites and the size of the potential market in the Backwater Downs area with Internet presence, a conservative estimate of monthly page views and unique user sessions has been created.
Website Marketing Strategy:
The website aims to provide information about cars and improve customer service through an online booking database. Key sections of the website include a Question and Answer section, an Ask the Mechanic section, a buyer’s guide, and links to car review information.
Strategic Internet Alliances:
Mad Keen Motors relies on its alliance with Adrian Monkey to maintain and update the website.
The website’s goal is to increase customer satisfaction and retention levels by 10%. It also aims to attract customers in the Backwater Downs area and increase sales by 7-10% over the next year.
Site Positioning:
The website will provide sports car owners with tips on car maintenance and solutions provided by the local garage. It will also offer personal service to older luxury car owners and provide online resources for buyers searching for information on used cars.
Development Requirements:
The website will be built using ColdFusion, SQL, and HTML technologies. It will have a home page, sections for Q&A and booking, and user car information.
Technical Specifications:
The user interface will be simple and professional to accommodate users with slower Internet connections. The front end will focus on easy navigation, creating interest, displaying content efficiently, and encouraging user interaction. The back end will have functionality for users to send emails for appointments and expert advice.
Resource Requirements:
The development of the website will be outsourced to consultant Adrian Monkey. The website’s content will be developed by the company owners and the secretary.
Future Development:
Future development plans will be assessed after the website has been launched and user tested. There may be additions such as an online repair booking feature.
Management Summary:
Mad Keen Motors is a family business. Mark Keen is responsible for marketing and advertising, employee training, and personnel issues. Barry Keen is the head mechanic. Elisabeth Keen handles the financial aspects of the business.
Personnel Plan:
Mad Keen Motors employs ten mechanics and eight other full-time workers in various roles.
Website expenses are projected to be £6,200 over the next year for development and maintenance. Revenues are expected to increase by £18,360 in the next year due to the website’s impact.
Break-even Analysis:
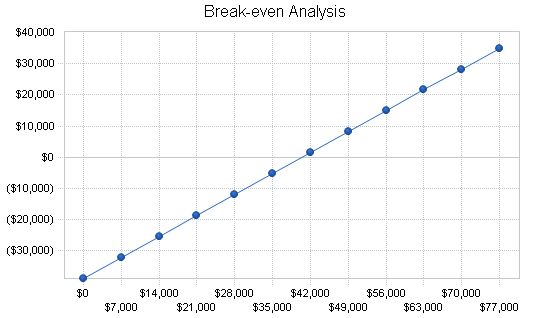
The break-even analysis shows the point at which the company’s sales equal its expenses with the website in place.
Break-even Analysis
Monthly Revenue Break-even: £40,547
Assumptions:
– Average Percent Variable Cost: 4%
– Estimated Monthly Fixed Cost: £38,925
Projected Profit and Loss
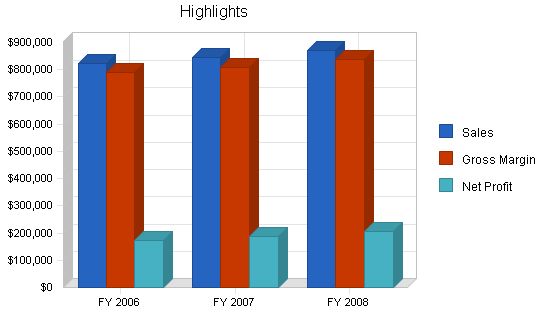
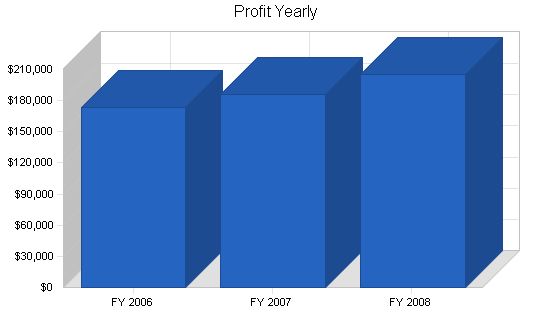
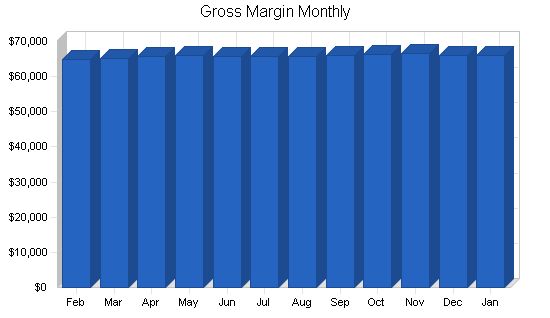
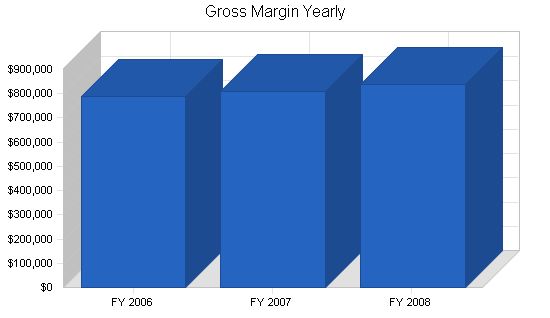
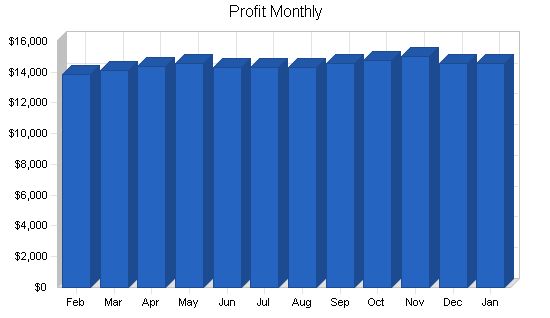
This table outlines additions to the standard operating expenses for developing and maintaining the website. Detailed monthly numbers can be found in the appendix.
Pro Forma Profit and Loss
FY 2006 FY 2007 FY 2008
Sales £822,360 £843,080 £871,482
Direct Cost of Sales £32,894 £33,723 £34,859
Other Costs of Sales £0 £0 £0
Total Cost of Sales £32,894 £33,723 £34,859
Gross Margin £789,466 £809,357 £836,622
Gross Margin % 96.00% 96.00% 96.00%
Expenses
Payroll £402,000 £405,000 £407,000
Other Expense Account Name £0 £0 £0
Depreciation £4,800 £4,800 £4,800
Standard Operating Expenses £0 £19,000 £19,600
Website Infrastructure £0 £0 £0
Website Development £0 £0 £0
Website Maintenance £0 £1,500 £1,500
Expensed Equipment £0 £2,000 £1,200
Payroll Taxes (National Insurance, etc.) £60,300 £60,750 £61,050
Other £0 £0 £0
Total Operating Expenses £467,100 £470,550 £472,850
Profit Before Interest and Taxes £322,366 £338,807 £363,772
EBITDA £327,166 £343,607 £368,572
Interest Expense £74,800 £73,600 £71,200
Taxes Incurred £74,270 £79,562 £87,772
Net Profit £173,296 £185,645 £204,801
Net Profit/Sales 21.07% 22.02% 23.50%
8.4 Projected Cash Flow
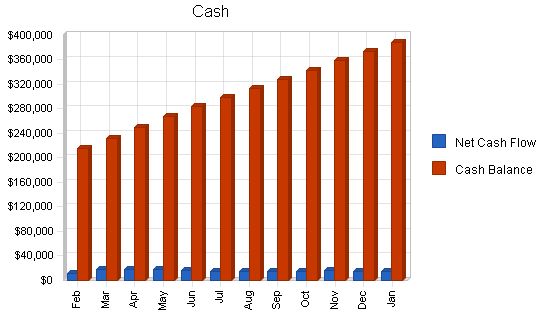
Mad Keen Motors is in a strong cash position right now and can afford the small expenses to start up the website. The table and chart below show our projected cash flow and cash balance.
Pro Forma Cash Flow
| Pro Forma Cash Flow | |||
| FY 2006 | FY 2007 | FY 2008 | |
| Cash Received | |||
| Cash from Operations | |||
| Cash Sales | £822,360 | £843,080 | £871,482 |
| Subtotal Cash from Operations | £822,360 | £843,080 | £871,482 |
| Additional Cash Received | |||
| Sales Tax, VAT, HST/GST Received | £0 | £0 | £0 |
| New Current Borrowing | £0 | £0 | £0 |
| New Other Liabilities (interest-free) | £0 | £0 | £0 |
| New Long-term Liabilities | £0 | £0 | £0 |
| Sales of Other Current Assets | £0 | £0 | £0 |
| Sales of Long-term Assets | £0 | £0 | £0 |
| New Investment Received | £0 | £0 | £0 |
| Subtotal Cash Received | £822,360 | £843,080 | £871,482 |
| Expenditures | FY 2006 | FY 2007 | FY 2008 |
| Expenditures from Operations | |||
| Cash Spending | £402,000 | £405,000 | £407,000 |
| Bill Payments | £233,402 | £246,915 | £254,378 |
| Subtotal Spent on Operations | £635,402 | £651,915 | £661,378 |
| Additional Cash Spent | |||
| Sales Tax, VAT, HST/GST Paid Out | £0 | £0 | £0 |
| Principal Repayment of Current Borrowing | £0 | £0 | £0 |
| Other Liabilities Principal Repayment | £0 | £0 | £0 |
| Long-term Liabilities Principal Repayment | £2,000 | £24,000 | £24,000 |
| Purchase Other Current Assets | £0 | £0 | £0 |
| Purchase Long-term Assets | £0 | £0 | £0 |
| Dividends | £0 | £0 | £0 |
| Subtotal Cash Spent | £637,402 | £675,915 | £685,378 |
| Net Cash Flow | £184,958 | £167,165 | £186,103 |
| Cash Balance | £388,446 | £555,611 | £741,714 |
Projected Balance Sheet
8.5 Projected Balance Sheet
Our Net Worth will continue to grow as we pay off the mortgage for the two newest Mad Keen Motors locations.
| Pro Forma Balance Sheet | |||
| FY 2006 | FY 2007 | FY 2008 | |
| Assets | |||
| Current Assets | |||
| Cash | £388,446 | £555,611 | £741,714 |
| Inventory | £2,748 | £2,817 | £2,912 |
| Other Current Assets | £70,000 | £70,000 | £70,000 |
| Total Current Assets | £461,194 | £628,428 | £814,626 |
| Long-term Assets | |||
| Long-term Assets | £1,250,000 | £1,250,000 | £1,250,000 |
| Accumulated Depreciation | £19,800 | £24,600 | £29,400 |
| Total Long-term Assets | £1,230,200 | £1,225,400 | £1,220,600 |
| Total Assets | £1,691,394 | £1,853,828 | £2,035,226 |
| Liabilities and Capital | FY 2006 | FY 2007 | FY 2008 |
| Current Liabilities | |||
| Accounts Payable | £19,570 | £20,359 | £20,957 |
| Current Borrowing | £0 | £0 | £0 |
| Other Current Liabilities | £0 | £0 | £0 |
| Subtotal Current Liabilities | £19,570 | £20,359 | £20,957 |
| Long-term Liabilities | £748,000 | £724,000 | £700,000 |
| Total Liabilities | £767,570 | £744,359 | £720,957 |
| Paid-in Capital | £400,000 | £400,000 | £400,000 |
| Retained Earnings | £350,528 | £523,824 | £709,469 |
| Earnings | £173,296 | £185,645 | £204,801 |
| Total Capital | £923,824 | £1,109,469 | £1,314,269 |
| Total Liabilities and Capital | £1,691,394 | £1,853,828 | £2,035,226 |
| Net Worth | £923,824 | £1,109,469 | £1,314,269 |
8.6 Business Ratios
The following table outlines some key ratios from the General Automotive Repair Shop industry. The Industry Profile column provides specific ratios based on the industry.
| Ratio Analysis | ||||
| FY 2006 | FY 2007 | FY 2008 | Industry Profile | |
| Sales Growth | 3.05% | 2.52% | 3.37% | 5.37% |
| Percent of Total Assets | ||||
| Inventory | 0.16% | 0.15% | 0.14% | 8.50% |
| Other Current Assets | 4.14% | 3.78% | 3.44% | 24.67% |
| Total Current Assets | 27.27% | 33.90% | 40.03% | 45.07% |
| Long-term Assets | 72.73% | 66.10% | 59.97% | 54.93% |
| Total Assets | 100.00% | 100.00% | 100.00
Personnel Plan Mark Keen, Co-Owner – Feb: £2,000 – Mar: £2,000 – Apr: £2,000 – May: £2,000 – Jun: £2,000 – Jul: £2,000 – Aug: £2,000 – Sep: £2,000 – Oct: £2,000 – Nov: £2,000 – Dec: £2,000 – Jan: £2,000 Barry Keen, Co-Owner – Feb: £1,500 – Mar: £1,500 – Apr: £1,500 – May: £1,500 – Jun: £1,500 – Jul: £1,500 – Aug: £1,500 – Sep: £1,500 – Oct: £1,500 – Nov: £1,500 – Dec: £1,500 – Jan: £1,500 Mechanics – Feb: £20,000 – Mar: £20,000 – Apr: £20,000 – May: £20,000 – Jun: £20,000 – Jul: £20,000 – Aug: £20,000 – Sep: £20,000 – Oct: £20,000 – Nov: £20,000 – Dec: £20,000 – Jan: £20,000 Other Staff – Feb: £8,500 – Mar: £8,500 – Apr: £8,500 – May: £8,500 – Jun: £8,500 – Jul: £8,500 – Aug: £8,500 – Sep: £8,500 – Oct: £8,500 – Nov: £8,500 – Dec: £8,500 – Jan: £8,500 Elisabeth Keen, Admin – Feb: £1,500 – Mar: £1,500 – Apr: £1,500 – May: £1,500 – Jun: £1,500 – Jul: £1,500 – Aug: £1,500 – Sep: £1,500 – Oct: £1,500 – Nov: £1,500 – Dec: £1,500 – Jan: £1,500 Total People: 17 Total Payroll: £33,500 Pro Forma Profit and Loss Sales – Feb: £67,660 – Mar: £68,000 – Apr: £68,400 – May: £68,700 – Jun: £68,350 – Jul: £68,350 – Aug: £68,350 – Sep: £68,700 – Oct: £69,050 – Nov: £69,400 – Dec: £68,700 – Jan: £68,700 Direct Cost of Sales – Feb: £2,706 – Mar: £2,720 – Apr: £2,736 – May: £2,748 – Jun: £2,734 – Jul: £2,734 – Aug: £2,734 – Sep: £2,748 – Oct: £2,762 – Nov: £2,776 – Dec: £2,748 – Jan: £2,748 Other Costs of Sales – Feb: £0 – Mar: £0 – Apr: £0 – May: £0 – Jun: £0 – Jul: £0 – Aug: £0 – Sep: £0 – Oct: £0 – Nov: £0 – Dec: £0 – Jan: £0 Total Cost of Sales – Feb: £2,706 – Mar: £2,720 – Apr: £2,736 – May: £2,748 – Jun: £2,734 – Jul: £2,734 – Aug: £2,734 – Sep: £2,748 – Oct: £2,762 – Nov: £2,776 – Dec: £2,748 – Jan: £2,748 Gross Margin – Feb: £64,954 – Mar: £65,280 – Apr: £65,664 – May: £65,952 – Jun: £65,616 – Jul: £65,616 – Aug: £65,616 – Sep: £65,952 – Oct: £66,288 – Nov: £66,624 – Dec: £65,952 – Jan: £65,952 Gross Margin %: 96.00% Expenses Payroll: £33,500 Other Expense Account Name – Feb: £0 – Mar: £0 – Apr: £0 – May: £0 – Jun: £0 – Jul: £0 – Aug: £0 – Sep: £0 – Oct: £0 – Nov: £0 – Dec: £0 – Jan: £0 Depreciation – Feb: £400 – Mar: £400 – Apr: £400 – May: £400 – Jun: £400 – Jul: £400 – Aug: £400 – Sep: £400 – Oct: £400 – Nov: £400 – Dec: £400 – Jan: £400 Standard Operating Expenses – Feb: £15,000 – Mar: £15,000 – Apr: £15,000 – May: £15,000 – Jun: £15,000 – Jul: £15,000 – Aug: £15,000 – Sep: £15,000 – Oct: £15,000 – Nov: £15,000 – Dec: £15,000 – Jan: £15,000 Website Infrastructure – Feb: £0 – Mar: £0 – Apr: £0 – May: £350 – Jun: £350 – Jul: £350 – Aug: £0 – Sep: £0 – Oct: £0 – Nov: £0 – Dec: £0 – Jan: £0 Website Development – Feb: £600 – Mar: £600 – Apr: £600 – May: £0 – Jun: £0 – Jul: £0 – Aug: £0 – Sep: £0 – Oct: £0 – Nov: £0 – Dec: £0 – Jan: £0 Website Maintenance – Feb: £0 – Mar: £0 – Apr: £0 – May: £150 – Jun: £150 – Jul: £150 – Aug: £150 – Sep: £150 – Oct: £150 – Nov: £150 – Dec: £150 – Jan: £150 Expensed Equipment – Feb: £2,000 – Mar: £0 – Apr: £0 – May: £0 – Jun: £0 – Jul: £0 – Aug: £0 – Sep: £0 – Oct: £0 – Nov: £0 – Dec: £0 – Jan: £0 Payroll Taxes (National Insurance, etc.): 15% – Feb: £5,025 – Mar: £5,025 – Apr: £5,025 – May: £5,025 – Jun: £5,025 – Jul: £5,025 – Aug: £5,025 – Sep: £5,025 – Oct: £5,025 – Nov: £5,025 – Dec: £5,025 – Jan: £5,025 Other – Feb: £0 – Mar: £0 – Apr: £0 – May: £0 – Jun: £0 – Jul: £0 – Aug: £0 – Sep: £0 – Oct: £0 – Nov: £0 – Dec: £0 – Jan: £0 Total Operating Expenses – Feb: £38,925 – Mar: £38,925 – Apr: £38,925 – May: £38,925 – Jun: £38,925 – Jul: £38,925 – Aug: £38,925 – Sep: £38,925 – Oct: £38,925 – Nov: £38,925 – Dec: £38,925 – Jan: £38,925 Profit Before Interest and Taxes – Feb: £26,029 – Mar: £26,355 – Apr: £26,739 – May: £27,027 – Jun: £26,691 – Jul: £26,691 – Aug: £26,691 – Sep: £27,027 – Oct: £27,363 – Nov: £27,699 – Dec: £27,027 – Jan: £27,027 EBITDA – Feb: £26,429 – Mar: £26,755 – Apr: £27,139 – May: £27,427 – Jun: £27,091 – Jul: £27,091 – Aug: £27,091 – Sep: £27,427 – Oct: £27,763 – Nov: £28,099 – Dec: £27,427 – Jan: £27,427 Interest Expense – Feb: £6,233 – Mar: £6,233 – Apr: £6,233 – May: £6,233 – Jun: £6,233 – Jul: £6,233 – Aug: £6,233 – Sep: £6,233 – Oct: £6,233 – Nov: £6,233 – Dec: £6,233 – Jan: £6,233 Taxes Incurred – Feb: £5,939 – Mar: £6,037 – Apr: £6,152 – May: £6,238 – Jun: £6,137 – Jul: £6,137 – Aug: £6,137 – Sep: £6,238 – Oct: £6,339 – Nov: £6,440 – Dec: £6,238 – Jan: £6,238 Net Profit – Feb: £13,857 – Mar: £14,085 – Apr: £14,354 – May: £14,556 – Jun: £14,320 – Jul: £14,320 – Aug: £14,320 – Sep: £14,556 – Oct: £14,791 – Nov: £15,026 – Dec: £14,556 – Jan: £14,556 Net Profit/Sales – Feb: 20.48% – Mar: 20.71% – Apr: 20.99% – May: 21.19% – Jun: 20.95% – Jul: 20.95% – Aug: 20.95% – Sep: 21.19% – Oct: 21.42% – Nov: 21.65% – Dec: 21.19% – Jan: 21.19% Pro Forma Cash Flow Cash Received: – Feb to Jan: Cash Sales of £67,660, £68,000, £68,400, £68,700, £68,350, £68,350, £68,350, £68,700, £69,050, £69,400, £68,700, £68,700 Subtotal Cash from Operations: – Feb to Jan: £67,660, £68,000, £68,400, £68,700, £68,350, £68,350, £68,350, £68,700, £69,050, £69,400, £68,700, £68,700 Additional Cash Received: – Feb to Jan: £0, £0, £0, £0, £0, £0, £0, £0, £0, £0, £0, £0 Subtotal Cash Received: – Feb to Jan: £67,660, £68,000, £68,400, £68,700, £68,350, £68,350, £68,350, £68,700, £69,050, £69,400, £68,700, £68,700 Expenditures: Expenditures from Operations: – Feb to Jan: Cash Spending of £33,500, £33,500, £33,500, £33,500, £33,500, £33,500, £33,500, £33,500, £33,500, £33,500, £33,500, £33,500, £33,500 Bill Payments: – Feb to Jan: £20,573, £17,200, £17,299, £17,467, £19,148, £20,116, £20,130, £20,134, £20,262, £20,377, £20,479, £20,217 Subtotal Spent on Operations: – Feb to Jan: £54,073, £50,700, £50,799, £50,967, £52,648, £53,616, £53,630, £53,634, £53,762, £53,877, £53,979, £53,717 Additional Cash Spent: – Feb to Jan: £0, £0, £0, £0, £0, £0, £0, £0, £0, £0, £0, £0, £0 Subtotal Cash Spent: – Feb to Jan: £56,073, £50,700, £50,799, £50,967, £52,648, £53,616, £53,630, £53,634, £53,762, £53,877, £53,979, £53,717 Net Cash Flow: – Feb to Jan: £11,587, £17,300, £17,601, £17,733, £15,702, £14,734, £14,720, £15,066, £15,288, £15,523, £14,721, £14,983 Cash Balance: – Feb to Jan: £215,075, £232,375, £249,976, £267,709, £283,411, £298,145, £312,865, £327,931, £343,219, £358,742, £373,463, £388,446 Pro Forma Balance Sheet Assets: Current Assets: – Feb to Jan: Cash £203,488, £215,075, £232,375, £249,976, £267,709, £283,411, £298,145, £312,865, £327,931, £343,219, £358,742, £373,463, £388,446 – Feb to Jan: Inventory £12,040, £9,334, £6,614, £3,878, £2,748, £2,734, £2,734, £2,734, £2,748, £2,762, £2,776, £2,748, £2,748 – Feb to Jan: Other Current Assets £70,000, £70,000, £70,000, £70,000, £70,000, £70,000, £70,000, £70,000, £70,000, £70,000, £70,000, £70,000, £70,000 – Feb to Jan: Total Current Assets £285,528, £294,408, £308,988, £323,854, £340,457, £356,145, £370,879, £385,599, £400,679, £415,981, £431,518, £446,211, £461,194 Long-term Assets: – Feb to Jan: Long-term Assets £1,250,000, £1,250,000, £1,250,000, £1,250,000, £1,250,000, £1,250,000, £1,250,000, £1,250,000, £1,250,000, £1,250,000, £1,250,000, £1,250,000, £1,250,000 – Feb to Jan: Accumulated Depreciation £15,000, £15,400, £15,800, £16,200, £16,600, £17,000, £17,400, £17,800, £18,200, £18,600, £19,000, £19,400, £19,800 – Feb to Jan: Total Long-term Assets £1,235,000, £1,234,600, £1,234,200, £1,233,800, £1,233,400, £1,233,000, £1,232,600, £1,232,200, £1,231,800, £1,231,400, £1,231,000, £1,230,600, £1,230,200 Total Assets: – Feb to Jan: £1,520,528, £1,529,008, £1,543,188, £1,557,654, £1,573,857, £1,589,145, £1,603,479, £1,617,799, £1,632,479, £1,647,381, £1,662,518, £1,676,811, £1,691,394 Liabilities and Capital: Current Liabilities: – Feb to Jan: Accounts Payable £20,000, £16,624, £16,718, £16,830, £18,478, £19,445, £19,459, £19,459, £19,583, £19,694, £19,805, £19,543, £19,570 – Feb to Jan: Current Borrowing £0, £0, £0, £0, £0, £0, £0, £0, £0, £0, £0, £0, £0 – Feb to Jan: Other Current Liabilities £0, £0, £0, £0, £0, £0, £0, £0, £0, £0, £0, £0, £0 – Feb to Jan: Subtotal Current Liabilities £20,000, £16,624, £16,718, £16,830, £18,478, £19,445, £19,459, £19,459, £19,583, £19,694, £19,805, £19,543, £19,570 Long-term Liabilities: – Feb to Jan: £750,000, £748,000, £748,000, £748,000, £748,000, £748,000, £748,000, £748,000, £748,000, £748,000, £748,000, £748,000, £748,000 Total Liabilities: – Feb to Jan: £770,000, £764,624, £764,718, £764,830, £766,478, £767,445, £767,459, £767,459, £767,583, £767,694, £767,805, £767,543, £767,570 Paid-in Capital: – Feb to Jan: £400,000, £400,000, £400,000, £400,000, £400,000, £400,000, £400,000, £400,000, £400,000, £400,000, £400,000, £400,000, £400,000 Retained Earnings: – Feb to Jan: £314,488, £350,528, £350,528, £350,528, £350,528, £350,528, £350,528, £350,528, £350,528, £350,528, £350,528, £350,528, £350,528 Earnings: – Feb to Jan: £36,040, £13,857, £27,942, £42,296, £56,851, £71,172, £85,492, £99,812, £114,368, £129,159, £144,185, £158,740, £173,296 Total Capital: – Feb to Jan: £750,528, £764,385, £778,470, £792,824, £807,379, £821,700, £836,020, £850,340, £864,896, £879,687, £894,713, £909,268, £923,824 Total Liabilities and Capital: – Feb to Jan: £1,520,528, £1,529,008, £1,543,188, £1,557,654, £1,573,857, £1,589,145, £1,603,479, £1,617,799, £1,632,479, £1,647,381, £1,662,518, £1,676,811, £1,691,394 Net Worth: – Feb to Jan: £750,528, £764,385, £778,470, £792,824, £807,379, £821,700, £836,020, £850,340, £864,896, £879,687, £894,713, £909,268, £923,824 |
|
Hello!
I’m Andrew Brooks, a seasoned finance consultant from the USA and the mind behind phonenumber247.com.
My career is built on a foundation of helping individuals and businesses thrive financially in an ever-changing economic landscape. At phonenumber247.com, my aim is to demystify the complex world of finance, providing clear, actionable advice that can help you navigate your financial journey with confidence. Whether it’s personal finance management, investment strategies, or understanding the nuances of market dynamics, I’m here to share insights and tools that can propel you towards your financial goals.
Welcome to my digital space, where every piece of advice is a step closer to financial clarity and success!
