Video Television Production Business Plan
EvergreenTV Productions, Inc. is a multi-faceted company that has the potential to expand into new venues as it grows. The development process consists of three phases, starting with our home division. By establishing three stores in the Tampa/St. Petersburg area, we can generate revenue to support the growth of the tour and travel division, as well as the business to business division. Additional funding is required to accomplish this plan.
The Home Division creates digital video scrapbooks by digitizing customers’ photos, setting them to music, and using digital effects to create video memories. Our operations manual is designed to produce a maximum number of videos per week while maintaining a high standard of quality. By following this plan, we can generate the revenue needed to accept other projects typically associated with a production company.
The Tour and Travel Division provides specialized production for various projects based on client needs. This division creates videos of local interest for doctor’s offices, promotional videos for businesses, and tour/travel videos for tour companies. We aim to develop this division into a self-sufficient branch within the first year.
The Business to Business (B2B) Division markets news stories produced by college and university communications students and offers a resume posting service for these students. The stories are sold to small market TV stations across the nation. This division is the heart of EvergreenTV Productions and the main reason for the company’s incorporation. Our website is complete after seven months of development. We aim to provide small market TV stations with quality news stories that they can use to complete their newscasts. This division serves the needs of students looking for professional experience in the TV news industry and small market TV stations that cannot afford expensive news programming.
Objectives:
1. Open two stores in the Tampa/St. Petersburg area by year two, following a business system designed for maximum efficiency and quality.
2. Produce an hour-long video showcasing points of interest in the Tampa/St. Petersburg area for sale to doctor’s offices within six months. Revenue from tape sales will support travel expenses.
3. Generate an inventory of 15 stories for the B2B division within six months, and 50 stories within nine months.
4. Obtain 30 sales to small market TV stations within the first year.
5. Increase B2B division sales to XX by the third year.
6. Build a minimum inventory of 300 B2B news stories by the third year.
7. Open two home division stores per year in various markets throughout the state while maintaining consistency and quality control.
8. Maintain profitability to reinvest in the business and facilitate further expansion.
Keys to Success:
Home Division:
– Product quality. Customers should trust us with their photos and be satisfied with the final product.
– Implementation of business system. Employees should be trained to assist each other in achieving the goals defined within the business system.
– Marketing. Saturation in key customer demographics, followed by a referral program. Building alliances with related businesses will aid in growth.
Tour and Travel Division:
– Product quality/customer satisfaction. All productions should meet the client’s expectations, regardless of genre.
– Development of referral program. The division will respond to the needs of referral clients, establishing a network of referrals.
Business to Business Division:
– Product quality. Thorough review of each story submitted, with guidelines provided to encourage story development.
– Marketing. Consistent contacting of colleges, universities, technical schools, and small market TV stations. The website will be regularly updated to promote students and products.
– Management. On-time product delivery, budget control, and legal/accounting advice.
Mission:
“In the factory Revlon manufactures cosmetics, but in the store Revlon sells hope.” – Charles Revson, founder of Revlon.
While EvergreenTV Productions, Inc. operates as a production company, it sells personal memories, opportunities, and trust.
The home division creates video scrapbooks set to music, selling memories and quality service. Customers must trust that we will cherish their photos and produce each video as if it were for our own families. Our employees should meet the same standards and be treated with the same respect as our customers.
The tour and travel division stays open-minded to new video projects, prioritizing the client’s goal as our objective. We offer suggestions and bring our experience to the table, but we do not alter projects to suit our comfort level.
The business to business division understands the frustrations and needs of small market TV news and the desire of broadcast students to enter the TV news industry. We provide a service and product that match the quality and expectations of TV news directors. This division serves as a bridge between students and stations, uniting them according to industry standards. While maintaining high standards, we generate profit and provide guidance to students. We also offer an affordable programming opportunity to stations. Our company constantly searches for innovative news programming ideas while serving clients to the best of our abilities.
Contents
Company Summary
EvergreenTV Productions is a multi-faceted production company operating on three levels.
The Home Division of EvergreenTV Productions focuses on one product. Using advanced, all-digital editing equipment, our company turns photos into video “scrapbooks” of varying length and style, set to selected music backgrounds. Customers receive a free consultation to review the process, select music, and choose from four video packages. Each package has a detailed rate plan with varying costs, ensuring a unique and personalized video.
The Tour and Travel Division handles various projects that may come to our production company. This division is not primarily a revenue generator, but is essential for our company’s growth. Projects are chosen based on referrals, allowing us to maintain quality and reputation as a production company that specializes in specific areas rather than taking on a large quantity of projects. This division produces a new hour-long video of areas of interest around Tampa Bay every quarter.
The Business to Business Division (B2B) is the core of EvergreenTV Productions and represents our company’s original vision. It offers marketing services for broadcasting students in colleges and universities, and news programming services for small market TV stations. News directors are encouraged to contact the students for job openings, and students receive account histories of which stations purchased their stories. These stories are marketed to the bottom 115 (Nielsen market) TV stations nationwide.
EvergreenTV Productions, Inc. was founded in Tampa, Florida in October 2000. It is a privately owned, Florida corporation under Subchapter S.
Company Ownership
EvergreenTV Productions is a privately-held Subchapter S corporation majority owned by its founder and president, Louanne Walters, with one other director, Bobby G. Walters, who is also the vice-president. Louanne owns 70% of the company, while Bobby owns 30%. Additional ownership shares are available.
Company Locations and Facilities
All equipment and office management space are located within one room, approximately 10×10 feet at Louanne Walters’ home.
We are currently searching for an initial storefront and have priced several in the North Tampa and Carrollwood areas. We require a space of 500-750 sq. ft. In these areas, the average price per square foot is $1-$1.50, resulting in a monthly rent of approximately $500-$1,125. Many of these locations include utilities.
Start-up Summary
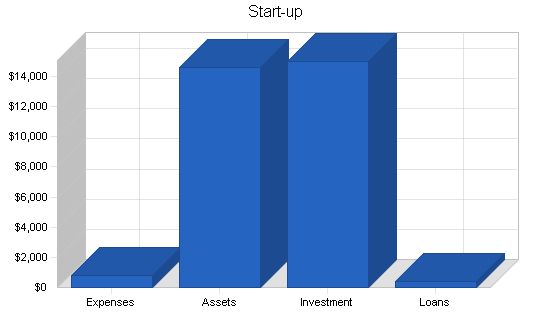
Below are the expenses and funding for the business start-up.
Start-up
Requirements
Start-up Expenses
Legal – $200
Brochures, Stationery, Etc. – $100
Rent – $300
Office Computer – $200
Office Furniture – $0
Total Start-up Expenses – $800
Start-up Assets
Cash Required – $14,100
Start-up Inventory – $0
Other Current Assets – $500
Long-term Assets – $0
Total Assets – $14,600
Total Requirements – $15,400
Start-up Funding
Start-up Expenses to Fund – $800
Start-up Assets to Fund – $14,600
Total Funding Required – $15,400
Assets
Non-cash Assets from Start-up – $500
Cash Requirements from Start-up – $14,100
Additional Cash Raised – $0
Cash Balance on Starting Date – $14,100
Total Assets – $14,600
Liabilities and Capital
Liabilities
Current Borrowing – $0
Long-term Liabilities – $0
Accounts Payable (Outstanding Bills) – $400
Other Current Liabilities (interest-free) – $0
Total Liabilities – $400
Capital
Planned Investment
Investor 1 – $15,000
Other – $0
Additional Investment Requirement – $0
Total Planned Investment – $15,000
Loss at Start-up (Start-up Expenses) – ($800)
Total Capital – $14,200
Total Capital and Liabilities – $14,600
Total Funding – $15,400
Products and Services
As stated in the Company Summary section, Evergreen TV Productions is a company of three divisions, selling both products and services according to each division.
Product and Service Description
– Marketing college and university students’ news stories to small market TV stations nationwide.
– Posting students’ resumes for a certain period (three months) on its website.
– Assigning each student an account to contact stations that purchased their tape for potential job opportunities.
– Assigning each station an account for the news director to contact students as potential future reporters.
– Video scrapbooks, produced from photos digitized and set to music.
– Tour and travel videos of local, business, or other interest for use in area businesses, as advertising of area businesses, or to promote tour agencies.
– "Evergreen" or "timeless" news stories, such as Health, Travel, Business, Leisure, Sports, Politics, Feature Personalities, etc., which may interest stations and their viewers.
Competitive Comparison
We stand apart from our competition in price and value.
Home Division:
Currently, production companies hesitate to offer video scrapbooks due to the amount of work necessary for a minimal return on revenue. They prefer producing corporate productions with a high fee. Local companies charge enormous fees for producing these scrapbooks because they lack a business system to produce them efficiently. Rates for a 10-minute video range from $500 to $2,000. The phone survey also revealed a lack of commitment to production elements like music and digital effects.
Tour and Travel Division:
We offer high value and quality to our customers and treat every project as if it were the only project. Production companies have a reputation for sloppy producing, overbooking projects, and inconsistent and exorbitant charges. Our referral acceptance program ensures we do not overbook and provides a higher degree of responsibility and consistency.
B2B Division:
EvergreenTV Productions focuses on the bottom 115 (Nielsen) TV markets. We offer an affordable alternative to the expensive programming services offered by other providers. A mail-in survey revealed that many stations need stories but cannot afford the high cost of programming. There is currently no service like EvergreenTV Productions in this market.
Sales Literature
EvergreenTV Productions relies heavily on presentations to retirement villas, business clubs, and other social outlets for advertising the Home Division. The B2B Division relies on one-on-one sales calls to colleges/universities and TV stations, as well as email, fax, and internet advertising.
Fulfillment
All end product supplies can be purchased locally from Office Depot, Sam’s Club, or Staples. Supplies include tape labels and VHS/Beta/DVC video tape. Photos for video scrapbooks are provided by clients and returned with the finished product. Stories for the B2B Division are obtained through a legally drawn-up contract with students in exchange for marketing and resume services.
Technology
We use both Windows and Macintosh technology in our company. Windows and Office products are used for databases, word processing, and accounting. Macintosh products are primarily used for video editing and loading video onto our website. We also own video and editing equipment worth over $12,000. We are currently in communication with a media streaming internet company to deliver news stories directly to TV stations.
Future Products and Services
Within the next five years, we will add storefronts statewide, all following consistent guidelines in our business system. We would like to franchise this store nationwide. Within the next three to five years, we will add production of our own brand of travel news to our product line.
Market Analysis Summary
Home Division:
Currently, no production companies in the area focus on video scrapbooks. Smaller companies charge high prices for producing these scrapbooks. Consumers show interest in buying this product.
Tour and Travel Division:
Many production facilities exist in the Tampa Bay Area, capable of producing professional projects. We do not plan to compete regularly for business but instead build a network of quality prospects.
B2B Division:
EvergreenTV Productions focuses on the bottom 115 TV markets. A mail-in survey revealed that many stations need stories but cannot afford the high cost of programming. There is currently no service like EvergreenTV Productions in this market.
Market Segmentation
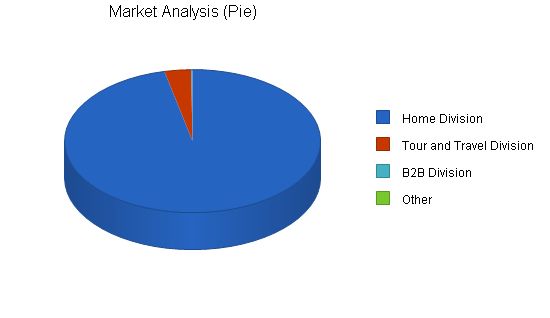
Three loosely defined market segments are identified. The "Home Division" category represents the largest potential segment and the most likely consumers for our product.
Market Analysis
Potential Customers: Home Division, Tour and Travel Division, B2B Division, Other
Target Market Segment Strategy
Home Division: To attract potential customers, we will appeal to their emotions and focus on nostalgia and euphoria. We will also choose a suitable location, such as malls or movie theaters, to reach our target customers.
Tour and Travel Division: Our strategy for this division relies on our referral program, targeting doctors’ offices and travel agencies to reach a wider audience.
B2B Division: To meet the needs of news stations, we will provide high-quality news stories that match the station’s news quality. We will target smaller markets that often face limitations in news programming.
Market Growth
Home Division: We expect market growth to increase after the first two quarters of sales, as there is currently no active competition. We anticipate a slight downturn before seeing consistent sales as our product finds its niche within the community.
B2B Division: Market growth in this division can be assessed by comparing the number of programming companies available now to a decade ago. The size and composition of markets change each year.
Market Needs
Home Division: With the rise of digital editing capabilities, more consumers are aware of the potential of creating video scrapbooks. However, there is currently a lack of production companies actively marketing this product in the Tampa Bay area.
B2B Division: There is a void in news programming, especially for smaller stations. Many rely on extended weather and sports segments or unrelated stories, limiting their content’s quality and potentially decreasing ad revenue.
Market Trends
Home Division: The increasing availability of home computers capable of digital editing is influencing the market. Photo processing centers are also offering pictures on CD-ROMS and expanding their services to include video scrapbooks.
B2B Division: Trends in the television news industry include staffing cutbacks, greater reliance on freelancers, and increased use of the internet for programming.
Main Competitors
Home Division: Competitors include Family Tree Videos and independent production companies. Family Tree Videos specializes in genealogy and video scrapbooks, while independent companies vary in quality and depend on the owner’s ability.
B2B Division: Competitors in the programming services industry include Dr. Dean Edell, MedStar, TravelNet, and Mrs. Fix It. Each service has strengths and weaknesses, such as cost, topic specialization, and limited availability.
Strategy and Implementation Summary
Home Division: Our marketing efforts will focus on creating a desire for our product and emphasizing service and quality. We will provide 30-minute free consultations and ensure consistency and training in customer service.
B2B Division: Our strategy involves highlighting the variety and cost savings we offer compared to larger programming services. We will build relationships with schools and stations and focus on key markets and schools.
Competitive Edge
Home Division: Our competitive edge lies in our ability to produce large quantities of videos while maintaining quality, consistency across all locations, and providing excellent customer service.
B2B Division: Our competitive edge is offering a variety of news topics at a more affordable cost to small market TV stations. Additionally, we provide free resume and marketing services to students.
Sales Strategy
Home Division: Our sales strategy focuses on selling the emotions and memories associated with our videos, rather than the product itself. We want customers to feel that we value and treasure their memories as much as they do.
B2B Division:
1. Selling both the company and the product is crucial. Since we are entering an outdated system, enthusiastic sales efforts are needed to revamp the TV news programming concept. In-person sales are essential in the early stages. Maintaining a reputation for excellent service, diverse news content, and affordable pricing will sustain sales momentum in the future.
2. Selling our service and support to schools nationwide is a priority. Gaining the support of deans and professors is vital for consistent inventory growth on an annual basis. Developing a loyal clientele of professors ensures ongoing inventory expansion.
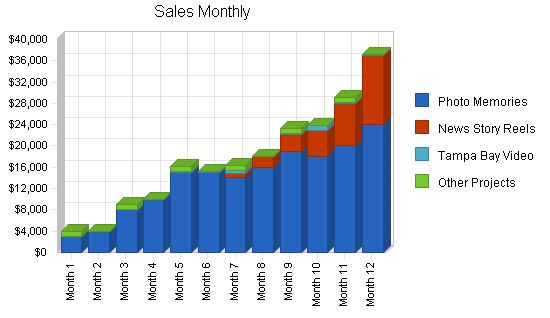
Yearly sales forecasts are provided below, and the monthly forecast for the first year is detailed in the appendix.
Sales Forecast
| Sales Forecast | |||
| Year 1 | Year 2 | Year 3 | |
| 800 | 2,880 | 4,800 | |
| 160 | 1,000 | 2,000 | |
| 48 | 50 | 50 | |
| 6 | 12 | 20 | |
| 1,014 | 3,942 | 6,870 | |
Unit Prices
| Year 1 | Year 2 | Year 3 |
| $207.50 | $208.20 | $208.20 |
| $200.00 | $200.00 | $200.00 |
| $47.92 | $50.00 | $50.00 |
| $1,000.00 | $1,000.00 | $1,000.00 |
Sales
| Year 1 | Year 2 | Year 3 |
| $166,000 | $599,616 | $999,360 |
| $32,000 | $200,000 | $400,000 |
| $2,300 | $2,500 | $2,500 |
| $6,000 | $12,000 | $20,000 |
| $206,300 | $814,116 | $1,421,860 |
Strategic Alliances
Home Division:
Strategic alliances with photographers, photo processing centers, and travel agents will be key to generating sales in the first few quarters. We plan to initiate a co-marketing campaign, possibly adding 30-second commercials at the end of each video to promote a photographer or travel agency. These tasteful commercials will also co-promote a like business. In the future, we could sell these spots to similar businesses to generate revenue.
Additionally, our alliances with retirement villas will be instrumental from start-up. While these will not involve co-promotions, it will be necessary to build a strong relationship so that villa officials welcome us to their facilities.
B2B Division:
We heavily depend on building a strong alliance with schools to create a substantial inventory for generating sales. The greater the size of our inventory, the greater variety we can offer to stations. We need to concentrate on making as many contacts with schools as possible. If we cannot offer students a marketing position, i.e., a substantial timeframe for marketing their stories and posting their resumes, we will not have their interest and their stories to add to our inventory.
After the first year, the inventory will grow at a consistent rate. However, the size of the first year’s inventory could determine our company’s sales success.
Home/Travel Divisions:
1. Build relationships with primary target customers (Market Segmentation section) and like businesses such as photography shops, photo processing centers, and travel agencies.
2. Emphasize service and quality while building a referral basis.
B2B Division:
1. Emphasize variety and affordability.
2. Emphasize service while building relationships.
3. Focus on schools with TV stations and broadcast communications programs.
4. Focus on small market TV stations, bottom 115 Nielsen markets.
Home Division:
Initially, for people celebrating an event or recognizing a lifetime of memories who would like to share photos in a video scrapbook with friends and family, our videos provide a special and unique gift opportunity. Unlike standard production companies that produce video scrapbooks randomly and time-consuming, our videos consistently meet professional standards in quality and are delivered in a timely manner.
B2B Division:
For students about to graduate and seek their first job within the TV news industry, EvergreenTV Productions offers an incredible marketing and resume posting service. Unlike other websites, it offers these services for free and for a longer time frame.
For small market TV stations that need news stories daily to fill their newscasts, EvergreenTV Productions offers an affordable programming service with a variety of programming options.
Pricing Strategy
Home Division:
Our pricing strategy is based on the efficient production of high-quality video scrapbooks. By offering time-efficient and consistently high-quality productions, we can maximize our pricing to acceptable market levels. As our video style becomes more popular, we will adjust the pricing accordingly. We offer four package styles for customers to choose from, and by tracking the most popular package, we can determine the right price for our product.
B2B Division:
Our pricing strategy is focused on offering competitive prices that are lower than larger programming services. The small market TV stations we target cannot afford the higher prices of larger programming services. Additionally, by offering a free resume and marketing service for students, we ensure continued interest in our service and plan to offer payment for these stories in the future.
Promotion Strategy
Home Division:
Initially, we will depend on presentations and business relationships to reach new customers.
1. Retirement villas "social nights": We will present Photo Memories through discussions and brief video presentations at nights set aside for residents and family members.
2. Form business referral relationships with photographers, photo processing centers, and travel agencies.
B2B Division:
We depend on direct contact with communications deans and professors to reach students. We will send promotional kits to colleges, universities, and technical schools with TV stations on campus. Additionally, we will contact professors and deans directly through campus visits or phone calls.
Distribution Strategy
Home Division:
Our primary distribution will be through our storefront, which will also serve as the order center, consultation location, and production office. We offer to accept orders at and deliver to retirement villas to make it easier for our customers.
B2B Division:
Our distribution will mainly be through our website, where we will take and process orders for direct mailings. During the initial period, we will distribute tapes during person-to-person presentations.
Milestones
The table below lists steps, timeline, and estimated budgets for important milestones in the business.
| Milestones | |||||
| Start Date | End Date | Budget | Manager | Department | |
| 9/7/2000 | 5/31/2001 | $19,000 | LW | President | |
| 11/1/2000 | 2/28/2001 | $20 | LW | President | |
| 3/15/2001 | 5/15/2001 | $220 | LW | President | |
| 5/31/2001 | 12/31/2001 | $0 | LW | President | |
| 5/31/2001 | 7/15/2001 | $0 | LW | President | |
| 5/31/2001 | 7/31/2001 | $2,000 | LW | President | |
| 5/31/2001 | 7/15/2001 | $2,000 | LW | President | |
| 7/15/2001 | 8/15/2001 | $2,000 | LW | President | |
| 7/15/2001 | 8/15/2001 | $30 | LW | President | |
| 6/1/2001 | 9/15/2001 | $5 | LW | President | |
| 9/15/2001 | 12/31/2001 | $100 | LW | President | |
| 9/1/2001 | 12/15/2001 | $500 | LW | President | |
| 12/15/2001 | 3/31/2002 | $500 | LW | President | |
| 12/15/2001 | 4/1/2002 | $1,000 | LW/Sales Rp | B2B Sales | |
| 10/1/2001 | 12/31/2001 | $50 | Store Mgr | Home Div. | |
| 12/1/2001 | 6/30/2002 | $6,000 | LW | President | |
| Totals | $33,425 | $833,116 | |||
Management Summary
EvergreenTV Productions is owned and operated by Louanne Walters and Bobby Gene Walters. As the founders of the company, Louanne serves as the president and Bobby serves as the vice-president. Louanne has extensive experience in the radio and TV news industries, while Bobby has an extensive management background. They will be responsible for the overall management of the company.
Organizational Structure
As a start-up, the divisions and departments of EvergreenTV Productions are currently handled by Louanne Walters. As the company grows, it will expand to accommodate several departments, including sales & marketing, service and administration, product development, and finance. Division managers will be responsible for filling these departments based on specific needs and the company’s operations manual.
Management Team
The management team of EvergreenTV Productions consists of Louanne Walters, the president, and Bobby G. Walters, the vice-president. Louanne brings extensive experience in the radio and TV news industries, as well as strong sales skills. Bobby has a background in business and management, with years of experience as a manager with Wal-Mart stores.
Management Team Gaps
Currently, the weakest area in the management team is accounting. To address this, Louanne and Bobby are taking an accounting course and have hired a qualified management counselor and QuickBooks advisor to assist them. In the future, the company will need to hire division managers with a well-rounded management background.
Personnel Plan
The personnel plan of EvergreenTV Productions includes hiring one or two employees per store, with additional staffing for the sales and marketing team and general and administrative roles. The plan also includes the hiring of an operations manager with an MBA and experience in start-up organizations.
Benefits will be provided to employees, with payroll taxes included in the profit and loss statement.
The financial plan of EvergreenTV Productions relies on additional capital to support business operations and maintain positive cash flow in the early stages. The company has committed personal savings, cashed stocks, personal credit lines, and personal loans to fund the start-up process.
The plan assumes payment upon receipt for all goods and does not anticipate changes to accounts receivables or inventory.
Important assumptions for the financial plan include the need for additional capital, maintaining a positive cash balance, and operating with a payment upon receipt policy.
We assume access to equity capital and sufficient financing to follow and maintain our financial plan as shown in the tables. We anticipate higher long-term interest for our financing compared to our current loan against stock. As our company grows, we expect to utilize a larger credit line, reducing our cash expenses. Additionally, our short-term credit line will have a lower interest rate, providing more cash.
We assume opening and promoting three stores in the Tampa Bay area until saturation is reached. Likewise, we expect rapid initial growth in the Home Division, with two stores open in the first year and 10 stores statewide within five years.
We assume many TV markets, colleges, and universities are, or will become, Internet proficient. The B2B Division may experience slow initial growth. However, most of our long-term payments are for one-time or long-term purchases that won’t need to be replaced in the first five years.
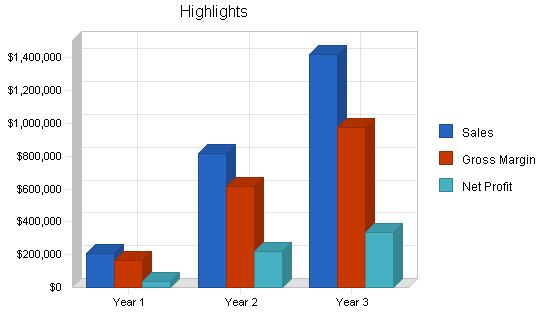
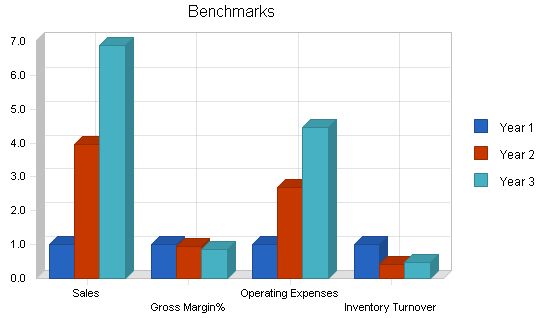
The benchmark chart illustrates the nature of our company. Our inventory is available for resale on a constant basis, ensuring consistent inventory turnover. In the Home Division, customers bring their photos to us and we do not have inventory. In the B2B Division, our inventory consists of news stories that we keep on hand for multiple sales. We replenish our blank tape inventory monthly to avoid holding a large inventory.
Our Gross Margin increases with sales, but the increase is marginal due to our low direct cost of sales. Sales and Operating Expenses are the closest measurements in this forecast. As sales increase, operating expenses rise with new stores, additional employees, and taxes. However, by maximizing the number of employees within each store, we are also maximizing our location and avoiding additional expenses from new storefronts. We can also save significantly on advertising expenses, which would naturally increase with each new location.
Break-even Analysis
Our running costs include rent, utilities, office expenses, travel, advertising, and miscellaneous costs. Miscellaneous costs cover quarterly expenses like business cards, brochures, tape supplies, and occasional equipment rental. Payroll increases every other month when new employees are added.
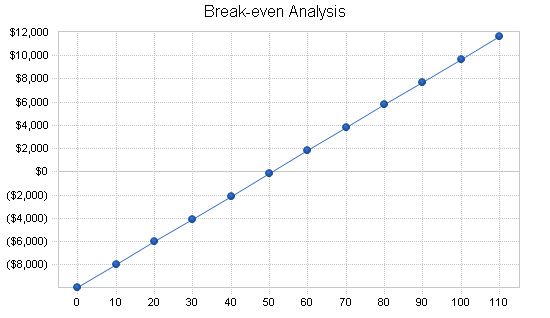
Monthly Units: 51
Monthly Revenue: $10,303
Assumptions:
Average Per-Unit Revenue: $203.45
Average Per-Unit Variable Cost: $7.06
Estimated Monthly Fixed Cost: $9,946
Projected Profit and Loss:
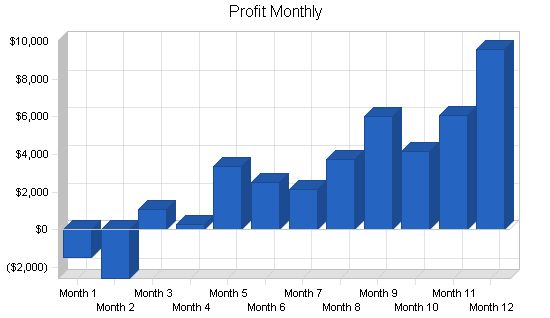
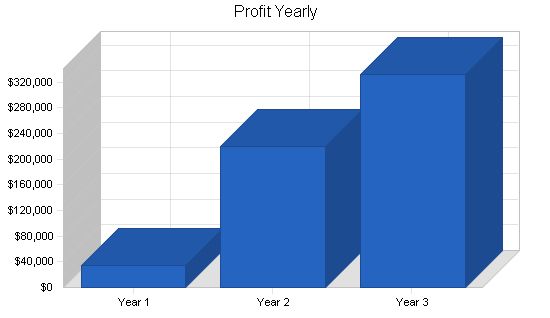
Profit and Loss projects look promising, with only the initial two months showing a start-up loss. The monthly projections for the first year can be found in the appendix.
Pro Forma Profit and Loss
Sales:
– Year 1: $206,300
– Year 2: $814,116
– Year 3: $1,421,860
Direct Cost of Sales:
– Year 1: $7,155
– Year 2: $32,770
– Year 3: $59,450
Production Payroll:
– Year 1: $33,000
– Year 2: $166,500
– Year 3: $385,000
Other:
– Year 1: $0
– Year 2: $0
– Year 3: $0
Total Cost of Sales:
– Year 1: $40,155
– Year 2: $199,270
– Year 3: $444,450
Gross Margin:
– Year 1: $166,145
– Year 2: $614,846
– Year 3: $977,410
Gross Margin %:
– Year 1: 80.54%
– Year 2: 75.52%
– Year 3: 68.74%
Operating Expenses:
– Sales and Marketing Expenses:
– Sales and Marketing Payroll:
– Year 1: $7,998
– Year 2: $78,400
– Year 3: $85,000
– Advertising/Promotion:
– Year 1: $20,000
– Year 2: $20,000
– Year 3: $30,000
– Travel:
– Year 1: $6,500
– Year 2: $10,000
– Year 3: $8,000
– Miscellaneous:
– Year 1: $9,500
– Year 2: $7,500
– Year 3: $10,000
– Total Sales and Marketing Expenses:
– Year 1: $43,998
– Year 2: $115,900
– Year 3: $133,000
– Sales and Marketing %:
– Year 1: 21.33%
– Year 2: 14.24%
– Year 3: 9.35%
– General and Administrative Expenses:
– General and Administrative Payroll:
– Year 1: $25,800
– Year 2: $75,000
– Year 3: $125,000
– Sales and Marketing and Other Expenses:
– Year 1: $0
– Year 2: $0
– Year 3: $0
– Depreciation:
– Year 1: $0
– Year 2: $0
– Year 3: $0
– Leased Equipment:
– Year 1: $0
– Year 2: $0
– Year 3: $0
– Utilities:
– Year 1: $1,260
– Year 2: $3,600
– Year 3: $6,000
– Insurance:
– Year 1: $1,040
– Year 2: $2,880
– Year 3: $4,800
– Rent:
– Year 1: $9,750
– Year 2: $27,000
– Year 3: $45,000
– Payroll Taxes:
– Year 1: $0
– Year 2: $0
– Year 3: $0
– Other General and Administrative Expenses:
– Year 1: $0
– Year 2: $0
– Year 3: $0
– Total General and Administrative Expenses:
– Year 1: $37,850
– Year 2: $108,480
– Year 3: $180,800
– General and Administrative %:
– Year 1: 18.35%
– Year 2: 13.32%
– Year 3: 12.72%
Other Expenses:
– Other Payroll:
– Year 1: $37,500
– Year 2: $97,750
– Year 3: $217,250
– Consultants:
– Year 1: $0
– Year 2: $0
– Year 3: $0
– Contract/Consultants:
– Year 1: $0
– Year 2: $0
– Year 3: $0
– Total Other Expenses:
– Year 1: $37,500
– Year 2: $97,750
– Year 3: $217,250
– Other %:
– Year 1: 18.18%
– Year 2: 12.01%
– Year 3: 15.28%
Total Operating Expenses:
– Year 1: $119,348
– Year 2: $322,130
– Year 3: $531,050
Profit Before Interest and Taxes/EBITDA:
– Year 1: $46,797
– Year 2: $292,716
– Year 3: $446,360
Interest Expense:
– Year 1: $423
– Year 2: $141
– Year 3: $0
Taxes Incurred:
– Year 1: $11,488
– Year 2: $73,144
– Year 3: $113,450
Net Profit:
– Year 1: $34,886
– Year 2: $219,431
– Year 3: $332,910
Net Profit/Sales %:
– Year 1: 16.91%
– Year 2: 26.95%
– Year 3: 23.41%
Projected Cash Flow
Cash flow projections are positive, as shown in the annual table below and the monthly table in the appendix. Only two months in the first year show negative cash flow, and the cash balance shows steady increases.
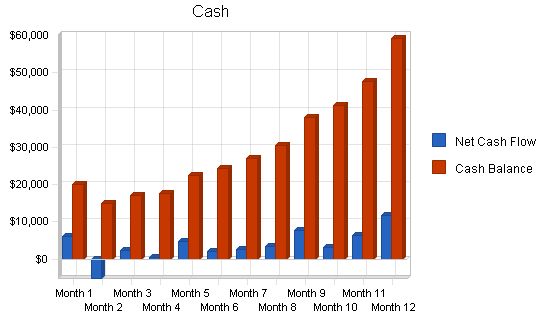
Pro Forma Cash Flow
Year 1 Year 2 Year 3
Cash Received
Cash from Operations
Cash Sales $206,300 $814,116 $1,421,860
Subtotal Cash from Operations $206,300 $814,116 $1,421,860
Additional Cash Received
Sales Tax, VAT, HST/GST Received $0 $0 $0
New Current Borrowing $5,000 $0 $0
New Other Liabilities (interest-free) $0 $0 $0
New Long-term Liabilities $0 $0 $0
Sales of Other Current Assets $0 $0 $0
Sales of Long-term Assets $0 $0 $0
New Investment Received $0 $0 $0
Subtotal Cash Received $211,300 $814,116 $1,421,860
Expenditures
Expenditures from Operations
Cash Spending $104,298 $417,650 $812,250
Bill Payments $59,036 $189,141 $264,923
Subtotal Spent on Operations $163,334 $606,791 $1,077,173
Additional Cash Spent
Sales Tax, VAT, HST/GST Paid Out $0 $0 $0
Principal Repayment of Current Borrowing $2,830 $2,170 $0
Other Liabilities Principal Repayment $0 $0 $0
Long-term Liabilities Principal Repayment $0 $0 $0
Purchase Other Current Assets $0 $0 $0
Purchase Long-term Assets $0 $0 $0
Dividends $0 $0 $0
Subtotal Cash Spent $166,164 $608,961 $1,077,173
Net Cash Flow $45,136 ,$205,155 $344,687
Cash Balance $59,236 $264,391 $609,079
Projected Balance Sheet
The provided balance sheet and appendix exhibit a consistent increase in net worth throughout the plan’s duration.
Pro Forma Balance Sheet
Year 1 Year 2 Year 3
Assets
Current Assets
Cash $59,236 $264,391 $609,079
Inventory $1,480 $19,672 $14,136
Other Current Assets $500 $500 $500
Total Current Assets $61,216 $284,563 $623,715
Long-term Assets
Long-term Assets $0 $0 $0
Accumulated Depreciation $0 $0 $0
Total Long-term Assets $0 $0 $0
Total Assets $61,216 $284,563 $623,715
Liabilities and Capital
Year 1 Year 2 Year 3
Current Liabilities
Accounts Payable $9,960 $16,046 $22,287
Current Borrowing $2,170 $0 $0
Other Current Liabilities $0 $0 $0
Subtotal Current Liabilities $12,130 $16,046 $22,287
Long-term Liabilities $0 $0 $0
Total Liabilities $12,130 $16,046 $22,287
Paid-in Capital $15,000 $15,000 $15,000
Retained Earnings ($800) $34,086 $253,517
Earnings $34,886 $219,431 $332,910
Total Capital $49,086 $268,517 $601,427
Total Liabilities and Capital $61,216 $284,563 $623,715
Net Worth $49,086 $268,517 $601,427
The table below displays business ratios for the plan’s duration. It is important to note that industry profile ratios are provided for comparison and are based on the Standard Industrial Classification (SIC) code 7812, Motion Picture and Video Production.
Ratio Analysis
Year 1 Year 2 Year 3 Industry Profile
Sales Growth n.a. 294.63% 74.65% 14.20%
Percent of Total Assets
Inventory 2.42% 6.91% 2.27% 3.40%
Other Current Assets 0.82% 0.18% 0.08% 46.90%
Total Current Assets 100.00% 100.00% 100.00% 68.40%
Long-term Assets 0.00% 0.00% 0.00% 31.60%
Total Assets 100.00% 100.00% 100.00% 100.00%
Current Liabilities
Accounts Payable 19.82% 5.64% 3.57% 41.60%
Long-term Liabilities 0.00% 0.00% 0.00% 17.20%
Total Liabilities 19.82% 5.64% 3.57% 58.80%
Net Worth 80.18% 94.36% 96.43% 41.20%
Percent of Sales
Sales 100.00% 100.00% 100.00% 100.00%
Gross Margin 80.54% 75.52% 68.74% 0.00%
Selling, General & Administrative Expenses 63.71% 46.92% 43.99% 74.80%
Advertising Expenses 9.69% 2.46% 2.11% 1.60%
Profit Before Interest and Taxes 22.68% 35.96% 31.39% 1.60%
Main Ratios
Current 5.05 17.73 27.98 1.67
Quick 4.92 16.51 27.35 1.12
Total Debt to Total Assets 19.82% 5.64% 3.57% 58.80%
Pre-tax Return on Net Worth 94.48% 108.96% 74.22% 1.80%
Pre-tax Return on Assets 75.76% 102.82% 71.56% 4.50%
Additional Ratios
Year 1 Year 2 Year 3
Net Profit Margin 16.91% 26.95% 23.41% n.a.
Return on Equity 71.07% 81.72% 55.35% n.a.
Activity Ratios
Inventory Turnover 7.63 3.10 3.52 n.a.
Accounts Payable Turnover 6.89 12.17 12.17 n.a.
Payment Days 27 24 26 n.a.
Total Asset Turnover 3.37 2.86 2.28 n.a.
Debt Ratios
Debt to Net Worth 0.25 0.06 0.04 n.a.
Current Liab. to Liab. 1.00 1.00 1.00 n.a.
Liquidity Ratios
Net Working Capital $49,086 $268,517 $601,427 n.a.
Interest Coverage 110.63 2,075.26 0.00 n.a.
Additional Ratios
Year 1 Year 2 Year 3
Assets to Sales 0.30 0.35 0.44 n.a.
Current Debt/Total Assets 20% 6% 4% n.a.
Acid Test 4.92 16.51 27.35 n.a.
Sales/Net Worth 4.20 3.03 2.36 n.a.
Dividend Payout 0.00 0.00 0.00 n.a.
Appendix
Sales Forecast
| Sales Forecast | |||||||||||||
| Month 1 | Month 2 | Month 3 | Month 4 | Month 5 | Month 6 | Month 7 | Month 8 | Month 9 | Month 10 | Month 11 | Month 12 | ||
| Unit Sales | |||||||||||||
| Photo Memories | 0% | 15 | 20 | 40 | 50 | 60 | 60 | 70 | 80 | 95 | 90 | 100 | 120 |
| News Story Reels | 0% | 0 | 0 | 0 | 0 | 0 | 0 | 4 | 10 | 16 | 25 | 40 | 65 |
| Tampa Bay Video | 0% | 0 | 0 | 0 | 2 | 3 | 5 | 12 | 2 | 2 | 18 | 2 | 2 |
| Other Projects | 0% | 1 | 0 | 1 | 0 | 1 | 0 | 1 | 0 | 1 | 0 | 1 | 0 |
| Total Unit Sales | 16 | 20 | 41 | 52 | 64 | 65 | 87 | 92 | 114 | 133 | 143 | 187 | |
| Unit Prices | Month 1 | Month 2 | Month 3 | Month 4 | Month 5 | Month 6 | Month 7 | Month 8 | Month 9 | Month 10 | Month 11 | Month 12 | |
| Photo Memories | $200.00 | $200.00 | $200.00 | $200.00 | $250.00 | $250.00 | $200.00 | $200.00 | $200.00 | $200.00 | $200.00 | $200.00 | |
| News Story Reels | $0.00 | $0.00 | $0.00 | $0.00 | $0.00 | $0.00 | $200.00 | $200.00 | $200.00 | $200.00 | $200.00 | $200.00 | |
| Tampa Bay Video | $0.00 | $0.00 | $0.00 | $0.00 | $50.00 | $50.00 | $50.00 | $50.00 | $50.00 | $50.00 | $50.00 | $50.00 | |
| Other Projects | $1,000.00 | $0.00 | $1,000.00 | $0.00 | $1,000.00 | $0.00 | $1,000.00 | $1,000.00 | $1,000.00 | $1,000.00 | $1,000.00 | $1,000.00 | |
| Sales | |||||||||||||
| Photo Memories | $3,000 | $4,000 | $8,000 | $10,000 | $15,000 | $15,000 | $14,000 | $16,000 | $19,000 | $18,000 | $20,000 | $24,000 | |
| News Story Reels | $0 | $0 | $0 | $0 | $0 | $0 | $800 | $2,000 | $3,200 | $5,000 | $8,000 | $13,000 | |
| Tampa Bay Video | $0 | $0 | $0 | $0 | $150 | $250 | $600 | $100 | $100 | $900 | $100 | $100 | |
| Other Projects | $1,000 | $0 | $1,000 | $0 | $1,000 | $0 | $1,000 | $0 | $1,000 | $0 | $1,000 | $0 | |
| Total Sales | $4,000 | $4,000 | $9,000 | $10,000 | $16,150 | $15,250 | $16,400 | $18,100 | $23,300 | $23,900 | $29,100 | $37,100 | |
Personnel Plan
| Personnel Plan | |||||||||||||
| Month 1 | Month 2 | Month 3 | Month 4 | Month 5 | Month 6 | Month 7 | Month 8 | Month 9 | Month 10 | Month 11 | Month 12 | ||
| Production Personnel | |||||||||||||
| Photo Editor | $0 | $0 | $0 | $1,500 | $1,500 | $1,500 | $1,500 | $1,500 | $1,500 | $1,500 | $1,500 | $1,500 | |
| Photo Editor (2) | $0 | $0 | $0 | $0 | $1,500 | $1,500 | $1,500 | $1,500 | $1,500 | $1,500 | $1,500 | ||
| Additional Employees (3 stores) | $0 | $0 | $0 | $0 | $0 | $0 | $0 | $0 | $0 | $0 | $0 | ||
| Additional Employees (5 stores) | $0 | $0 | $0 | $0 | $0 | $0 | $0 | $0 | $0 | $0 | $0 | ||
| Subtotal | $0 | $0 | $0 | $1,500 | $3,000 | $3,000 | $3,000 | $3,000 | $4,500 | $4,500 | $4,500 | $6,000 | |
| Cash Received |
| Cash from Operations |
| Cash Sales |
| Subtotal Cash from Operations |
| Additional Cash Received |
| Sales Tax, VAT, HST/GST Received |
| New Current Borrowing |
| New Other Liabilities (interest-free) |
| New Long-term Liabilities |
| Sales of Other Current Assets |
| Sales of Long-term Assets |
| New Investment Received |
| Subtotal Cash Received |
| Expenditures |
| Expenditures from Operations |
| Cash Spending |
| Bill Payments |
| Subtotal Spent on Operations |
| Additional Cash Spent |
| Sales Tax, VAT, HST/GST Paid Out |
| Principal Repayment of Current Borrowing |
| Other Liabilities Principal Repayment |
| Long-term Liabilities Principal Repayment |
| Purchase Other Current Assets |
| Purchase Long-term Assets |
| Dividends |
| Subtotal Cash Spent |
| Net Cash Flow |
| Cash Balance |
Pro Forma Balance Sheet
| Assets | Starting Balances |
| Current Assets | |
| Cash | |
| Inventory | |
| Other Current Assets | |
| Total Current Assets | |
| Long-term Assets | |
| Total Long-term Assets | |
| Total Assets | |
| Liabilities and Capital | |
| Current Liabilities | |
| Accounts Payable | |
| Current Borrowing | |
| Other Current Liabilities | |
| Subtotal Current Liabilities | |
| Long-term Liabilities | |
| Total Liabilities | |
| Paid-in Capital | |
| Retained Earnings | |
| Earnings | |
| Total Capital | |
| Total Liabilities and Capital | |
| Net Worth |

Business Plan Outline
- Executive Summary
- Company Summary
- Products and Services
- Market Analysis Summary
- Strategy and Implementation Summary
- Management Summary
- Financial Plan
- Appendix
Hello!
I’m Andrew Brooks, a seasoned finance consultant from the USA and the mind behind phonenumber247.com.
My career is built on a foundation of helping individuals and businesses thrive financially in an ever-changing economic landscape. At phonenumber247.com, my aim is to demystify the complex world of finance, providing clear, actionable advice that can help you navigate your financial journey with confidence. Whether it’s personal finance management, investment strategies, or understanding the nuances of market dynamics, I’m here to share insights and tools that can propel you towards your financial goals.
Welcome to my digital space, where every piece of advice is a step closer to financial clarity and success!
