Microbrew Bar Business Plan
The Bottlecap is a specialty beer tavern near the University of Oregon. It will serve the university and the Eugene, Oregon community with a rotating lineup of premium microbrews for beer connoisseurs.
The Pacific Northwest is the premier microbrew center in the world, with Oregon and Washington having the highest number of microbrew facilities among the 50 states. Enjoying fine beers is a culture within the Pacific Northwest, especially Oregon. The market for fine beer appreciators is huge.
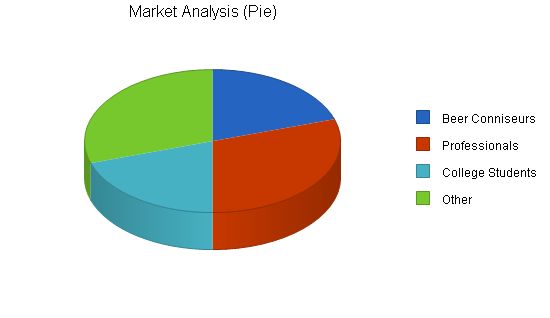
The Bottlecap will target three customer segments: beer connoisseurs, bar attendees, and college students. The beer connoisseur segment has a yearly growth rate of 12% with over 12,000 potential customers. The general bar attending crowd consists of professionals using taverns to unwind and socialize, growing at 8% with 30,000 potential members. College students, growing at 10%, are price sensitive and care less about beer quality, totaling 20,000 potential customers.
The Bottlecap has three direct competitors near the U of O campus. It differentiates itself through its emphasis on fine beer, compared to competitors targeting college students with lower prices. The Bottlecap’s competitive edges are its outstanding selection of premium beers and a companion website that allows customers to provide feedback on the beer selection. This empowers customers and demonstrates that The Bottlecap exists to meet their needs.
The Bottlecap was founded and will be run by Dashiell Lavine and Tyler Vogel. Dashiell has extensive experience in the restaurant industry, working at Il Piato after graduating from Reed College. He served for two years and then managed the entire restaurant for five years, gaining valuable skills in running a restaurant. Tyler comes from an academic background as a CPA from Arthur Anderson. His financial control skills will be vital in managing the cash flow at The Bottlecap.
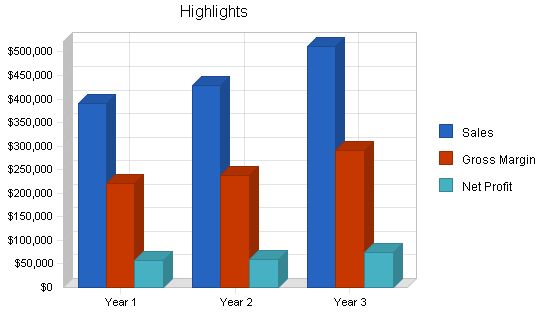
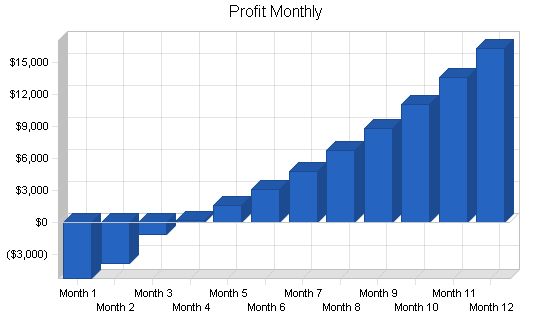
The demand for premium beers ensures the success of The Bottlecap. It will provide a friendly social atmosphere for customers to catch up with old friends, meet new ones, and enjoy fine beers. The Bottlecap is projected to reach profitability by month four and achieve approximately $73,000 in profits by year three.
Contents
1.1 Objectives
Below is a list of The Bottlecap’s objectives:
- Have eight or more hard-to-find beers on tap.
- Grow business by at least 10% per month.
- Create customer awareness of what The Bottlecap offers through the companion website. Measure popularity by tracking hits on the website.
1.2 Mission
The mission of The Bottlecap is to create an economically healthy organization that provides a variety of quality beers in a casual and classy environment appealing to a wide range of customers.
1.3 Keys to Success
The keys to the success of The Bottlecap can be summarized as follows:
- Maintain good relationships with reliable beer distributors.
- Have a well-designed bar with a unique and entertaining atmosphere.
- Provide quality entertainment.
- Attract repeat customers.
Company Summary
The Bottlecap, located near the University of Oregon, will offer the community a classy bar with unique beers on tap. It will also provide customers with an innovative environment for enjoying high-quality beers.
2.1 Company Ownership
The Bottlecap will be a privately funded company owned and run by Dashiell Lavine and Tyler Vogel. They will both be equal partners. Joe Smith and Bob Adler will hold minority stock positions as private investors.
2.2 Start-up Summary
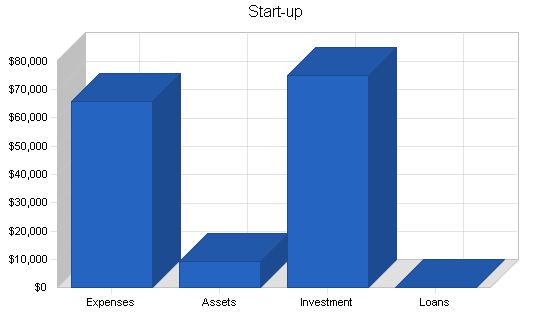
The Bottlecap’s start-up costs will cover beer serving equipment, site renovation and remodeling, capital to cover losses during the first year, a computer to maintain the website’s presence, and entertainment equipment, including a big screen television for sports, a pool table, and a stereo. Additionally, costs will be allocated for the beer serving equipment, such as eight taps, Carbon Dioxide tanks, and glassware purchased from various vendors in Eugene.
The site will require funds for renovation and modification. A single estimated figure will be allocated for this purpose, including the costs associated with preparing the site for opening business in May.
The furniture, site renovation, permits and fees, and entertainment equipment will account for a large amount of our start-up costs.
Due to the competitive nature of the marketplace, we have accounted for extra funds for the cash balance. This ensures that we will be in a good position should our numbers not match our forecasts, preventing a loss of the large initial investment.
Start-up
Requirements
Start-up Expenses
Fees & Permits $7,500
Exterior Sign $2,500
Pool Table $5,000
Stereo System $350
Legal $500
Consultants $1,000
Insurance $700
Rent $1,500
Taps $800
Glassware $500
Computer System $1,500
Misc. Supplies & Equipment $700
Bathroom Supplies $250
Marketing $1,000
Fixtures & Re-Model $25,000
Big Screen Television $2,000
Point of Sale Systems $5,000
Furniture $10,000
Total Start-up Expenses $65,800
Start-up Assets
Cash Required $7,920
Start-up Inventory $1,280
Other Current Assets $0
Long-term Assets $0
Total Assets $9,200
Total Requirements $75,000
Start-up Funding
Start-up Expenses to Fund $65,800
Start-up Assets to Fund $9,200
Total Funding Required $75,000
Assets
Non-cash Assets from Start-up $1,280
Cash Requirements from Start-up $7,920
Additional Cash Raised $0
Cash Balance on Starting Date $7,920
Total Assets $9,200
Liabilities and Capital
Liabilities
Current Borrowing $0
Long-term Liabilities $0
Accounts Payable (Outstanding Bills) $0
Other Current Liabilities (interest-free) $0
Total Liabilities $0
Capital
Planned Investment
Dashiell Lavine $20,000
Tyler Vogel $20,000
Joe Smith $17,500
Bob Adler $17,500
Other $0
Additional Investment Requirement $0
Total Planned Investment $75,000
Loss at Start-up (Start-up Expenses) ($65,800)
Total Capital $9,200
Total Capital and Liabilities $9,200
Total Funding $75,000
2.3 Company Locations and Facilities
The Bottlecap’s location will be chosen based upon the following criteria listed in order of importance:
– Centrality and accessibility
– Adequate space and layout
– Availability of additional rooms, such as a manager’s office and a storage facility for supplies
Services
The Bottlecap will provide its customers with a unique and friendly environment for enjoying specialty brews and quality beers. Additional amenities include a pool table and a big screen television for sporting events.
3.1 Competitive Comparison
The Bottlecap will be the first beer-only pub near the campus that offers quality beer at affordable prices.
Market Analysis Summary
The Northwest is the hub of microbrews and home brewing, with a recent surge of interest in craft beers. The Bottlecap, a specialty beer tavern, aims to flourish in Eugene, targeting beer connoisseurs, professionals, and college students.
4.1 Market Segmentation
Our target market consists of approximately 100,000 people in Eugene and Springfield. We have segmented our customers into the following groups:
– Beer Connoisseurs: Drawn to The Bottlecap for its selection of hard-to-find beers.
– Professionals: Bar-attending public looking for a friendly and classy atmosphere.
– College Students: University of Oregon and Lane Community College students, with targeted bargain marketing efforts.
Market Analysis:
Year 1 Year 2 Year 3 Year 4 Year 5
Potential Customers Growth CAGR
Beer Conniseurs 12% 20,000 22,400 25,088 28,099 31,471 12.00%
Professionals 8% 30,000 32,400 34,992 37,791 40,814 8.00%
College Students 10% 20,000 22,000 24,200 26,620 29,282 10.00%
Other 2% 30,000 30,600 31,212 31,836 32,473 2.00%
Total 7.60% 100,000 107,400 115,492 124,346 134,040 7.60%
Table: Market Analysis
4.2 Target Market Segment Strategy
Both advertising and word-of-mouth will play a big part in the success of The Bottlecap. Therefore, we will strive to appeal to both new and old customers with a unique advertising campaign. This campaign will include an online presence that allows regulars to vote for featured beers each week, as well as a friendly atmosphere to encourage repeat business.
4.3 Service Business Analysis
The pub and bar industry in Eugene has steadily grown in recent years. Several factors contribute to the high demand for quality beer in Eugene. The climate in Eugene is perfect for beer consumption, and the popularity of unique microbrews is evident in current Northwest trends. Therefore, Eugene is a haven for beer lovers.
To stand out in a competitive market, bar owners must differentiate their establishments. The founders of The Bottlecap understand the need for uniqueness and believe that combining a bar with a classy and entertaining atmosphere is the key to success.
4.4 Main Competitors
The primary competitors of The Bottlecap, located near the University of Oregon campus, are Rennie’s Landing, Taylor’s Bar & Grill, and Max’s Tavern. In the first six months of operation, aggressive advertising targeting University students will set us apart from the competition.
Strategy and Implementation Summary
The main target audience for The Bottlecap will be University of Oregon students. Therefore, our primary advertising platforms will be the University of Oregon’s Daily Emerald and the Eugene Weekly. Additionally, we will advertise on various radio stations.
5.1 Competitive Edge
The Bottlecap will have an edge over competitors due to the wide selection of specialty beers on tap. The companion website also allows regular customers to vote and influence the weekly selection of specialty beers. We will further differentiate ourselves by creating a classy yet laid-back atmosphere with amenities such as a big screen television and a high-quality pool table.
To develop effective business strategies, perform a SWOT analysis of your business. Learn how to perform a SWOT analysis with our free guide and template.
Both advertising and word-of-mouth will be crucial for The Bottlecap’s success. Therefore, we will strive to appeal to new and existing customers through a unique advertising campaign. This campaign will include an online presence that allows regulars to vote for featured beers each week, as well as a friendly atmosphere that encourages customer loyalty.
5.3 Sales Forecast
The Bottlecap’s sales forecast is based on the number of beers we estimate selling during each operating hour. Our hours of operation will be from 12 p.m. to 3 a.m. on Saturdays, 12 p.m. to 12 a.m. on Sundays, and 4 p.m. to 3 a.m. from Wednesday to Friday.
On average, we expect to sell 35 beers per hour on Saturdays, 15 beers per hour on Sundays, and 25 beers per hour from Wednesday to Friday.
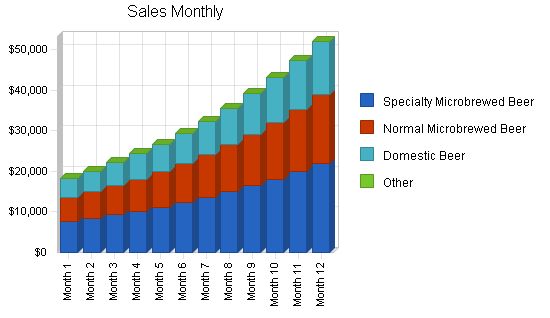
We anticipate that approximately 30% of our sales will be domestic beer, 38% specialty microbrew beer, and 32% local microbrew beer. The prices and costs are based on the same type of beers sold at local bars and the cost of kegs from local distributors. These numbers may vary depending on location, market saturation, and the customer base.
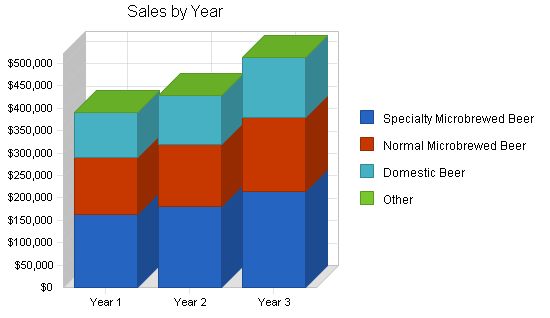
Sales Forecast:
Year 1 Year 2 Year 3
Unit Sales
Specialty Microbrewed Beer 50,381 55,419 60,961
Normal Microbrewed Beer 42,426 46,668 51,335
Domestic Beer 39,775 43,752 48,127
Other 0 0 0
Total Unit Sales 132,583 145,839 160,423
Unit Prices
Year 1 Year 2 Year 3
Specialty Microbrewed Beer $3.25 $3.25 $3.50
Normal Microbrewed Beer $3.00 $3.00 $3.25
Domestic Beer $2.50 $2.50 $2.75
Other $0.00 $0.00 $0.00
Sales
Specialty Microbrewed Beer $163,739 $180,112 $213,364
Normal Microbrewed Beer $127,279 $140,004 $166,839
Domestic Beer $99,437 $109,380 $132,349
Other $0 $0 $0
Total Sales $390,456 $429,496 $512,552
Direct Unit Costs
Year 1 Year 2 Year 3
Specialty Microbrewed Beer $0.81 $0.81 $0.86
Normal Microbrewed Beer $0.65 $0.65 $0.70
Domestic Beer $0.48 $0.48 $0.53
Other $0.00 $0.00 $0.00
Direct Cost of Sales
Specialty Microbrewed Beer $40,809 $44,889 $52,426
Normal Microbrewed Beer $27,577 $30,334 $35,935
Domestic Beer $19,092 $21,001 $25,507
Other $0 $0 $0
Subtotal Direct Cost of Sales $87,478 $96,225 $113,868
Milestones
Milestone Start Date End Date Budget Manager Department
Business Plan 5/1/2001 5/30/2001 $1,000 Tyler Vogel and Dashiell Lavine Admin
Secure Start-up Funding 6/15/2001 7/1/2001 $1,000 Tyler Vogel and Dashiell Lavine Admin
Site Selection 7/1/2001 7/15/2001 $1,000 Tyler Vogel and Dashiell Lavine Admin
Architect Designs 8/1/2001 9/1/2001 $1,000 Tyler Vogel and Dashiell Lavine Admin
Designer Proposal 8/1/2001 9/15/2001 $1,000 Tyler Vogel and Dashiell Lavine Admin
Technology Design 8/1/2001 9/15/2001 $1,000 Tyler Vogel and Dashiell Lavine Admin
Year 1 Plan 9/1/2001 10/5/2001 $1,000 Tyler Vogel and Dashiell Lavine Admin
Personnel Plan 10/1/2001 10/10/2001 $1,000 Tyler Vogel and Dashiell Lavine Admin
Accounting Plan 10/1/2001 10/5/2001 $1,000 Tyler Vogel and Dashiell Lavine Admin
Licensing 12/1/2001 12/15/2001 $1,000 Tyler Vogel and Dashiell Lavine Admin
Totals $10,000
Management Summary
The Bottlecap is owned and operated by Dashiell Lavine and Tyler Vogel. The company, being small in nature, requires a simple organizational structure. Implementation of this organizational form calls for the owners and the one manager to make all of the major management decisions in addition to monitoring all other business activities.
Management Team
Specific details are omitted in this sample plan. Biographies and resumes have not been included for privacy purposes.
Personnel Plan
The staff will consist of six part-time employees working twenty hours a week at $6.50 per hour. In addition, a manager who oversees daily operations will be employed to work forty hours a week at $10.00 per hour. Dashiell Lavine and Tyler Vogel will help with management decisions and will run the back end of the business, which includes the website and administrative duties. Two of the private investors, Bob Adler and Joe Smith, will not be included in management decisions. This allows disputes to be solved with less hassle. Because of these characteristics, there are fewer coordination problems seen at The Bottlecap than in larger organizational chains. This strategy enables The Bottlecap to react quickly to market changes.
Personnel Plan
Year 1 Year 2 Year 3
Production Personnel
Manager $19,680 $19,980 $20,664
Part-Time Employee 1 $6,396 $6,596 $6,796
Part-Time Employee 2 $6,396 $6,596 $6,796
Part-Time Employee 3 $6,396 $6,596 $6,796
Part-Time Employee 4 $6,396 $6,596 $6,796
Part-Time Employee 5 $6,396 $6,596 $6,796
Part-Time Employee 6 $6,396 $6,596 $6,796
Other $0 $6,596 $6,796
Subtotal $58,056 $66,152 $68,236
Sales and Marketing Personnel
Name or title $0 $0 $0
Other $0 $0 $0
Subtotal $0 $0 $0
General and Administrative Personnel
Dashiell Lavine (Part-Owner) $24,000 $25,000 $26,000
Tyler Vogel (Part-Owner) $24,000 $25,000 $26,000
Other $0 $0 $0
Subtotal $48,000 $50,000 $52,000
Other Personnel
Name or title $0 $0 $0
Other $0 $0 $0
Subtotal $0 $0 $0
Total People 0 0 0
Total Payroll $106,056 $116,152 $120,236
The following section will lay out the general financial plan including our break-even analysis, profit and loss, cash flow, general assumptions, the balance sheet, and the business ratios.
Important Assumptions
The following table summarizes important assumptions necessary for good financial planning.
General Assumptions
Year 1 Year 2 Year 3
Plan Month 1 2 3
Current Interest Rate 10.00% 10.00% 10.00%
Long-term Interest Rate 10.00% 10.00% 10.00%
Tax Rate 25.42% 25.00% 25.42%
Other 0 0 0
Break-even Analysis
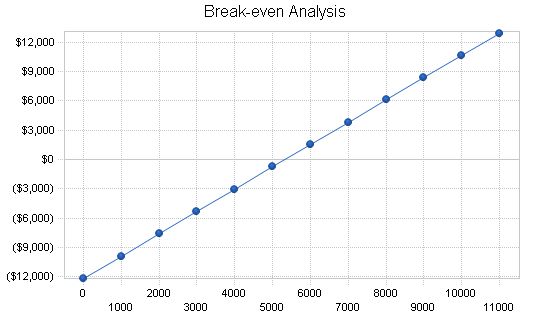
The following table and chart summarize our break-even analysis. To break even, we must sell at least 5,300 beers based on the per unit cost. Therefore, customer traffic will be a big factor in the success of The Bottlecap.
Break-even Analysis:
Monthly Units Break-even: 5,335
Monthly Revenue Break-even: $15,713
Assumptions:
Average Per-Unit Revenue: $2.94
Average Per-Unit Variable Cost: $0.66
Estimated Monthly Fixed Cost: $12,192
7.3 Key Financial Indicators:
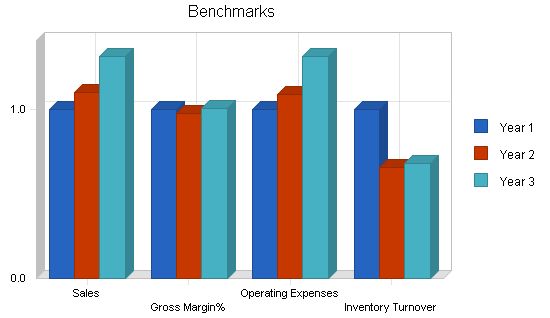
The chart below compares five key indicators and their changes over the first three years of plan implementation.
7.4 Projected Profit and Loss
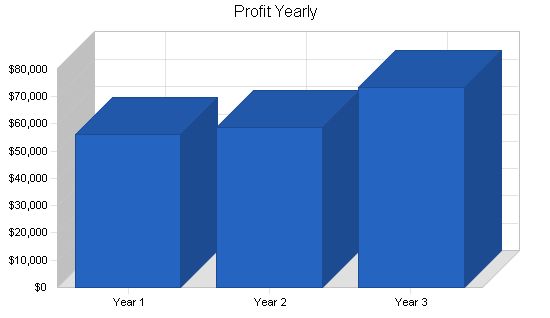
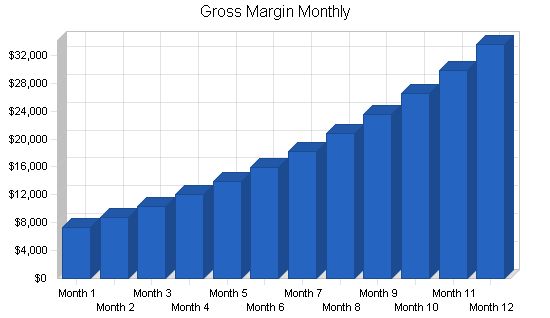
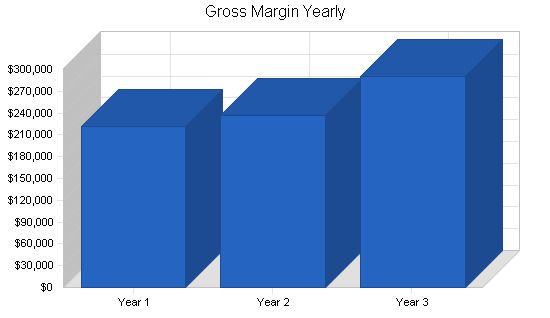
The key to success for a beer tavern like The Bottlecap is the gross margin due to the low cost of purchasing beer in bulk. The profit-per-unit is crucial considering the high costs of operating such an establishment.
Pro Forma Profit and Loss:
Year 1 Year 2 Year 3
Sales $390,456 $429,496 $512,552
Direct Cost of Sales $87,478 $96,225 $113,868
Production Payroll $58,056 $66,152 $68,236
Other $24,000 $30,000 $40,000
Total Cost of Sales $169,534 $192,377 $222,104
Gross Margin $220,922 $237,119 $290,447
Gross Margin % 56.58% 55.21% 56.67%
Operating Expenses
Sales and Marketing Expenses
Sales and Marketing Payroll $0 $0 $0
Advertising/Promotion $39,000 $50,000 $75,000
Miscellaneous $6,000 $9,000 $12,000
Total Sales and Marketing Expenses $45,000 $59,000 $87,000
Sales and Marketing % 11.52% 13.74% 16.97%
General and Administrative Expenses
General and Administrative Payroll $48,000 $50,000 $52,000
Sales and Marketing and Other Expenses $0 $0 $0
Depreciation $0 $0 $0
Leased Equipment $0 $0 $0
Utilities $9,000 $11,000 $12,000
Insurance $8,400 $9,500 $11,000
Rent $18,000 $12,000 $12,000
Payroll Taxes $15,908 $17,423 $18,035
Other General and Administrative Expenses $0 $0 $0
Total General and Administrative Expenses $99,308 $99,923 $105,035
General and Administrative % 25.43% 23.27% 20.49%
Other Expenses:
Other Payroll $0 $0 $0
Consultants $0 $0 $0
Contract/Consultants $2,000 $0 $0
Total Other Expenses $2,000 $0 $0
Other % 0.51% 0.00% 0.00%
Total Operating Expenses $146,308 $158,923 $192,035
Profit Before Interest and Taxes $74,613 $78,196 $98,412
EBITDA $74,613 $78,196 $98,412
Interest Expense $75 $0 $0
Taxes Incurred $18,262 $19,549 $25,013
Net Profit $56,276 $58,647 $73,399
Net Profit/Sales 14.41% 13.65% 14.32%
7.5 Projected Cash Flow
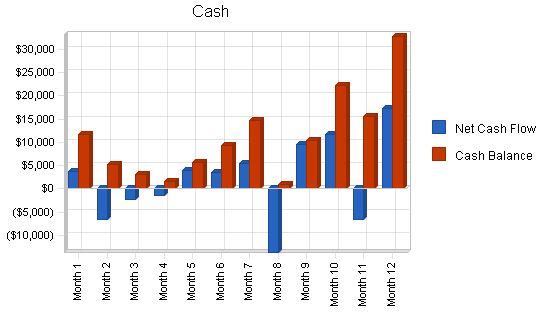
The chart and table below present the key elements of the pro forma cash flow.
Pro Forma Cash Flow
| Pro Forma Cash Flow | |||
| Year 1 | Year 2 | Year 3 | |
| Cash Received | |||
| Cash from Operations | |||
| Cash Sales | $390,456 | $429,496 | $512,552 |
| Subtotal Cash from Operations | $390,456 | $429,496 | $512,552 |
| Additional Cash Received | |||
| Sales Tax, VAT, HST/GST Received | $0 | $0 | $0 |
| New Current Borrowing | $2,000 | $0 | $0 |
| New Other Liabilities (interest-free) | $0 | $0 | $0 |
| New Long-term Liabilities | $0 | $0 | $0 |
| Sales of Other Current Assets | $0 | $0 | $0 |
| Sales of Long-term Assets | $0 | $0 | $0 |
| New Investment Received | $3,000 | $0 | $0 |
| Subtotal Cash Received | $395,456 | $429,496 | $512,552 |
| Expenditures | Year 1 | Year 2 | Year 3 |
| Expenditures from Operations | |||
| Cash Spending | $106,056 | $116,152 | $120,236 |
| Bill Payments | $212,551 | $262,072 | $316,120 |
| Subtotal Spent on Operations | $318,607 | $378,224 | $436,356 |
| Additional Cash Spent | |||
| Sales Tax, VAT, HST/GST Paid Out | $0 | $0 | $0 |
| Principal Repayment of Current Borrowing | $2,000 | $0 | $0 |
| Other Liabilities Principal Repayment | $0 | $0 | $0 |
| Long-term Liabilities Principal Repayment | $0 | $0 | $0 |
| Purchase Other Current Assets | $50,000 | $0 | $0 |
| Purchase Long-term Assets | $0 | $0 | $0 |
| Dividends | $0 | $0 | $0 |
| Subtotal Cash Spent | $370,607 | $378,224 | $436,356 |
| Net Cash Flow | $24,849 | $51,272 | $76,195 |
| Cash Balance | $32,769 | $84,040 | $160,236 |
7.6 Projected Balance Sheet
The table below is the complete balance sheet which includes all assets, liabilities, and capital.
| Pro Forma Balance Sheet | |||
| Year 1 | Year 2 | Year 3 | |
| Assets | |||
| Cash | $32,769 | $84,040 | $160,236 |
| Inventory | $12,839 | $14,122 | $16,712 |
| Other Current Assets | $50,000 | $50,000 | $50,000 |
| Total Current Assets | $95,607 | $148,163 | $226,947 |
| Long-term Assets | |||
| Long-term Assets | $0 | $0 | $0 |
| Accumulated Depreciation | $0 | $0 | $0 |
| Total Long-term Assets | $0 | $0 | $0 |
| Total Assets | $95,607 | $148,163 | $226,947 |
| Liabilities and Capital | Year 1 | Year 2 | Year 3 |
| Current Liabilities | |||
| Accounts Payable | $27,131 | $21,039 | $26,425 |
| Current Borrowing | $0 | $0 | $0 |
| Other Current Liabilities | $0 | $0 | $0 |
| Subtotal Current Liabilities | $27,131 | $21,039 | $26,425 |
| Long-term Liabilities | $0 | $0 | $0 |
| Total Liabilities | $27,131 | $21,039 | $26,425 |
| Paid-in Capital | $78,000 | $78,000 | $78,000 |
| Retained Earnings | ($65,800) | ($9,524) | $49,123 |
| Earnings | $56,276 | $58,647 | $73,399 |
| Total Capital | $68,476 | $127,123 | $200,522 |
| Total Liabilities and Capital | $95,607 | $148,163 | $226,947 |
| Net Worth | $68,476 | $127,123 | $200,522 |
7.7 Business Ratios
The Ratios table shows important ratios for The Bottlecap. These ratios are derived from the Standard Industry Classification (SIC) Index, code 5813.
| Ratio Analysis | ||||
| Year 1 | Year 2 | Year 3 | Industry Profile | |
| Sales Growth | 0.00% | 10.00% | 19.34% | 1.90% |
| Percent of Total Assets | ||||
| Inventory | 13.43% | 9.53% | 7.36% | 3.10% |
| Other Current Assets | 52.30% | 33.75% | 22.03% | 44.60% |
| Total Current Assets | 100.00% | 100.00% | 100.00% | 52.30% |
| Long-term Assets | 0.00% | 0.00% | 0.00% | 47.70% |
| Total Assets | 100.00% | 100.00% | 100.00% | 100.00% |
| Current Liabilities | 28.38% | 14.20% | 11.64% | 28.20% |
| Long-term Liabilities | 0.00% | 0.00% | 0.00% | 23.10% |
| Total Liabilities | 28.38% | 14.20% | 11.64% | 51.30% |
| Net Worth | 71.62% | 85.80% | 88.36% | 48.70% |
| Percent of Sales | ||||
| Sales | 100.00% | 100.00% | 100.00% | 100.00% |
| Gross Margin | 56.58% | |||
| Sales Forecast | |||||||||||||
| Month 1 | Month 2 | Month 3 | Month 4 | Month 5 | Month 6 | Month 7 | Month 8 | Month 9 | Month 10 | Month 11 | Month 12 | ||
| Unit Sales | |||||||||||||
| Specialty Microbrewed Beer | 2,356 | 2,592 | 2,851 | 3,136 | 3,449 | 3,794 | 4,174 | 4,591 | 5,050 | 5,555 | 6,111 | 6,722 | |
| Normal Microbrewed Beer | 1,984 | 2,182 | 2,401 | 2,641 | 2,905 | 3,195 | 3,515 | 3,866 | 4,253 | 4,678 | 5,146 | 5,661 | |
| Domestic Beer | 1,860 | 2,046 | 2,251 | 2,476 | 2,723 | 2,996 | 3,295 | 3,625 | 3,987 | 4,386 | 4,824 | 5,307 | |
| Other | 0 | 0 | 0 | 0 | 0 | 0 | 0 | 0 | 0 | 0 | 0 | 0 | |
| Total Unit Sales | 6,200 | 6,820 | 7,502 | 8,252 | 9,077 | 9,985 | 10,984 | 12,082 | 13,290 | 14,619 | 16,081 | 17,689 | |
| Unit Prices | Month 1 | Month 2 | Month 3 | Month 4 | Month 5 | Month 6 | Month 7 | Month 8 | Month 9 | Month 10 | Month 11 | Month 12 | |
| Specialty Microbrewed Beer | $3.25 | $3.25 | $3.25 | $3.25 | $3.25 | $3.25 | $3.25 | $3.25 | $3.25 | $3.25 | $3.25 | $3.25 | |
| Normal Microbrewed Beer | $3.00 | $3.00 | $3.00 | $3.00 | $3.00 | $3.00 | $3.00 | $3.00 | $3.00 | $3.00 | $3.00 | $3.00 | |
| Domestic Beer | $2.50 | $2.50 | $2.50 | $2.50 | $2.50 | $2.50 | $2.50 | $2.50 | $2.50 | $2.50 | $2.50 | $2.50 | |
| Other | $0.00 | $0.00 | $0.00 | $0.00 | $0.00 | $0.00 | $0.00 | $0.00 | $0.00 | $0.00 | $0.00 | $0.00 | |
| Sales | |||||||||||||
| Specialty Microbrewed Beer | $7,657 | $8,423 | $9,265 | $10,191 | $11,211 | $12,332 | $13,565 | $14,921 | $16,413 | $18,055 | $19,860 | $21,846 | |
| Normal Microbrewed Beer | $5,952 | $6,547 | $7,202 | $7,922 | $8,714 | $9,586 | $10,544 | $11,599 | $12,759 | $14,035 | $15,438 | $16,982 | |
| Domestic Beer | $4,650 | $5,115 | $5,627 | $6,189 | $6,808 | $7,489 | $8,238 | $9,062 | $9,968 | $10,964 | $12,061 | $13,267 | |
| Other | $0 | $0 | $0 | $0 | $0 | $0 | $0 | $0 | $0 | $0 | $0 | $0 | |
| Total Sales | $18,259 | $20,085 | $22,093 | $24,303 | $26,733 | $29,406 | $32,347 | $35,582 | $39,140 | $43,054 | $47,359 | $52,095 | |
| Direct Unit Costs | Month 1 | Month 2 | Month 3 | Month 4 | Month 5 | Month 6 | Month 7 | Month 8 | Month 9 | Month 10 | Month 11 | Month 12 | |
| Specialty Microbrewed Beer | 0.00% | $0.81 | $0.81 | $0.81 | $0.81 | $0.81 | $0.81 | $0.81 | $0.81 | $0.81 | $0.81 | $0.81 | $0.81 |
| Normal Microbrewed Beer | 0.00% | $0.65 | $0.65 | $0.65 | $0.65 | $0.65 | $0.65 | $0.65 | $0.65 | $0.65 | $0.65 | $0.65 | $0.65 |
| Domestic Beer | 0.00% | $0.48 | $0.
Pro Forma Profit and Loss Sales: Month 1: $18,259 Month 2: $20,085 Month 3: $22,093 Month 4: $24,303 Month 5: $26,733 Month 6: $29,406 Month 7: $32,347 Month 8: $35,582 Month 9: $39,140 Month 10: $43,054 Month 11: $47,359 Month 12: $52,095 Direct Cost of Sales: Month 1: $4,091 Month 2: $4,500 Month 3: $4,950 Month 4: $5,445 Month 5: $5,989 Month 6: $6,588 Month 7: $7,247 Month 8: $7,972 Month 9: $8,769 Month 10: $9,646 Month 11: $10,610 Month 12: $11,671 Production Payroll: Month 1-12: $4,838 Other: Month 1-12: $2,000 Total Cost of Sales: Month 1: $10,929 Month 2: $11,338 Month 3: $11,788 Month 4: $12,283 Month 5: $12,827 Month 6: $13,426 Month 7: $14,085 Month 8: $14,810 Month 9: $15,607 Month 10: $16,484 Month 11: $17,448 Month 12: $18,509 Gross Margin: Month 1: $7,330 Month 2: $8,747 Month 3: $10,306 Month 4: $12,020 Month 5: $13,906 Month 6: $15,980 Month 7: $18,262 Month 8: $20,772 Month 9: $23,533 Month 10: $26,570 Month 11: $29,911 Month 12: $33,586 Gross Margin %: Month 1: 40.15% Month 2: 43.55% Month 3: 46.65% Month 4: 49.46% Month 5: 52.02% Month 6: 54.34% Month 7: 56.46% Month 8: 58.38% Month 9: 60.13% Month 10: 61.71% Month 11: 63.16% Month 12: 64.47% Operating Expenses: Sales and Marketing Expenses: Month 1-12: $5,500 Sales and Marketing Payroll: Month 1-12: $0 Advertising/Promotion: Month 1: $5,000 Month 2: $4,000 Month 3: $3,000 Month 4-12: $0 Miscellaneous: Month 1-12: $500 Total Sales and Marketing Expenses: Month 1-12: $5,500 Sales and Marketing %: Month 1: 30.12% Month 2: 22.40% Month 3: 15.84% Month 4-12: 0.00% General and Administrative Expenses: General and Administrative Payroll: Month 1-12: $4,000 Sales and Marketing and Other Expenses: Month 1-12: $0 Depreciation: Month 1-12: $0 Leased Equipment: Month 1-12: $0 Utilities: Month 1-12: $750 Insurance: Month 1-12: $700 Rent: Month 1-12: $1,500 Payroll Taxes (15%): Month 1-12: $1,326 Other General and Administrative Expenses: Month 1-12: $0 Total General and Administrative Expenses: Month 1-12: $8,276 General and Administrative %: Month 1: 45.32% Month 2: 41.20% Month 3: 37.46% Month 4: 34.05% Month 5: 30.96% Month 6: 28.14% Month 7: 25.58% Month 8: 23.26% Month 9: 21.14% Month 10: 19.22% Month 11: 17.47% Month 12: 15.89% Other Expenses: Other Payroll: Month 1-12: $0 Consultants: Month 1-12: $0 Contract/Consultants: Month 1-2: $1,000 Month 3-12: $0 Total Other Expenses: Month 1-2: $1,000 Month 3-12: $0 Other %: Month 1-2: 5.48% Month 3-12: 0.00% Total Operating Expenses: Month 1: $14,776 Month 2: $13,776 Month 3: $11,776 Month 4-12: $11,776 Profit Before Interest and Taxes: Month 1: ($7,445) Month 2: ($5,029) Month 3: ($1,470) Month 4: $244 Month 5: $2,130 Month 6: $4,204 Month 7: $6,486 Month 8: $8,996 Month 9: $11,757 Month 10: $14,794 Month 11: $18,135 Month 12: $21,810 EBITDA: Month 1: ($7,445) Month 2: ($5,029) Month 3: ($1,470) Month 4: $244 Month 5: $2,130 Month 6: $4,204 Month 7: $6,486 Month 8: $8,996 Month 9: $11,757 Month 10: $14,794 Month 11: $18,135 Month 12: $21,810 Interest Expense: Month 1-6: $0 Month 7-8: $17 Month 9-10: $8 Month 11-12: $0 Taxes Incurred: Month 1: ($2,234) Month 2: ($1,257) Month 3: ($368) Month 4: $61 Month 5: $528 Month 6: $1,047 Month 7: $1,617 Month 8: $2,247 Month 9: $2,937 Month 10: $3,696 Month 11: $4,534 Month 12: $5,452 Net Profit: Month 1: ($5,212) Month 2: ($3,771) Month 3: ($1,103) Month 4: $183 Month 5: $1,585 Month 6: $3,141 Month 7: $4,852 Month 8: $6,741 Month 9: $8,812 Month 10: $11,089 Month 11: $13,601 Month 12: $16,357 Net Profit/Sales: Month 1: -28.54% Month 2: -18.78% Month 3: -4.99% Month 4: 0.75% Month 5: 5.93% Month 6: 10.68% Month 7: 15.00% Month 8: 18.94% Month 9: 22.51% Month 10: 25.76% Month 11: 28.72% Month 12: 31.40% Pro Forma Cash Flow: |
||||||||||
| Month 1 | Month 2 | Month 3 | Month 4 | Month 5 | Month 6 | Month 7 | Month 8 | Month 9 | Month 10 | Month 11 | Month 12 | ||
| Cash Received | |||||||||||||
| Cash from Operations | |||||||||||||
| Cash Sales | $18,259 | $20,085 | $22,093 | $24,303 | $26,733 | $29,406 | $32,347 | $35,582 | $39,140 | $43,054 | $47,359 | $52,095 | |
| Subtotal Cash from Operations | $18,259 | $20,085 | $22,093 | $24,303 | $26,733 | $29,406 | $32,347 | $35,582 | $39,140 | $43,054 | $47,359 | $52,095 | |
| Additional Cash Received | |||||||||||||
| Sales Tax, VAT, HST/GST Received | 0.00% | $0 | $0 | $0 | $0 | $0 | $0 | $0 | $0 | $0 | $0 | $0 | |
| New Current Borrowing | $0 | $0 | $0 | $2,000 | $0 | $0 | $0 | $0 | $0 | $0 | $0 | ||
| New Other Liabilities (interest-free) | $0 | $0 | $0 | $0 | $0 | $0 | $0 | $0 | $0 | $0 | $0 | ||
| New Long-term Liabilities | $0 | $0 | $0 | $0 | $0 | $0 | $0 | $0 | $0 | $0 | $0 | ||
| Sales of Other Current Assets | $0 | $0 | $0 | $0 | $0 | $0 | $0 | $0 | $0 | $0 | $0 | ||
| Sales of Long-term Assets | $0 | $0 | $0 | $0 | $0 | $0 | $0 | $0 | $0 | $0 | $0 | ||
| New Investment Received | $0 | $0 | $3,000 | $0 | $0 | $0 | $0 | $0 | $0 | $0 | $0 | ||
| Subtotal Cash Received | $18,259 | $20,085 | $22,093 | $27,303 | $28,733 | $29,406 | $32,347 | $35,582 | $39,140 | $43,054 | $47,359 | $52,095 | |
| Expenditures | Month 1 | Month 2 | Month 3 | Month 4 | Month 5 | Month 6 | Month 7 | Month 8 | Month 9 | Month 10 | Month 11 | Month 12 | |
| Expenditures from Operations | |||||||||||||
| Cash Spending | $8,838 | $8,838 | $8,838 | $8,838 | $8,838 | $8,838 | $8,838 | $8,838 | $8,838 | $8,838 | $8,838 | $8,838 | |
| Bill Payments | $595 | $17,773 | $15,448 | $14,885 | $15,862 | $16,948 | $18,130 | $19,429 | $20,852 | $22,425 | $24,154 | $26,050 | |
| Subtotal Spent on Operations | $9,433 | $26,611 | $24,286 | $23,723 | $24,700 | $25,786 | $26,968 | $28,267 | $29,690 | $31,263 | $32,992 | $34,888 | |
| Additional Cash Spent | |||||||||||||
| Sales Tax, VAT, HST/GST Paid Out | 0.00% | $0 | $0 | $0 | $0 | $0 | $0 | $0 | $0 | $0 | $0 | $0 | |
| Principal Repayment of Current Borrowing | $0 | $0 | $0 | $0 | $0 | $0 | $1,000 | $0 | $0 | $1,000 | $0 | ||
| Other Liabilities Principal Repayment | $0 | $0 | $0 | $0 | $0 | $0 | $0 | $0 | $0 | $0 | $0 | ||
| Long-term Liabilities Principal Repayment | $0 | $0 | $0 | $0 | $0 | $0 | $0 | $0 | $0 | $0 | $0 | ||
| Purchase Other Current Assets | $5,000 | $0 | $0 | $5,000 | $0 | $0 | $0 | $20,000 | $0 | $0 | $20,000 | $0 | |
| Purchase Long-term Assets | $0 | $0 | $0 | $0 | $0 | $0 | $0 | $0 | $0 | $0 | $0 | $0 | |
| Dividends | $0 | $0 | $0 | $0 | $0 | $0 | $0 | $0 | $0 | $0 | $0 | $0 | |
| Subtotal Cash Spent | $14,433 | $26,611 | $24,286 | $28,723 | $24,700 | $25,786 | $26,968 | $49,267 | $29,690 | $31,263 | $53,992 | $34,888 | |
| Net Cash Flow | $
Business Plan Outline
|
Hello!
I’m Andrew Brooks, a seasoned finance consultant from the USA and the mind behind phonenumber247.com.
My career is built on a foundation of helping individuals and businesses thrive financially in an ever-changing economic landscape. At phonenumber247.com, my aim is to demystify the complex world of finance, providing clear, actionable advice that can help you navigate your financial journey with confidence. Whether it’s personal finance management, investment strategies, or understanding the nuances of market dynamics, I’m here to share insights and tools that can propel you towards your financial goals.
Welcome to my digital space, where every piece of advice is a step closer to financial clarity and success!

