Contents
Horse Boarding Real Estate Business Plan
Today, who in business doesn’t know and love the story of poor migrant gentleman Levi Strauss? But just in case, and since it holds a striking resemblance to the future story of EquineAcres, here’s a short recap.
Levi Strauss arrived in California during the great gold rush. He, along with tens-of-thousands of others, aimed to strike it rich and live a life of wealth. But Levi observed that for every 1 person who struck gold, 1,000 returned penniless. He also noticed a shortage of supplies, and that those supplying the gold seekers made their fortune without ever leaving the city. One commodity in short supply was canvas. Levi sent money to his relatives back East to buy canvas and have it shipped to him in San Francisco. Within days, he sold the canvas at a significant profit. He ordered more, sold more, and continued to grow his supply business. Levi never pursued gold; instead, he found his fortune in supplying the gold seekers. The rest, as they say, is history. Levi Strauss & Co. is now a member of the global Fortune 1000, with over 100 years of profitable business.
EquineAcres follows the same simple business concept. The equine industry is a multi-billion dollar industry in America, with Oklahoma ranked 4th in activity. The writer of this business plan has already experienced the typical form of equine business and found it lacking in financial reward. However, blessings can often be mixed, and that’s the case with this business proposal. The EquineAcres business plan is the result of experience in the equine business, which has identified the real opportunity. EquineAcres is not directly involved with the horse business but meets the needs and desires of those who are. Thank you, Mr. Strauss.
In short, EquineAcres will utilize the business knowledge and experience of a 20-year successful professional career. It will leverage existing business contacts, target market knowledge, and relationships to penetrate an underserved market in a highly lucrative industry. EquineAcres offers unique products and services in a format previously unavailable, creating a profitable and scalable business ideally suited for exponential growth.
The reviewer of this business plan is invited to review its content in detail. If the potential is recognized, please contact the originator for further discussions to establish a mutually profitable and rewarding business relationship.
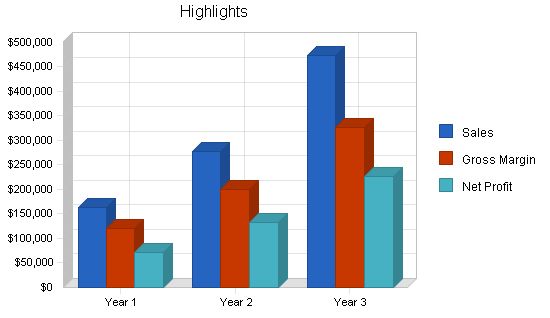
EquineAcres is a resort community dedicated to horses and their owners. Our primary focus is exceptional care, 24-hour monitoring, health, safety, and security for the horses. For owners, our focus is on providing a community atmosphere, professional and reliable business operations, competitive pricing for equine products and services, and a full-service facility to meet all equestrian needs. Above all, customer service, professional staff, and the good of the community are our top priorities.
The success of EquineAcres relies on maintaining a 100% lease rate.
Our primary objectives for EquineAcres are:
– Percentage of leased lots: 80% minimum, 90% acceptable medium, 100% primary goal.
EquineAcres is a unique community environment that caters to the unfulfilled needs of equine owners. This concept, although not new in other markets, is new to the equine market in Oklahoma. While golf communities and tennis resorts are common, there hasn’t been a similar offering for equine owners, despite their affluence and passion.
Previously, equine owners had to rely on various sources to meet their needs. EquineAcres will provide a single, well-run facility that offers boarding, care, representation, serious practice, and playful enjoyment for both horse and owner. Additionally, our community atmosphere is designed to meet the emotional and social needs of owners.
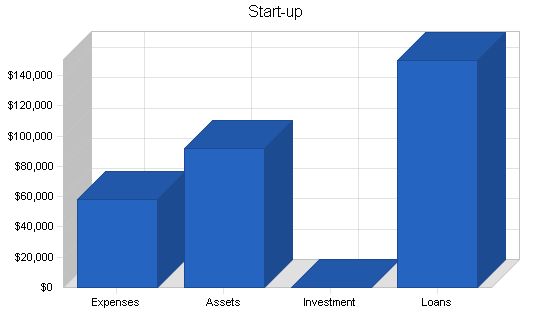
In terms of start-up requirements, the total investment needed to open EquineAcres is $150,000. This includes land, equipment, inventory, improvements, and six months of operating capital for owner salary, loan payments, and monthly expenses. Our goal is to secure funding for the full amount.
Start-up Requirements
Start-up Expenses
– Buildings: Central Barn + BarnRooms
– Improvements: Survey, Fence, Utilities, etc.
– Operating Equipment
– Insurance
– Marketing: Printed & Internet
– Financial & Legal Counsel
– Misc. Expense
– Total Start-up Expenses: $58,000
Start-up Assets
– Cash Required
– Start-up Inventory
– Other Current Assets
– Long-term Assets
– Total Assets: $92,000
Total Requirements: $150,000
Start-up Funding
– Start-up Expenses to Fund
– Start-up Assets to Fund
– Total Funding Required: $150,000
Assets
– Non-cash Assets from Start-up
– Cash Requirements from Start-up
– Additional Cash Raised
– Cash Balance on Starting Date
– Total Assets: $92,000
Liabilities and Capital
– Liabilities
– Current Borrowing
– Long-term Liabilities
– Accounts Payable (Outstanding Bills)
– Other Current Liabilities (interest-free)
– Total Liabilities: $150,000
Capital
– Planned Investment
– Investor 1
– Other
– Additional Investment Requirement
– Total Planned Investment: $0
– Loss at Start-up (Start-up Expenses): ($58,000)
– Total Capital: ($58,000)
– Total Capital and Liabilities: $92,000
– Total Funding: $150,000
Company Ownership
The final legal business entity format of EquineAcres is yet to be determined. Lender/investor preferences, along with legal/financial counsel, will make this final determination prior to, and as a condition of, funding.
Company Locations and Facilities
EquineAcres will be situated on a 160 acre section of land within one mile of a State Highway, in Central Oklahoma. This location will be within a 30 minute drive from Stillwater, Guthrie, Chandler, Cushing, and Perkins, Oklahoma. It will also be within a 30 minute drive from Oklahoma State University and Langston University. The intent is to secure an immediate purchase of 80 acres, with a two year lease option on the additional 80 acres. The facilities will include 10: 5-acre tracts, a central barn, a lighted arena, round-pens, temporary holding pens, and 80 acres for pleasure riding, trail practice, picnicking, etc.
Products and Services
EquineAcres is designed to provide a single source for equine owners. It will offer equine boarding, a full range of products, equine services, facilities, business services, retreat community atmosphere, and future products and services.
Membership Lease
– Includes a 5-acre retreat with private barn room, full board, weekly reports, horse history report, locked-gate security, access to vet and farrier, and access to EquineAcres products and services.
Feed and Hay
EquineAcres will offer feed and hay for purchase by members at a lower cost.
Tack and Supply
EquineAcres will offer tack and horse supplies for sale, including online resale.
Web Service
EquineAcres will offer website design and hosting to its members.
Contract Services
EquineAcres will contract with local horse services, such as vets, farriers, and trainers.
Close Care
EquineAcres will offer close care stalls for horses needing intensive care.
Horse Sales
EquineAcres will offer horse sales services.
Food Vendor
EquineAcres will contract with a local food vendor for weekends and special events.
Special Events
EquineAcres will host special events, such as clinics and barn-dances.
Barn Rooms
EquineAcres has contracted with a local builder to design and build Barn Rooms for resale.
Additional Products and Services
EquineAcres will add additional products and services as needed.
Sales Literature
EquineAcres will have a brochure, a teaser postcard, and a professional website as sales literature.
Fulfillment
EquineAcres will leverage existing business contacts and acquired skills for fulfillment.
Technology
EquineAcres will utilize technology to differentiate itself and provide a higher level of service to equine owners.
Future Products and Services
EquineAcres plans to expand its offerings and open additional facilities in other markets.
Competitive Comparison
EquineAcres is a unique entity in the equine marketplace, offering a complete range of products and services not available elsewhere.
Market Analysis Summary
The Oklahoma market is highly equine-centric, with a large equine inventory and active equine market.
Target Market Segment Strategy
EquineAcres will target existing pleasure equine owners, existing business equine owners, and non-equine owners looking to become equine owners.
Market Growth
EquineAcres’ growth will come from market penetration and meeting an existing unmet market need, rather than overall market growth.
Market Needs
EquineAcres addresses the challenges and requirements of equine ownership, providing a safe and upscale environment with full care and monitoring.
Service Business Analysis
EquineAcres offers a complete line of products and services for equine owners, with convenience and competitive pricing.
Distributing a Service
EquineAcres provides a single source for equine owners, offering convenience and competitive pricing.
Competition and Buying Patterns
Equine owners typically rely on multiple suppliers for their equine needs, but EquineAcres’ convenience and pricing will attract most customers.
Equine owners prioritize three factors when making purchases: price, convenience, and quality. The importance of each factor depends on the owner’s position as an owner.
– Pleasure owners may prioritize quality first, followed by price and convenience.
– Casual owners may prioritize convenience first, followed by quality and price.
– Business owners may prioritize price first, followed by convenience and quality.
EquineAcres has the ability to meet all three buying patterns:
Price:
EquineAcres can provide competitive prices through strategic business relationships, volume purchase capability, and effective sales and marketing.
Convenience:
EquineAcres offers maximum convenience by providing a single source for purchasing products and accessing services. They also offer a total care approach, relieving equine owners of daily responsibilities.
Quality:
EquineAcres has existing business relationships that provide high-quality products and services unmatched by any other source. They continuously update their offerings with newer, higher-quality products and services.
Equine Boarding:
Current boarding facilities in the area offer two types of boarding:
– Partial Board: Requires the owner to care for their equine at least once per day. Average cost: $75/month/equine.
– Full Board: Offers full care similar to EquineAcres. Average cost: $350/month/equine.
EquineAcres also offers products, services, facilities, and business services that are not available through a single source. They also provide a unique retreat community that does not exist in the local or national region.
The strategy and implementation of EquineAcres is simple: utilize the owner’s 20-year successful professional career, business contacts, target market knowledge, and relationships to penetrate an underserved market and create a profitable and expandable business.
The value proposition of EquineAcres is to provide a convenient single source that meets all the needs of equine owners at a competitive price in a unique community environment, backed by solid and innovative business operations. This is achievable and will lead to financial success.
EquineAcres has several competitive edges, including a unique format, convenience, quality, and price. Another major competitive advantage is the owner, Edward A. Graves, who brings valuable skills, experience, and contacts to the business.
The marketing strategy of EquineAcres leverages the co-located target market, their reliance on local vendors, their reliance on the Internet for information, and their preference for newspaper classified advertisements. The marketing approach aims to capture the market’s attention and retain and expand their business through exceptional practices and customer support.
EquineAcres’ pricing strategy is as follows:
– Retreat lease: $300/month including one equine.
– Additional equine on the same retreat: $50/month.
– Full Board at EquineAcres for three equine: $400/month.
– Comparable Full Board at competitors for three equine: $1,050/month.
– Other products and services will be priced slightly above average, with margins above 100%.
The promotion strategy of EquineAcres revolves around an active and effective website that will serve as the central point for all promotional and ongoing business activities. They will also distribute a 4-page brochure through equine-related businesses and use newspaper classified advertising.
EquineAcres will rely on direct selling for retreat leases and additional sales activity through their website. They will also leverage existing business relationships to gain exposure and maximize margins from resale products and services.
The marketing programs of EquineAcres will focus on driving traffic to the website through search engine submissions, distributing brochures, teaser cards, and classified advertising, as well as referrals from strategic partnerships.
The sales strategy of EquineAcres is to sell retreat leases to 100% capacity.
The sales forecast is based on experience, understanding seasonal sales cycles, customer requirements, and realistic growth. The forecast includes retreat leases, additional equine on existing retreats, equine consumables, tack, services, web pages, websites, added services, major equipment sales, and sale commissions.
By implementing these strategies, EquineAcres aims to achieve their goals of providing a convenient single source for equine owners, creating a profitable business, and expanding their capacity in the future.
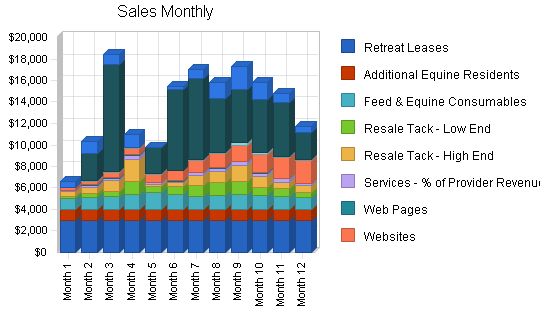
Sales Forecast
Unit Sales
Retreat Leases
Year 1: 120
Year 2: 180
Year 3: 240
Additional Equine Residents
Year 1: 240
Year 2: 360
Year 3: 480
Feed & Equine Consumables
Year 1: 1,520
Year 2: 2,250
Year 3: 3,000
Resale Tack – Low End
Year 1: 365
Year 2: 500
Year 3: 1,000
Resale Tack – High End
Year 1: 51
Year 2: 100
Year 3: 250
Services – % of Provider Revenue
Year 1: 290
Year 2: 500
Year 3: 750
Web Pages
Year 1: 63
Year 2: 72
Year 3: 72
Websites
Year 1: 256
Year 2: 500
Year 3: 750
EquineAcres Added Services
Year 1: 110
Year 2: 175
Year 3: 250
Major Equipment Sales
Year 1: 21
Year 2: 40
Year 3: 80
Show & Sell Commissions
Year 1: 39
Year 2: 60
Year 3: 80
Total Unit Sales
Year 1: 3,075
Year 2: 4,737
Year 3: 6,952
Unit Prices
Retreat Leases
Year 1: $300.00
Year 2: $300.00
Year 3: $300.00
Additional Equine Residents
Year 1: $50.00
Year 2: $50.00
Year 3: $50.00
Feed & Equine Consumables
Year 1: $10.00
Year 2: $10.00
Year 3: $10.00
Resale Tack – Low End
Year 1: $25.00
Year 2: $25.00
Year 3: $25.00
Resale Tack – High End
Year 1: $200.00
Year 2: $200.00
Year 3: $200.00
Services – % of Provider Revenue
Year 1: $10.00
Year 2: $10.00
Year 3: $10.00
Web Pages
Year 1: $10.00
Year 2: $10.00
Year 3: $10.00
Websites
Year 1: $50.00
Year 2: $50.00
Year 3: $50.00
EquineAcres Added Services
Year 1: $10.00
Year 2: $10.00
Year 3: $10.00
Major Equipment Sales
Year 1: $2,500.00
Year 2: $2,500.00
Year 3: $2,500.00
Show & Sell Commissions
Year 1: $300.00
Year 2: $300.00
Year 3: $300.00
Sales
Retreat Leases
Year 1: $36,000
Year 2: $54,000
Year 3: $72,000
Additional Equine Residents
Year 1: $12,000
Year 2: $18,000
Year 3: $24,000
Feed & Equine Consumables
Year 1: $15,200
Year 2: $22,500
Year 3: $30,000
Resale Tack – Low End
Year 1: $9,125
Year 2: $12,500
Year 3: $25,000
Resale Tack – High End
Year 1: $10,200
Year 2: $20,000
Year 3: $50,000
Services – % of Provider Revenue
Year 1: $2,900
Year 2: $5,000
Year 3: $7,500
Web Pages
Year 1: $630
Year 2: $720
Year 3: $720
Websites
Year 1: $12,800
Year 2: $25,000
Year 3: $37,500
EquineAcres Added Services
Year 1: $1,100
Year 2: $1,750
Year 3: $2,500
Major Equipment Sales
Year 1: $52,500
Year 2: $100,000
Year 3: $200,000
Show & Sell Commissions
Year 1: $11,700
Year 2: $18,000
Year 3: $24,000
Total Sales
Year 1: $164,155
Year 2: $277,470
Year 3: $473,220
Direct Unit Costs
Retreat Leases
Year 1: $0.00
Year 2: $0.00
Year 3: $0.00
Additional Equine Residents
Year 1: $0.00
Year 2: $0.00
Year 3: $0.00
Feed & Equine Consumables
Year 1: $5.00
Year 2: $5.00
Year 3: $5.00
Resale Tack – Low End
Year 1: $12.50
Year 2: $12.50
Year 3: $12.50
Resale Tack – High End
Year 1: $100.00
Year 2: $100.00
Year 3: $100.00
Services – % of Provider Revenue
Year 1: $0.00
Year 2: $0.00
Year 3: $0.00
Web Pages
Year 1: $0.00
Year 2: $0.00
Year 3: $0.00
Websites
Year 1: $20.00
Year 2: $20.00
Year 3: $20.00
EquineAcres Added Services
Year 1: $0.00
Year 2: $0.00
Year 3: $0.00
Major Equipment Sales
Year 1: $1,000.00
Year 2: $1,000.00
Year 3: $1,000.00
Show & Sell Commissions
Year 1: $0.00
Year 2: $0.00
Year 3: $0.00
Direct Cost of Sales
Retreat Leases
Year 1: $0
Year 2: $0
Year 3: $0
Additional Equine Residents
Year 1: $0
Year 2: $0
Year 3: $0
Feed & Equine Consumables
Year 1: $7,600
Year 2: $11,250
Year 3: $15,000
Resale Tack – Low End
Year 1: $4,563
Year 2: $6,250
Year 3: $12,500
Resale Tack – High End
Year 1: $5,100
Year 2: $10,000
Year 3: $25,000
Services – % of Provider Revenue
Year 1: $0
Year 2: $0
Year 3: $0
Web Pages
Year 1: $0
Year 2: $0
Year 3: $0
Websites
Year 1: $5,120
Year 2: $10,000
Year 3: $15,000
EquineAcres Added Services
Year 1: $0
Year 2: $0
Year 3: $0
Major Equipment Sales
Year 1: $21,000
Year 2: $40,000
Year 3: $80,000
Show & Sell Commissions
Year 1: $0
Year 2: $0
Year 3: $0
Subtotal Direct Cost of Sales
Year 1: $43,383
Year 2: $77,500
Year 3: $147,500
Management Summary
Initially, EquineAcres will be wholly owned and operated by Edward A. Graves. The owner has maintained this level of effort and production for several years. With EquineAcres, all of the owner’s efforts will be focused on a single project. Current associates will testify to the owner’s organizational and prioritization skills that have allowed for this level of task assumption.
Following successful operation, the owner will hire a “manager trainee” to learn the EquineAcres operation with the potential of becoming the on-site manager. This on-site management concept will be used in future expansions of EquineAcres*2, *3, etc.
Business and personal contacts will be utilized as needed on a contract basis to assist with labor. As the Internet shopping aspect of EquineAcres increases, additional part-time staff will be added to handle shipping and handling tasks.
Organizational Structure
The legal form of the company will be determined in conjunction with the funding source. The structure will have a single business entity with two sub-entities operating under the umbrella company.
The Graves Company–Parent Company
1. EquineAcres–All business taking place “on-premise.”
2. Graves Farm eXchange–Equine business conducted “off-premise.”
This structure allows for potential business opportunities as they arise.
Management Team
The key Management Team member will be Edward A. Graves, owner/operator of EquineAcres and author of this business plan. Resume overview:
– 20+ years of successful business career primarily in sales, marketing, sales management, and operations management.
– 5+ successful years in the equine industry.
– 5+ years operating a small equine-related home side-business.
– Versatile range of technical and trade abilities.
– Strong computer skills.
– Creative abilities.
– Reputation for organizational skills and time management.
– Extensive contacts in general business and equine activity.
In addition, EquineAcres management will be supported by the owner’s wife, who has computer and internet skills and strong equine knowledge.
Management Team Gaps
Identified gaps and their resolutions include:
1. Legal and financial expertise not currently possessed.
– Retaining legal and accounting services.
– Personal study and self-education.
2. Extreme reliance on a single individual, the owner.
– Full participation of immediate family members.
– Eventual hire and training of on-site manager.
– Sufficient disability and death insurance.
Personnel Plan
Year 1: Salary to owner/manager of $3,000/month.
Year 2: Salary to owner/manager of $3,000/month + hire of assistant staff (on-site manager in training) at $16,000/year.
Year 3: On-site manager salary of $36,000/year + assistant staff (on-site managers in training) at $16,000/year.
A note of critical importance to any potential lender or investor:
Upon securing funding for this project, EquineAcres will use almost 100% of the funding to purchase undeveloped land and develop it. The development will greatly improve the value of the land to the point where the entire loan/investment amount is recoverable, even potentially profitable, through resale of the improved land, buildings, and equipment. This funding request should be considered as "secured."
The financial plan for EquineAcres demonstrates:
– Profitability
– Solid cash flow
– Sufficient profit and cash flow to cushion against unforeseen challenges
– Solid growth expectations based on conservative estimates
The financial plan is assembled from extensive business experience, knowledge of the equine marketplace, and reliance on software for general assumption calculations.
Important Assumptions
Important notes about the General Assumptions:
– All calculations are recommended by the software program used to create this business plan.
– Future modifications will be made with potential lenders/investors to accurately reflect actual values.
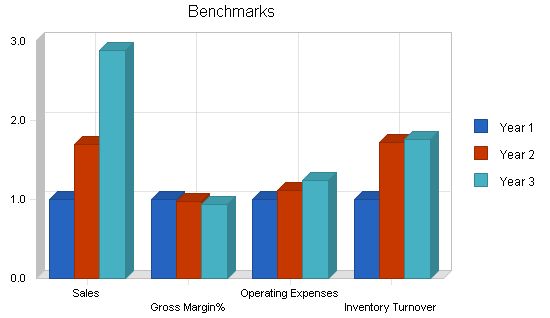
Key Financial Indicators
Important notes about Benchmarks:
– The chart is assembled from data throughout this business plan.
– It is self-calculating and will update automatically with changes made elsewhere in the plan.
7.3 Break-even Analysis
- Average Per Unit Revenue–Taken from Detailed Forecast.
- Average Per Unit Variable Cost–Taken from Detailed Forecast.
- Estimated Monthly Fixed Cost–Calculated by Owner Salary + Loan Payment + Average Utilities.
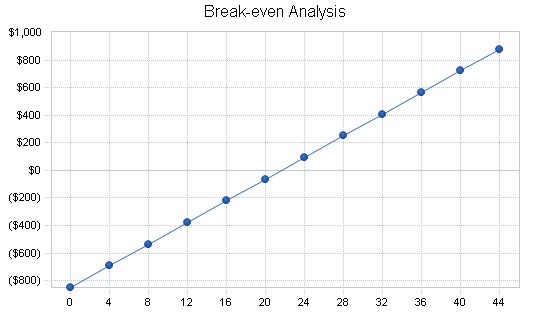
"Break-even Analysis
Monthly Units Break-even: 22
Monthly Revenue Break-even: $1,155
Assumptions:
Average Per-Unit Revenue: $53.38
Average Per-Unit Variable Cost: $14.11
Estimated Monthly Fixed Cost: $850
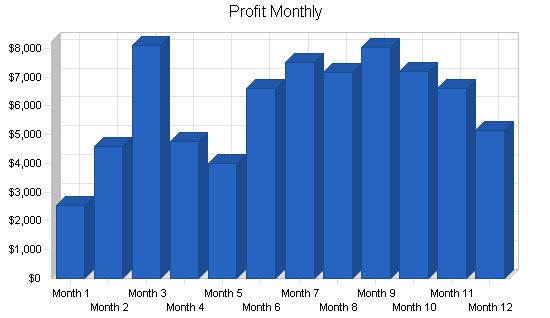
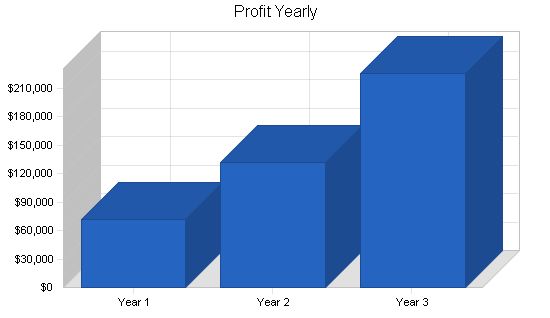
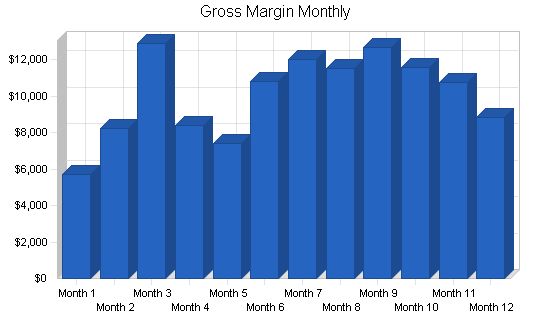
7.4 Projected Profit and Loss
Important notes about Profit and Loss:
– The attached Profit and Loss Statement is assembled from data contained throughout this business plan. Refer to all other sections for detailed information validating the Profit and Loss result.
– This is primarily a self-calculating table; future modifications in cooperation with lender/investors will automatically update this table to reflect changes made elsewhere in this business plan."
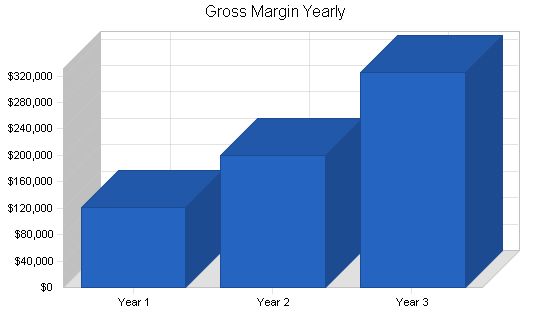
Pro Forma Profit and Loss:
| Pro Forma Profit and Loss | |||
| Year 1 | Year 2 | Year 3 | |
| $164,155 | $277,470 | $473,220 | |
| $43,383 | $77,500 | $147,500 | |
| $0 | $0 | $0 | |
| $43,383 | $77,500 | $147,500 | |
| $120,773 | $199,970 | $325,720 | |
| 73.57% | 72.07% | 68.83% | |
| $2,400 | $3,600 | $4,800 | |
| $0 | $0 | $0 | |
| $3,000 | $3,000 | $3,000 | |
| $4,800 | $4,800 | $4,800 | |
| $0 | $0 | $0 | |
| $0 | $0 | $0 | |
| $0 | $0 | $0 | |
| $10,200 | $11,400 | $12,600 | |
| $110,573 | $188,570 | $313,120 | |
| $110,573 | $188,570 | $313,120 | |
| $14,025 | $12,300 | $10,500 | |
| $24,318 | $44,068 | $76,916 | |
| $72,229 | $132,203 | $225,704 | |
| 44.00% | 47.65% | 47.70% | |
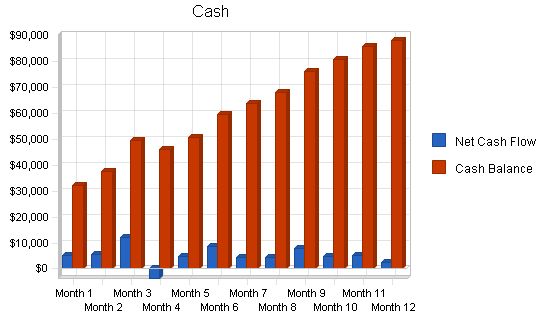
Projected Cash Flow:
7.5 Projected Cash Flow
Important notes about Cash Flow:
- See line item: Long Term Borrowing Repayment in the Pro-forma Cash Flow Table:
- This figure is a gross estimate based on conventional repayment of a long-term business loan. Should funding come from a private investor, this line item will be dramatically altered.
Pro Forma Cash Flow
| Pro Forma Cash Flow | |||
| Year 1 | Year 2 | Year 3 | |
| Cash Received | |||
| Cash from Operations | |||
| Cash Sales | $164,155 | $277,470 | $473,220 |
| Subtotal Cash from Operations | $164,155 | $277,470 | $473,220 |
| Additional Cash Received | |||
| Sales Tax, VAT, HST/GST Received | $0 | $0 | $0 |
| New Current Borrowing | $0 | $0 | $0 |
| New Other Liabilities (interest-free) | $0 | $0 | $0 |
| New Long-term Liabilities | $0 | $0 | $0 |
| Sales of Other Current Assets | $0 | $0 | $0 |
| Sales of Long-term Assets | $0 | $0 | $0 |
| New Investment Received | $0 | $0 | $0 |
| Subtotal Cash Received | $164,155 | $277,470 | $473,220 |
| Expenditures | |||
| Expenditures from Operations | |||
| Cash Spending | $0 | $0 | $0 |
| Bill Payments | $84,937 | $140,885 | $244,110 |
| Subtotal Spent on Operations | $84,937 | $140,885 | $244,110 |
| Additional Cash Spent | |||
| Sales Tax, VAT, HST/GST Paid Out | $0 | $0 | $0 |
| Principal Repayment of Current Borrowing | $0 | $0 | $0 |
| Other Liabilities Principal Repayment | $0 | $0 | $0 |
| Long-term Liabilities Principal Repayment | $18,000 | $18,000 | $18,000 |
| Purchase Other Current Assets | $0 | $0 | $0 |
| Purchase Long-term Assets | $0 | $0 | $0 |
| Dividends | $0 | $0 | $0 |
| Subtotal Cash Spent | $102,937 | $158,885 | $262,110 |
| Net Cash Flow | $61,218 | $118,585 | $211,110 |
| Cash Balance | $88,218 | $206,803 | $417,913 |
7.6 Projected Balance Sheet
Important notes about the Balance Sheet:
– The attached Balance Sheet is assembled from data contained throughout this business plan. Refer to all other sections for detailed information validating the Balance Sheet result.
– This is a self-calculating table; future modifications in cooperation with lender/investors will automatically update this chart to reflect changes made elsewhere in this business plan.
| Pro Forma Balance Sheet | |||
| Year 1 | Year 2 | Year 3 | |
| Assets | |||
| Current Assets | |||
| Cash | $88,218 | $206,803 | $417,913 |
| Inventory | $3,234 | $5,777 | $10,996 |
| Other Current Assets | $0 | $0 | $0 |
| Total Current Assets | $91,452 | $212,581 | $428,909 |
| Long-term Assets | |||
| Long-term Assets | $60,000 | $60,000 | $60,000 |
| Accumulated Depreciation | $0 | $0 | $0 |
| Total Long-term Assets | $60,000 | $60,000 | $60,000 |
| Total Assets | $151,452 | $272,581 | $488,909 |
| Liabilities and Capital | |||
| Current Liabilities | |||
| Accounts Payable | $5,223 | $12,149 | $20,773 |
| Current Borrowing | $0 | $0 | $0 |
| Other Current Liabilities | $0 | $0 | $0 |
| Subtotal Current Liabilities | $5,223 | $12,149 | $20,773 |
| Long-term Liabilities | $132,000 | $114,000 | $96,000 |
| Total Liabilities | $137,223 | $126,149 | $116,773 |
| Paid-in Capital | $0 | $0 | $0 |
| Retained Earnings | ($58,000) | $14,229 | $146,432 |
| Earnings | $72,229 | $132,203 | $225,704 |
| Total Capital | $14,229 | $146,432 | $372,136 |
| Total Liabilities and Capital | $151,452 | $272,581 | $488,909 |
| Net Worth | $14,229 | $146,432 | $372,136 |
7.7 Business Ratios
Important notes about the Business Ratios:
– The attached Business Ratios table is assembled from data contained throughout this business plan. Refer to all other sections for detailed information validating the Business Ratios result.
– This is a self-calculating table; future modifications in cooperation with lender/investors will automatically update this chart to reflect changes made elsewhere in this business plan.
– Standard ratios from Industry Profile SIC code 7032, Sporting and Recreational Camps is provided in the table.
| Ratio Analysis | ||||
| Year 1 | Year 2 | Year 3 | Industry Profile | |
| Sales Growth | 0.00% | 69.03% | 70.55% | 7.50% |
| Percent of Total Assets | ||||
| Inventory | 2.14% | 2.12% | 2.25% | 1.10% |
| Other Current Assets | 0.00% | 0.00% | 0.00% | 26.90% |
| Total Current Assets | 60.38% | 77.99% | 87.73% | 33.40% |
| Long-term Assets | 39.62% | 22.01% | 12.27% | 66.60% |
| Total Assets | 100.00% | 100.00% | 100.00% | 100.00% |
| Current Liabilities | ||||
| Accounts Payable | 5.23% | 12.15% | 20.77% | 16.30% |
| Long-term Liabilities | 87.16% | 41.82% | 19.64% | 38.40% |
| Total Liabilities | 90.60% | 46.28% | 23.88% | 54.70% |
| Net Worth | 9.40% | 53.72% | 76.12% | 45.30% |
| Percent of Sales | ||||
| Sales | 100.00% | 100.00% | 100.00% | 100.00% |
| Gross Margin | 73.57% | 72.07% | 68.83% | 0.00% |
| Selling, General & Administrative Expenses | 45.91% | 38.48% | 29.11% | 70.30% |
| Advertising Expenses | 0.73% | 0.86% | 0.76% | 5.10% |
| Profit Before Interest and Taxes | 67.36% | 67.96% | 66.17% | 4.20% |
| Pro Forma Balance Sheet | |||||||||||||
| Month 1 | Month 2 | Month 3 | Month 4 | Month 5 | Month 6 | Month 7 | Month 8 | Month 9 | Month 10 | Month 11 | Month 12 | ||
| Assets | Starting Balances | ||||||||||||
| Current Assets | |||||||||||||
| Cash | $27,000 | $32,014 | $37,656 | $49,682 | $46,005 | $50,631 | $59,423 | $63,736 | $68,130 | $76,013 | $80,687 | $85,885 | $88,218 |
| Inventory | $5,000 | $4,095 | $2,938 | $6,105 | $3,540 | $2,673 | $5,099 | $5,544 | $4,725 | $5,088 | $4,626 | $4,439 | $3,234 |
| Other Current Assets | $0 | $0 | $0 | $0 | $0 | $0 | $0 | $0 | $0 | $0 | $0 | $0 | $0 |
| Total Current Assets | $32,000 | $36,109 | $40,593 | $55,787 | $49,545 | $53,304 | $64,522 | $69,280 | $72,854 | $81,101 | $85,312 | $90,323 | $91,452 |
| Long-term Assets | |||||||||||||
| Long-term Assets | $60,000 | $60,000 | $60,000 | $60,000 | $60,000 | $60,000 | $60,000 | $60,000 | $60,000 | $60,000 | $60,000 | $60,000 | $60,000 |
| Accumulated Depreciation | $0 | $0 | $0 | $0 | $0 | $0 | $0 | $0 | $0 | $0 | $0 | $0 | $0 |
| Total Long-term Assets | $60,000 | $60,000 | $60,000 | $60,000 | $60,000 | $60,000 | $60,000 | $60,000 | $60,000 | $60,000 | $60,000 | $60,000 | $60,000 |
| Total Assets | $92,000 | $96,109 | $100,593 | $115,787 | $109,545 | $113,304 | $124,522 | $129,280 | $132,854 | $141,101 | $145,312 | $150,323 | $151,452 |
| Liabilities and Capital | |||||||||||||
| Current Liabilities | |||||||||||||
| Accounts Payable | $0 | $3,070 | $4,455 | $13,035 | $3,520 | $4,772 | $10,904 | $9,664 | $7,595 | $9,326 | $7,845 | $7,747 | $5,223 |
| Current Borrowing | $0 | $0 | $0 | $0 | $0 | $0 | $0 | $0 | $0 | $0 | $0 | $0 | $0 |
| Other Current Liabilities | $0 | $0 | $0 | $0 | $0 | $0 | $0 | $0 | $0 | $0 | $0 | $0 | $0 |
| Subtotal Current Liabilities | $0 | $3,070 | $4,455 | $13,035 | $3,520 | $4,772 | $10,904 | $9,664 | $7,595 | $9,326 | $7,845 | $7,747 | $5,223 |
| Long-term Liabilities | |||||||||||||
| Long-term Liabilities | $150,000 | $148,500 | $147,000 | $145,500 | $144,000 | $142,500 | $141,000 | $139,500 | $138,000 | $136,500 | $135,000 | $133,500 | $132,000 |
| Total Liabilities | $150,000 | $151,570 | $151,455 | $158,535 | $147,520 | $147,272 | $151,904 | $149,164 | $145,595 | $145,826 | $142,845 | $141,247 | $137,223 |
| Paid-in Capital | $0 | $0 | $0 | $0 | $0 | $0 | $0 | $0 | $0 | $0 | $0 | $0 | $0 |
| Retained Earnings | ($58,000) | ($58,000) | ($58,000) | ($58,000) | ($58,000) | ($58,000) | ($58,000) | ($58,000) | ($58,000) | ($58,000) | ($58,000) | ($58,000) | ($58,000) |
| Earnings | $0 | $2,539 | $7,139 | $15,252 | $20,026 | $24,032 | $30,617 | $38,116 | $45,259 | $53,275 | $60,467 | $67,077 | $72,229 |
| Total Capital | ($58,000) | ($55,461) | ($50,861) | ($42,748) | ($37,975) | ($33,968) | ($27,383) | ($19,885) | ($12,741) | ($4,725) | $2,467 | $9,077 | $14,229 |
| Total Liabilities and Capital | $92,000 | $96,109 | $100,593 | $115,787 | $109,545 | $113,304 | $124,522 | $129,280 | $132,854 | $141,101 | $145,312 | $150,323 | $151,452 |
| Net Worth | ($58,000) | ($55,461) | ($50,861) | ($42,748) | ($37,975) | ($33,968) | ($27,383) | ($19,884) | ($12,741) | ($4,725) | $2,467 | $9,077 | $14,229 |

Business Plan Outline
- Executive Summary
- Company Summary
- Products and Services
- Market Analysis Summary
- Strategy and Implementation Summary
- Management Summary
- Financial Plan
- Appendix
Hello!
I’m Andrew Brooks, a seasoned finance consultant from the USA and the mind behind phonenumber247.com.
My career is built on a foundation of helping individuals and businesses thrive financially in an ever-changing economic landscape. At phonenumber247.com, my aim is to demystify the complex world of finance, providing clear, actionable advice that can help you navigate your financial journey with confidence. Whether it’s personal finance management, investment strategies, or understanding the nuances of market dynamics, I’m here to share insights and tools that can propel you towards your financial goals.
Welcome to my digital space, where every piece of advice is a step closer to financial clarity and success!
