Machine Tooling, a Kansas City-based company, aims to succeed by using high-quality techniques and prioritizing customer service. Over the past two years, the company has worked hard to establish its infrastructure and systems for handling a significant amount of business. We have made leasehold improvements, hired a qualified and experienced staff, and built ready-to-market machines and automated systems. Additionally, we have developed strong relationships with customers and plan to offer value-added improvements to further integrate the business.
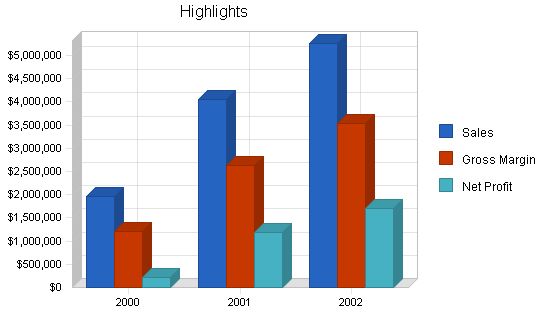
Our management team, consisting of Mr. Peter Newton (CEO), Mr. John Abbot (President), and Mr. Chris Manuel (VP of Marketing), has extensive knowledge and experience in manufacturing, automation, and finance. Projected revenues for Year 1 to Year 3 are $1.9 million, $4.1 million, and $5.3 million, respectively. To support growth and attract a larger customer base, we are seeking $500,000 for expansion purposes such as marketing new product lines, entering new markets, and purchasing additional equipment.
Going public will positively impact our sales ability, allowing us to reduce overall debt and gain a competitive advantage in the manufacturing industry. This expansion will enable us to establish a larger, more diversified customer base and generate increased sales revenue. Our mission is to succeed by utilizing high-quality techniques and prioritizing customer service. Our key to success lies in providing superb customer service, fast delivery, and securing new customers in the served market niches.
Company Summary
Business Description
Machine Tooling has been operating in Kansas City since May, 1989. We are a Kansas LLC. The company occupies 10,000 square feet of manufacturing area, including offices for administration, engineering, and quality assurance.
Overview of Technology and Products
Machine Tooling provides full-service, close-tolerance contract machining of machine and tooling components, production machining, and automation of production lines. The diverse manufacturing equipment at our facility allows the plant to operate self-sufficiently.
Managerial expertise and industry experience have helped the company show profits every year since its inception. Over the past three years, the company further entrenched its position in the market niche, resulting in healthy financials (see Table 2.1).
2.1 Company History
Machine Tooling was founded in Kansas City in 1989 to provide quality machine tools for selected industries. The owners had worked in this field for several years and had established multiple business contacts who helped the company pick up major accounts. By 1999, the company’s revenues reached $1.5 million, and the management realized that further growth would be difficult without additional working capital. To be less debt-dependent, the management decided to go public. However, before issuing the initial public offering (IPO), Machine Tooling seeks $500,000 for expansion purposes. Such expansion will improve the company’s sales ability and positively affect its IPO prospects.
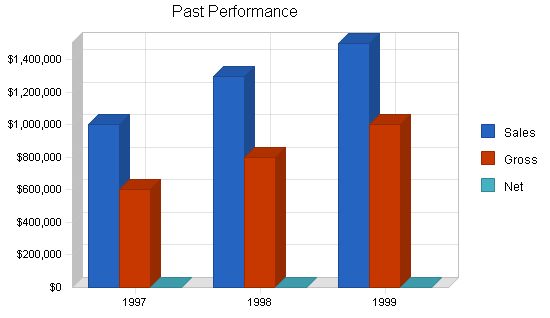
Past Performance:
1997 1998 1999
Sales $1,000,000 $1,300,000 $1,500,000
Gross Margin $600,000 $800,000 $1,000,000
Gross Margin % 60.00% 61.54% 66.67%
Operating Expenses $400,000 $550,000 $700,000
Collection Period 19 22 34
Inventory Turnover 3.00 3.00 3.00
Balance Sheet:
1997 1998 1999
Current Assets:
Cash $20,000 $40,000 $60,000
Accounts Receivable $40,000 $80,000 $130,000
Inventory $30,000 $60,000 $90,000
Other Current Assets $5,000 $10,000 $15,000
Total Current Assets $95,000 $190,000 $295,000
Long-term Assets:
Long-term Assets $100,000 $100,000 $100,000
Accumulated Depreciation $10,000 $20,000 $30,000
Total Long-term Assets $90,000 $80,000 $70,000
Total Assets $185,000 $270,000 $365,000
Current Liabilities:
Accounts Payable $25,000 $50,000 $75,000
Current Borrowing $15,000 $35,000 $50,000
Other Current Liabilities (interest free) $5,000 $5,000 $10,000
Total Current Liabilities $45,000 $90,000 $135,000
Long-term Liabilities:
$50,000 $50,000 $50,000
Total Liabilities $95,000 $140,000 $185,000
Paid-in Capital $50,000 $50,000 $50,000
Retained Earnings $40,000 $80,000 $130,000
Earnings $0 $0 $0
Total Capital $90,000 $130,000 $180,000
Total Capital and Liabilities $185,000 $270,000 $365,000
Other Inputs:
Payment Days 30 30 30
Sales on Credit $750,000 $1,000,000 $1,125,000
Receivables Turnover 18.75 12.50 8.65
Products:
Background on Products and Technology
Machine Tooling plans to assemble the first level of the armature assembly. Laminates will be assembled to rotors and shipped daily to supplement customer production. This will take place in the second quarter of 2000. An elite team of professionals experienced in this industry and this type of product has been put together for this project.
The Machine Tooling Engineering group will continue to support internal and external automation, contributing to production sales and value engineering. They will co-engineer the next generation of food processing equipment and pursue the building and assembly of the food processing machinery product line that the company currently manufactures components for, including rotor shafts, specialized manufacturing service, food processing equipment, engineering service, and assembly machinery.
Market Analysis Summary:
Overview U.S. machine tool industry (Provided by Standard & Poor’s)
The U.S. machine tool industry is relatively stable, with approximately 600 industry establishments concentrated in Ohio, Michigan, and Illinois. Consolidation and foreign investment have changed the industry since the 1990s. The automotive industry’s ongoing investment programs, globalization, and demand for specialized machine tools have contributed to the industry’s stability. U.S. machine tool companies are expanding their worldwide presence through joint ventures, cooperative agreements, and strategic alliances. The largest industry investments have been made in Mexico, Brazil, India, and China.
Market Segmentation:
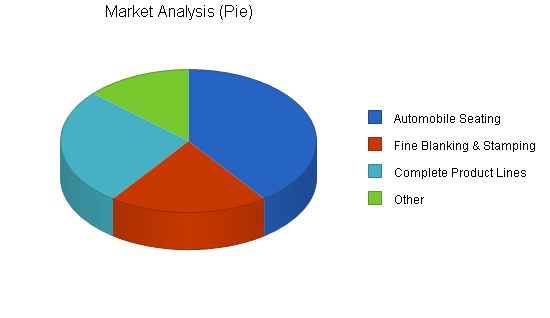
The company’s target customers include automobile seating manufacturers, fine blanking and stamping manufacturers, and manufacturers of complete product lines. These customers require customized machine tools, specialized manufacturing services, and value-adding assembly.
The table and chart below outline the total market potential and estimated growth rates for Machine Tooling’s products.
Market Analysis
| Market Analysis | |||||||
| 2000 | 2001 | 2002 | 2003 | 2004 | |||
| Potential Customers | Growth | CAGR | |||||
| Automobile Seating | 2% | 300 | 306 | 312 | 318 | 324 | 1.94% |
| Fine Blanking & Stamping | 1% | 150 | 152 | 154 | 156 | 158 | 1.31% |
| Complete Product Lines | 1% | 200 | 202 | 204 | 206 | 208 | 0.99% |
| Other | 0% | 100 | 100 | 100 | 100 | 100 | 0.00% |
| Total | 1.31% | 750 | 760 | 770 | 780 | 790 | 1.31% |
The market strategy is to capitalize on our expertise by acquiring strategic companies within the industry. We plan to leverage our capacities to acquire companies that complement our manufacturing operations. Our goal in the next year is to secure more contract manufacturing positions and, in the next five years, to continue our "value-added" scheme and acquire key industry players.
Our products and services offer advantages such as on-time delivery, high quality, and competitive pricing. We have several competitive advantages, including engineering and technical support, automated system design and build, and quality systems. Our marketing strategy will focus on promoting sales of our product lines, systems, presses, automation projects, and machining capacity. We will utilize internal and external sales tactics, including a direct sales force, relationship selling, and subcontractors.
The pricing for our machined components is developed through thorough time study analysis. Our sales plan involves seeking businesses that will help us vertically integrate and become a stronger force in the manufacturing industry.
Our sales forecast shows a gradual increase in the share of high-value assembly services in our sales mix over the next two years.
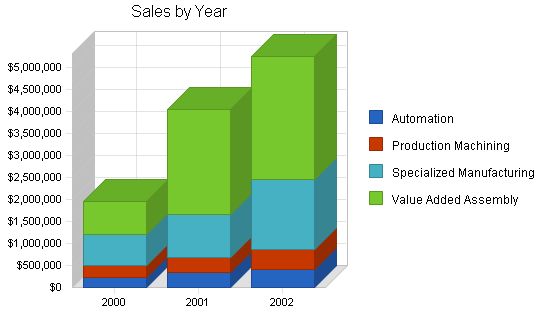
The Sales Forecast for the years 2000, 2001, and 2002 is as follows:
Automation: $220,000, $330,000, $420,000
Production Machining: $270,000, $360,000, $440,000
Specialized Manufacturing: $710,000, $970,000, $1,600,000
Value Added Assembly: $760,000, $2,400,000, $2,800,000
Total Sales: $1,960,000, $4,060,000, $5,260,000
The Direct Cost of Sales for the same years is as follows:
Automation: $45,200, $67,000, $85,000
Production Machining: $54,700, $73,000, $89,000
Specialized Manufacturing: $144,400, $197,000, $325,000
Value Added Assembly: $155,700, $490,000, $570,000
Subtotal Direct Cost of Sales: $400,000, $827,000, $1,069,000
Management Summary:
The company’s management philosophy is based on responsibility and mutual respect. Machine Tooling will maintain an environment and structure that encourages productivity and respect for customers and employees.
Machine Tooling’s management team includes Mr. Peter Newton CEO, Mr. John Abbot, president, and Mr. Chris Manuel, vice president of Marketing. The company strives to maintain lean overhead. Besides the senior management team and an administrative assistant, Machine Tooling currently employs a production manager who oversees all production facilities and a staff of ten.
To accommodate the growing sales projections, an additional five production workers will be hired in 2001.
Personnel Plan:
The following is the personnel plan for the years 2000, 2001, and 2002:
Peter Newton, CEO: $75,000, $80,000, $90,000
John Abbot, President: $75,000, $80,000, $90,000
Chris Manuel, VP Marketing: $60,000, $65,000, $75,000
Production Manager: $45,000, $50,000, $55,000
Administrative Assistant: $30,000, $35,000, $40,000
Total People: 15, 20, 20
Total Payroll: $285,000, $310,000, $350,000
The company is seeking $500,000 for expansion purposes. The use of funds will be broken down as follows:
Marketing of new product lines: $30,000
Growth into new markets: $50,000
Purchasing additional equipment: $270,000
Working Capital: $100,000
Other (Debt Management): $50,000
Important Assumptions:
The following assumptions are important for this plan for the years 2000, 2001, and 2002:
Plan Month: 1, 2, 3
Current Interest Rate: 10.00%
Long-term Interest Rate: 10.00%
Tax Rate: 25.42%, 25.00%, 25.42%
Other: 0, 0, 0
Break-even Analysis:
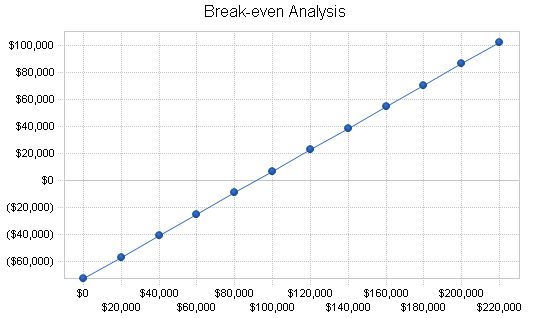
Machine Tooling is operating well above the break-even point.
Break-even Analysis
Monthly Revenue Break-even: $90,953
Assumptions:
– Average Percent Variable Cost: 20%
– Estimated Monthly Fixed Cost: $72,391
Projected Profit and Loss
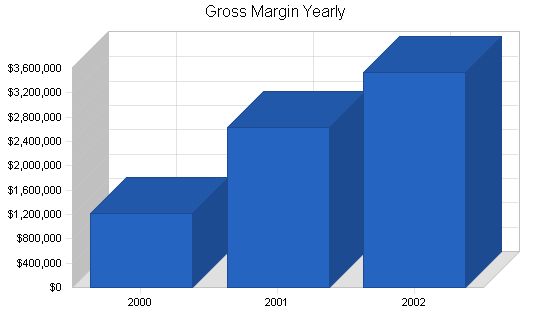
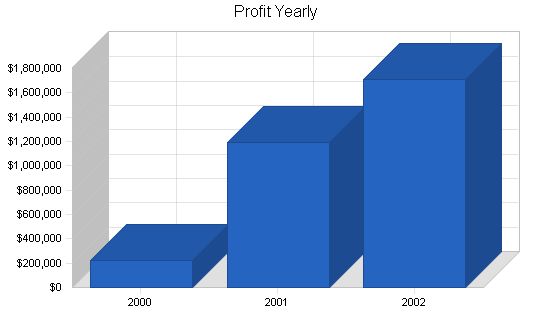
The table below shows Machine Tooling’s projected income statements for 2000-2002.
Pro Forma Profit and Loss:
| Profit and Loss | |||
| Year | 2000 | 2001 | 2002 |
| Sales | $1,960,000 | $4,060,000 | $5,260,000 |
| Direct Cost of Sales | $400,000 | $827,000 | $1,069,000 |
| Production Personnel | $350,040 | $600,000 | $650,000 |
| Total Cost of Sales | $750,040 | $1,427,000 | $1,719,000 |
| Gross Margin | $1,209,960 | $2,633,000 | $3,541,000 |
| Gross Margin % | 61.73% | 64.85% | 67.32% |
| Expenses | |||
| Payroll | $285,000 | $310,000 | $350,000 |
| Marketing/Promotion | $167,900 | $220,000 | $265,000 |
| Depreciation | $9,996 | $30,000 | $40,000 |
| Quality Assurance | $93,800 | $104,000 | $125,000 |
| General & Administrative | $96,000 | $124,000 | $174,000 |
| Manufacturing & Engineering | $129,600 | $130,000 | $175,000 |
| Machining & Systems Building | $86,400 | $100,000 | $110,000 |
| Payroll Taxes | $0 | $0 | $0 |
| Other | $0 | $0 | $0 |
| Total Operating Expenses | $868,696 | $1,018,000 | $1,239,000 |
| Profit Before Interest and Taxes | $341,264 | $1,615,000 | $2,302,000 |
| EBITDA | $351,260 | $1,645,000 | $2,342,000 |
| Interest Expense | $47,705 | $29,150 | $12,470 |
| Taxes Incurred | $74,621 | $396,463 | $581,922 |
| Net Profit | $218,938 | $1,189,388 | $1,707,608 |
| Net Profit/Sales | 11.17% | 29.30% | 32.46% |
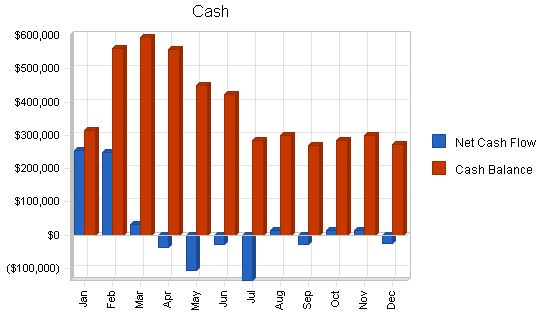
7.4 Projected Cash Flow:
The company’s projected cash flow statements are presented below.
The existing short-term liabilities ($50,000 in total) are paid out in ten monthly payments of $5,000 each starting in March, 2000.
Pro Forma Cash Flow
Cash Received
Cash from Operations
Cash Sales $490,000 $1,015,000 $1,315,000
Cash from Receivables $1,352,925 $2,780,277 $3,793,730
Subtotal Cash from Operations $1,842,925 $3,795,277 $5,108,730
Additional Cash Received
Sales Tax, VAT, HST/GST Received $0 $0 $0
New Current Borrowing $0 $0 $0
New Other Liabilities (interest-free) $0 $0 $0
New Long-term Liabilities $500,000 $0 $0
Sales of Other Current Assets $0 $0 $0
Sales of Long-term Assets $0 $0 $0
New Investment Received $0 $0 $0
Subtotal Cash Received $2,342,925 $3,795,277 $5,108,730
Expenditures
Expenditures from Operations
Cash Spending $285,000 $310,000 $350,000
Bill Payments $1,350,401 $2,477,107 $3,134,443
Subtotal Spent on Operations $1,635,401 $2,787,107 $3,484,443
Additional Cash Spent
Sales Tax, VAT, HST/GST Paid Out $0 $0 $0
Principal Repayment of Current Borrowing $50,000
Other Liabilities Principal Repayment $0 $0 $0
Long-term Liabilities Principal Repayment $175,100 $166,800 $166,800
Purchase Other Current Assets $0 $0 $0
Purchase Long-term Assets $270,000 $200,000 $300,000
Dividends $0 $0 $0
Subtotal Cash Spent $2,130,501 $3,153,907 $3,951,243
Net Cash Flow $212,424 $641,370 $1,157,487
Cash Balance $272,424 $913,793 $2,071,280
7.5 Balance Sheet
The company’s projected balance sheets for 2000-2002 are presented below.
Pro Forma Balance Sheet
Assets
Current Assets
Cash $272,424 $913,793 $2,071,280
Accounts Receivable $247,075 $511,798 $663,069
Inventory $37,290 $77,097 $99,658
Other Current Assets $15,000 $15,000 $15,000
Total Current Assets $571,789 $1,517,689 $2,849,006
Long-term Assets
Long-term Assets $370,000 $570,000 $870,000
Accumulated Depreciation $39,996 $69,996 $109,996
Total Long-term Assets $330,004 $500,004 $760,004
Total Assets $901,793 $2,017,693 $3,609,010
Liabilities and Capital
Current Liabilities
Accounts Payable $117,955 $211,267 $261,777
Current Borrowing $0 $0 $0
Other Current Liabilities $10,000 $10,000 $10,000
Subtotal Current Liabilities $127,955 $221,267 $271,777
Long-term Liabilities $374,900 $208,100 $41,300
Total Liabilities $502,855 $429,367 $313,077
Paid-in Capital $50,000 $50,000 $50,000
Retained Earnings $130,000 $348,938 $1,538,325
Earnings $218,938 $1,189,388 $1,707,608
Total Capital $398,938 $1,588,325 $3,295,933
Total Liabilities and Capital $901,793 $2,017,693 $3,609,010
7.6 Business Ratios
The following table gives a detailed ratio analysis for Machine Tooling. The last column, Industry Profiles, is derived from the general machine industry, as described by the Standard Industry Classification (SIC) Index code 3569, General Industrial Machinery, NEC.
Ratio Analysis
Sales Growth 30.67% 107.14% 29.56% -0.50%
Percent of Total Assets
Accounts Receivable 27.40% 25.37% 18.37% 24.80%
Inventory 4.14% 3.82% 2.76% 26.10%
Other Current Assets 1.66% 0.74% 0.42% 24.20%
Total Current Assets 63.41% 75.22% 78.94% 75.10%
Long-term Assets 36.59% 24.78% 21.06% 24.90%
Total Assets 100.00% 100.00% 100.00% 100.00%
Current Liabilities 14.19% 10.97% 7.53% 35.70%
Long-term Liabilities 41.57% 10.31% 1.14% 18.50%
Total Liabilities 55.76% 21.28% 8.67% 54.20%
Net Worth 44.24% 78.72% 91.33% 45.80%
Percent of Sales
Sales 100.00% 100.00% 100.00% 100.00%
Gross Margin 61.73% 64.85% 67.32% 35.80%
Selling, General & Administrative Expenses 72.00% 52.86% 49.17% 20.80%
Advertising Expenses 2.27% 1.60% 1.33% 0.70%
Profit Before Interest and Taxes 17.41% 39.78% 43.76% 4.00%
Main Ratios
Current 4.47 6.86 10.48 2.20
Quick 4.18 6.51 10.12 1.15
Total Debt to Total Assets 55.76% 21.28% 8.67% 54.20%
Pre-tax Return on Net Worth 73.59% 99.84% 69.47% 7.30%
Pre-tax Return on Assets 32.55% 78.60% 63.44% 16.00%
Additional Ratios
Net Profit Margin 11.17% 29.30% 32.46% n.a
Return on Equity 54.88% 74.88% 51.81% n.a
Activity Ratios
Accounts Receivable Turnover 5.95 5.95 5.95 n.a
Collection Days 59 45 54 n.a
Inventory Turnover 10.42 14.46 12.10 n.a
Accounts Payable Turnover 11.81 12.17 12.17 n.a
Payment Days 29 23 27 n.a
Total Asset Turnover 2.17 2.01 1.46 n.a
Debt Ratios
Debt to Net Worth 1.26 0.27 0.09 n.a
Current Liab. to Liab. 0.25 0.52 0.87 n.a
Liquidity Ratios
Net Working Capital $443,834 $1,296,421 $2,577,229 n.a
Interest Coverage 7.15 55.40 184.60 n.a
Additional Ratios
Assets to Sales 0.46 0.50 0.69 n.a
Current Debt/Total Assets 14% 11% 8% n.a
Acid Test 2.25 4.20 7.68 n.a
Sales/Net Worth 4.91 2.56 1.60 n.a
Dividend Payout 0.00 0.00 0.00 n.a
Appendix
Sales Forecast
Sales
Automation $18,000 $18,000 $18,000 $18,000 $18,000 $18,000 $18,000 $18,000 $19,000 $19,000 $19,000 $19,000
Production Machining $22,000 $22,000 $22,000 $22,000 $22,000 $22,000 $22,000 $22,000 $22,000 $22,000 $23,000 $24,000 $25,000
Specialized Manufacturing $59,000 $59,000 $59,000 $59,000 $59,000 $59,000 $59,000 $59,000 $59,000 $59,000 $59,000 $60,000 $60,000
Value Added Assembly $63,000 $63,000 $63,000 $63,000 $63,000 $63,000 $63,000 $63,000 $63,000 $64,000 $64,000 $64,000 $64,000
Total Sales $162,000 $162,000 $162,000 $162,000 $162,000 $162,000 $162,000 $162,000 $164,000 $165,000 $167,000 $168,000
Direct Cost of Sales
Automation $3,700 $3,700 $3,700 $3,700 $3,700 $3,700 $3,700 $3,700 $3,900 $3,900 $3,900 $3,900
Production Machining $4,500 $4,500 $4,500 $4,500 $4,500 $4,500 $4,500 $4,500 $4,500 $4,700 $4,700 $4,800
Specialized Manufacturing $12,000 $12,000 $12,000 $12,000 $12,000 $12,000 $12,000 $12,000 $12,000 $12,000 $12,200 $12,200
Value Added Assembly $12,900 $12,900 $12,900 $13,000 $13,000 $13,000 $13,000 $13,000 $13,000 $13,000 $13,000 $13,000
Subtotal Direct Cost of Sales $33,100 $33,100 $33,100 $33,200 $33,200 $33,200 $33,200 $33,200 $33,400 $33,600 $33,800 $33,900
Personnel Plan:
Peter Newton, CEO: $6,250
John Abbot, President: $6,250
Chris Manuel, VP Marketing: $5,000
Production Manager: $3,750
Administrative Assistant: $2,500
Total People: 15
Total Payroll: $23,750
General Assumptions:
Plan Month: 1, 2, 3, 4, 5, 6, 7, 8, 9, 10, 11, 12
Current Interest Rate: 10.00%
Long-term Interest Rate: 10.00%
Tax Rate: 30.00%
Other: 0
Pro Forma Profit and Loss:
Sales: $162,000, $162,000, $162,000, $162,000, $162,000, $162,000, $162,000, $162,000, $164,000, $165,000, $167,000, $168,000
Direct Cost of Sales: $33,100, $33,100, $33,100, $33,200, $33,200, $33,200, $33,200, $33,200, $33,400, $33,600, $33,800, $33,900
Production Personnel: $29,170, $29,170, $29,170, $29,170, $29,170, $29,170, $29,170, $29,170, $29,170, $29,170, $29,170, $29,170
Total Cost of Sales: $62,270, $62,270, $62,270, $62,370, $62,370, $62,370, $62,370, $62,370, $62,570, $62,770, $62,970, $63,070
Gross Margin: $99,730, $99,730, $99,730, $99,630, $99,630, $99,630, $99,630, $99,630, $101,430, $102,230, $104,030, $104,930
Gross Margin %: 61.56%, 61.56%, 61.56%, 61.50%, 61.50%, 61.50%, 61.50%, 61.50%, 61.85%, 61.96%, 62.29%, 62.46%
Expenses:
Payroll: $23,750, $23,750, $23,750, $23,750, $23,750, $23,750, $23,750, $23,750, $23,750, $23,750, $23,750, $23,750
Marketing/Promotion: $13,900, $13,900, $14,000, $13,900, $13,900, $14,000, $13,900, $13,900, $14,050, $14,000, $14,100, $14,350
Depreciation: $833, $833, $833, $833, $833, $833, $833, $833, $833, $833, $833, $833
Quality Assurance: $7,700, $7,700, $7,700, $7,700, $7,700, $7,700, $7,700, $7,700, $7,900, $8,000, $8,100, $8,200
General & Administrative: $8,000, $8,000, $8,000, $8,000, $8,000, $8,000, $8,000, $8,000, $8,000, $8,000, $8,000, $8,000
Manufacturing & Engineering: $10,800, $10,800, $10,800, $10,800, $10,800, $10,800, $10,800, $10,800, $10,800, $10,800, $10,800, $10,800
Machining & Systems Building: $7,200, $7,200, $7,200, $7,200, $7,200, $7,200, $7,200, $7,200, $7,200, $7,200, $7,200, $7,200
Payroll Taxes: 15%, $0, $0, $0, $0, $0, $0, $0, $0, $0, $0, $0, $0
Other: $0, $0, $0, $0, $0, $0, $0, $0, $0, $0, $0, $0, $0
Total Operating Expenses: $72,183, $72,183, $72,283, $72,183, $72,183, $72,283, $72,183, $72,183, $72,533, $72,583, $72,783, $73,133
Profit Before Interest and Taxes: $27,547, $27,547, $27,447, $27,447, $27,447, $27,347, $27,447, $27,447, $28,897, $29,647, $31,247, $31,797
EBITDA: $28,380, $28,380, $28,280, $28,280, $28,280, $28,180, $28,280, $28,280, $29,730, $30,480, $32,080, $32,630
Interest Expense: $2,917, $5,000, $4,958, $4,500, $4,458, $4,069, $4,028, $3,986, $3,597, $3,555, $3,513, $3,124
Taxes Incurred: $7,389, $5,637, $5,622, $5,737, $5,747, $5,819, $5,855, $5,865, $6,325, $6,523, $6,933, $7,168
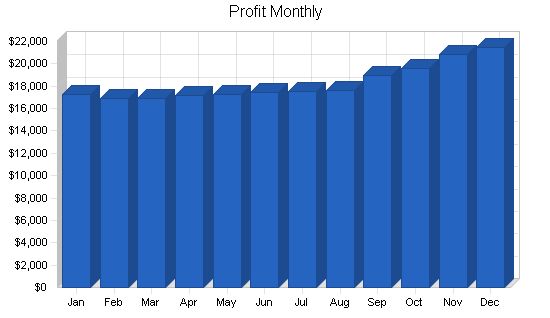
Net Profit: $17,241, $16,910, $16,867, $17,210, $17,242, $17,458, $17,565, $17,596, $18,975, $19,569, $20,800, $21,505
Net Profit/Sales: 10.64%, 10.44%, 10.41%, 10.62%, 10.64%, 10.78%, 10.84%, 10.86%, 11.57%, 11.86%, 12.46%, 12.80%
Pro Forma Cash Flow
| Pro Forma Cash Flow | |||||||||||||
| Jan | Feb | Mar | Apr | May | Jun | Jul | Aug | Sep | Oct | Nov | Dec | ||
| Cash Received | |||||||||||||
| Cash Sales | $40,500 | $40,500 | $40,500 | $40,500 | $40,500 | $40,500 | $40,500 | $40,500 | $41,000 | $41,250 | $41,750 | $42,000 | |
| Cash from Receivables | $65,000 | $69,050 | $121,500 | $121,500 | $121,500 | $121,500 | $121,500 | $121,500 | $121,500 | $121,550 | $123,025 | $123,800 | |
| Subtotal Cash from Operations | $105,500 | $109,550 | $162,000 | $162,000 | $162,000 | $162,000 | $162,000 | $162,000 | $162,500 | $162,800 | $164,775 | $165,800 | |
| Additional Cash Received | |||||||||||||
| Sales Tax, VAT, HST/GST Received | $0.00% | $0 | $0 | $0 | $0 | $0 | $0 | $0 | $0 | $0 | $0 | $0 | $0 |
| New Current Borrowing | $0 | $0 | $0 | $0 | $0 | $0 | $0 | $0 | $0 | $0 | $0 | $0 | |
| New Other Liabilities (interest-free) | $0 | $0 | $0 | $0 | $0 | $0 | $0 | $0 | $0 | $0 | $0 | $0 | |
| New Long-term Liabilities | $250,000 | $250,000 | $0 | $0 | $0 | $0 | $0 | $0 | $0 | $0 | $0 | $0 | |
| Sales of Other Current Assets | $0 | $0 | $0 | $0 | $0 | $0 | $0 | $0 | $0 | $0 | $0 | $0 | |
| Sales of Long-term Assets | $0 | $0 | $0 | $0 | $0 | $0 | $0 | $0 | $0 | $0 | $0 | $0 | |
| New Investment Received | $0 | $0 | $0 | $0 | $0 | $0 | $0 | $0 | $0 | $0 | $0 | $0 | |
| Subtotal Cash Received | $355,500 | $359,550 | $162,000 | $162,000 | $162,000 | $162,000 | $162,000 | $162,000 | $162,500 | $162,800 | $164,775 | $165,800 | |
| Expenditures | Jan | Feb | Mar | Apr | May | Jun | Jul | Aug | Sep | Oct | Nov | Dec | |
| Expenditures from Operations | |||||||||||||
| Cash Spending | $23,750 | $23,750 | $23,750 | $23,750 | $23,750 | $23,750 | $23,750 | $23,750 | $23,750 | $23,750 | $23,750 | $23,750 | |
| Bill Payments | $77,903 | $87,507 | $100,701 | $120,543 | $120,312 | $120,168 | $119,955 | $119,851 | $119,849 | $120,675 | $121,094 | $121,843 | |
| Subtotal Spent on Operations | $101,653 | $111,257 | $124,451 | $144,293 | $144,062 | $143,918 | $143,705 | $143,601 | $143,599 | $144,425 | $144,844 | $145,593 | |
| Additional Cash Spent | |||||||||||||
| Sales Tax, VAT, HST/GST Paid Out | $0 | $0 | $0 | $0 | $0 | $0 | $0 | $0 | $0 | $0 | $0 | $0 | |
| Principal Repayment of Current Borrowing | $0 | $0 | $5,000 | $5,000 | $5,000 | $5,000 | $5,000 | $5,000 | $5,000 | $5,000 | $5,000 | $5,000 | |
| Other Liabilities Principal Repayment | $0 | $0 | $0 | $0 | $0 | $0 | $0 | $0 | $0 | $0 | $0 | $0 | |
| Long-term Liabilities Principal Repayment | $0 | $0 | $0 | $50,000 | $0 | $41,700 | $0 | $0 | $41,700 | $0 | $0 | $41,700 | |
| Purchase Other Current Assets | $0 | $0 | $0 | $0 | $0 | $0 | $0 | $0 | $0 | $0 | $0 | $0 | |
| Purchase Long-term Assets | $0 | $0 | $0 | $0 | $120,000 | $0 | $150,000 | $0 | $0 | $0 | $0 | $0 | |
| Dividends | $0 | $0 | $0 | $0 | $0 | $0 | $0 | $0 | $0 | $0 | $0 | $0 | |
| Subtotal Cash Spent | $101,653 | $111,257 | $129,451 | $199,293 | $269,062 | $190,618 | $298,705 | $148,601 | $190,299 | $149,425 | $149,844 | $192,293 | |
| Net Cash Flow | $253,847 | $248,293 | $32,549 | ($37,293) | ($107,062) | ($28,618) | ($136,705) | $13,399 | ($27,799) | $13,375 | $14,931 | ($26,493) | |
| Cash Balance | $313,847 | $562,140 | $594,689 | $557,396 | $450,334 | $421,716 | $285,011 | $298,410 | $270,611 | $283,985 | $298,917 | $272,424 | |
Pro Forma Balance Sheet
| Pro Forma Balance Sheet | |||||||||||||
| Jan | Feb | Mar | Apr | May | Jun | Jul | Aug | Sep | Oct | Nov | Dec | ||
| Assets | Starting Balances | ||||||||||||
| Current Assets | |||||||||||||
Hello!
I’m Andrew Brooks, a seasoned finance consultant from the USA and the mind behind phonenumber247.com.
My career is built on a foundation of helping individuals and businesses thrive financially in an ever-changing economic landscape. At phonenumber247.com, my aim is to demystify the complex world of finance, providing clear, actionable advice that can help you navigate your financial journey with confidence. Whether it’s personal finance management, investment strategies, or understanding the nuances of market dynamics, I’m here to share insights and tools that can propel you towards your financial goals.
Welcome to my digital space, where every piece of advice is a step closer to financial clarity and success!
