Barton Interiors is a proposed venture that will offer interior design services for homes and offices in Boulder, Colorado. They will also provide access to furniture, decorator fabric, and home and office accessories. This venture offers personalized services that are unique from concept to implementation.
Market research indicates a growing need in the area for the interior design consulting services and products Barton Interiors offers. The market strategy will be cost effective to reach the target market. Although Boulder’s population is under 100,000, there are many wealthy households that prioritize the appearance and feel of their spaces.
The approach to promote Barton Interiors will be through establishing relationships with key people in the community and then through referral activities once a significant client base is established. They will focus on developing solid and loyal client relationships, offering design solutions based on the client’s taste, budget, use, and goals for the space. The additional selection, accessibility of product, design services, and value-based pricing will differentiate Barton Interiors from other options in the area.
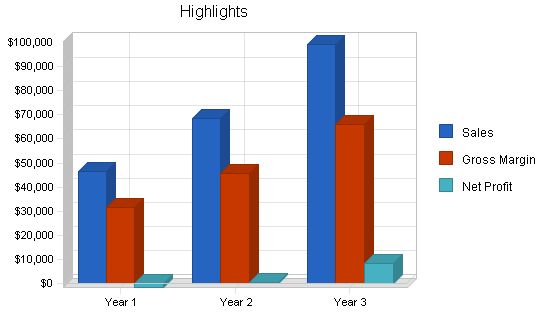
Total revenues in the first year are projected to exceed $46,000 with a loss. The venture will show increasing profits in year two and three, with revenues projected to increase to almost $80,000. This interior design business plan outlines the concept, implementation, and details for the first three years.
Contents
Objectives
- Achieve $3,870 in sales per month in the first year, $5,720 per month in the second year, and $6,600 per month in the third year.
- Generate at least 45% of revenues from product sales rather than consulting billing.
- Create a client base that accounts for 10% of total revenues through commercial revenue.
Mission
Barton Interiors is an interior design service for discerning clients who need assistance in making design choices for their primary residences, vacation homes, and businesses. We provide personal attention throughout the design process and offer design resources and products to our clients through special purchases of furniture, fabric, and accessories. Our goal is to inform, inspire, and help people transform their home or business environment into a unique and personalized expression of themselves, enhancing their enjoyment of the space.
Keys to Success
The primary keys to success for Barton Interiors are:
- Provide the highest quality interior design consulting experience.
- Sell specially selected products to meet clients’ interior design needs.
- Communicate with clients through the website and personalized techniques.
- Retain clients to generate repeat purchases and referrals.
Products and Services
Barton Interiors offers interior design consulting and specially purchased furniture, art pieces, decorator fabric, and accessories for the home and office. The sales process begins with interior design consulting services and progresses to include specially selected components to complement the design theme.
Products available through Barton Interiors include:
- Furniture from Thomasville, Drexel Heritage, and Henredon, as well as local craftsman.
- Decorator fabrics from various brands.
- "Oval Office Iron" drapery hardware purchased through Dept. of the Interior Decorator Fabrics in Eugene, Oregon.
- Accessory and art pieces from wholesale shows.
- Hunter Douglas window treatment products.
- Interior shutters made of wood and "polywood."
- Antiques acquired for specific client needs through a local buyer and other sources.
Product and Service Description
Our primary points of differentiation are:
- A unique client experience provided by a trained and professional interior designer.
- Access to a wide and unique selection of new and antique furniture, accessories, and decorator fabrics.
- Personal assistance with hard-covering window treatments, hardware, and home accessories that fit each project’s objectives.
Competitive Comparison
Our competition primarily comes from other interior designers, as well as "do-it-yourself" resource providers, including:
- Bed, Bath and Beyond
- Discount stores like Target, Wal-Mart, and Home Depot
- Norwalk
- Catalog sales from companies like Pottery Barn, Calico Corners, Ballard Design, and Eddie Bauer
- Pier 1 and local competitors
- Online furniture and fabric retailers
Sales Literature
We will provide a simple and professional brochure for referral sources, seminars, and direct mail purposes.
Company Summary
Barton Interiors is a start-up business that offers comprehensive interior design services for home and office. We assist clients in developing a basic design concept or taking their project from concept to complete implementation. Our clients have the option to purchase new and antique furniture, artwork, decorator fabric, and home accessories. Our website, www.bartoninteriors.com, serves as a platform to communicate our services and showcase our portfolio. The business will begin as a home-based operation for at least the first three years.
Company Ownership
Barton Interiors, located in Boulder, Colorado, is a sole proprietorship owned and operated by Jill Barton, dba Barton Interiors.
Company Locations and Facilities
Barton Interiors operates from a home office in Boulder, Colorado. We have a dedicated room for work, client meetings, and displaying design concepts, products, and past work.
Market Analysis Summary
Barton Interiors targets clients who need interior design services for both residences and offices. Effective marketing and a well-crafted product offering are crucial to our success. Through our market research, we understand our target clients’ specific needs and characteristics, allowing us to better serve them and communicate with them.
Market Segmentation
The Barton Interior client profile consists of geographic, demographic, psychographic, and behavior factors:
Geographics
- The market is the affluent sector within the Boulder, Colorado area with a population of 94,673 (Based on the 2000 Census data).
- A 20-mile area is in need of the products and services offered and do not intend to pursue the Denver market at this time.
- The total target market population is estimated at 24,000 based on the following demographics.
Demographics
- Female, married, and have attended college.
- Have children, but not necessarily at home.
- Combined household annual income greater than $100,000.
- Age range of 35 to 55 years, with a median age of 42.
- Owns their home, townhouse, and/or condominium valued at over $425,000.
- They and/or their spouse work in a professional setting and may have interior design requirements for their office space as well as their homes.
- Belong to one or more business, service, and/or athletic organizations including:
- Boulder Country Club.
- Junior League of Boulder.
- American Business Women’s Association.
- American Auxiliary of University Women.
- Doctor’s Wives Auxiliary.
The following is known regarding the profile of the typical resident of Boulder:
- 67% have lived in the area for seven years or more.
- 23% are between ages 35 and 44.
- 40% have completed some college.
- 24% are managers, professionals, and/or business owners.
- 53% are married.
- 65% have no children living at home.
- 56% own their residence.
Psychographics
- The appearance of her home is a priority.
- Entertaining and showing her home is important.
- She perceives herself as creative, tasteful, and able but seeks validation and support regarding her decorating ideas and choices.
- She reads one or more of the following magazines:
- Martha Stewart Living.
- Country Living.
- Home.
- House Beautiful.
- Country Home.
- Metropolitan Home.
- Traditional Homes.
- Victoria.
- Elle Decor.
Behaviors
- She takes pride in having an active role in decorating their home.
- Her home is a form of communicating “who she is” to others.
- Comparison positioning and stature within social groups are made on an ongoing basis but rarely discussed.
Barton Interiors provides clients the opportunity to create a home environment that expresses who they are. They seek design assistance and have the resources to accomplish their goals. They desire their home to be personal, unique, and tasteful as it communicates a message about what is important to them. Barton Interiors will seek to fulfill the following benefits that are important to our clients.
| Market Analysis | |||||||
| Year 1 | Year 2 | Year 3 | Year 4 | Year 5 | |||
| Potential Customers | Growth | CAGR | |||||
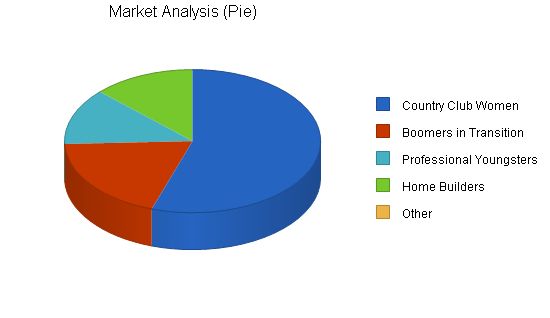
| Country Club Women | 12% | 34,400 | 38,528 | 43,151 | 48,329 | 54,128 | 12.00% |
| Boomers in Transition | 9% | 12,000 | 13,080 | 14,257 | 15,540 | 16,939 | 9.00% |
| Professional Youngsters | 8% | 8,000 | 8,640 | 9,331 | 10,077 | 10,883 | 8.00% |
| Home Builders | 5% | 8,000 | 8,400 | 8,820 | 9,261 | 9,724 | 5.00% |
| Other | 0% | 0 | 0 | 0 | 0 | 0 | 0.00% |
| Total | 10.09% | 62,400 | 68,648 | 75,559 | 83,207 | 91,674 | 10.09% |
Target Market Segment Strategy
Our marketing strategy will create awareness, interest, and appeal from our target market for what Barton Interiors offers its clients. The target markets are separated into four segments: “Country Club Women,” “Boomers in Transition,” “Professional Youngsters,” and “Home Builders.” The primary marketing opportunity is selling to these well-defined and accessible target market segments that focus on investing discretionary income in these areas:
Country Club Women – The most dominant segment is comprised of women aged 35 to 50. They are married, have a household income greater than $100,000, own at least one home or condominium, and are socially active. They are members of various organizations. This group represents the largest collection of “Martha Stewart Wanna Be’s.”
Boomers in Transition – This group, aged 50 to 65, is going through a positive and planned life transition. They are changing homes or remodeling due to various reasons. This segment is attractive due to their high level of discretionary income.
Professional Youngsters – Couples between the ages of 25 and 35 establishing their first “adult” household fall into this group. They both work, earn in excess of $80,000 annually, and now want to invest in their home.
Home Builders – People in the home building process, typically ranging in age from 40 to 55, are prime candidates for Barton Interiors. This applies to both primary residences and secondary homes.
Market Trends
The home textile market, which includes sheets, towels, draperies, carpets, blankets, and upholstery, accounts for 37% of all textile output. The U.S. home textiles market is estimated to be between $6.5 billion to $7 billion annually. The industry is expected to realize a steady increase in the next few years.
The industry is driven by the number of “household formations," which is expected to continue through the early years of the new millennium. This is primarily due to the growth in single-parent and non-family households. Baby boomers needing bigger houses and choosing to buy rather than rent also contribute to industry growth.
The “do-it-yourself” (DIY) market continues to grow. A portion of the DIY market is the “buy-it-yourself” (BIY) market. Consumers are buying products and arranging for someone else to do the fabrication and/or installation. This provides similar feelings of creativity, pride, and individuality associated with direct creative involvement.
Several trends and issues impact the success and challenges of Barton Interiors:
– National economic health: The industry performs better during “good times.”
– New home construction activity: Has a significant impact on sales across all product lines.
– Shifts in design trends: Major changes in design trends increase sales.
Market Growth
The number of U.S. households is projected to grow by 16% to 115 million by 2010. The 35 to 65 age range represents a growth segment with larger incomes than other family structures. These households will either build new homes or update existing ones. The majority of homeowners spend a large percentage of their disposable income on home goods within two years after buying a new house. Positive trends in new housing activity represent growth and opportunity for home textiles.
Barton Interiors offers clients the opportunity to express their unique style and create a personalized home environment. Our clients actively participate in designing their home and want their space to reflect their personality and values. We aim to fulfill the following client benefits:
1. Potential Competitors: There are many interior designers in the Boulder area, ranging from those who offer simple-focused services to full-service interior design, similar to Barton Interiors.
2. Power of Suppliers: Any business with a license can access wholesale furniture, fabrics, and accessories.
3. Power of Buyers: Buyers have low power as they work within the terms and conditions set by suppliers.
4. Substitute Products: Many individuals refer to themselves as interior designers, regardless of training or certification. Window treatment options, such as blinds and shutters, are also widely available and affordable. However, substitutes are less prevalent for antiques and art pieces.
5. Rivalry: The industry experiences moderate competition due to territorial structure and low exit barriers. Entry and exit are relatively easy.
The interior design industry is cautiously optimistic about future growth and expansion. With the slowdown in the economy, clients are carefully deciding what to do and buy.
Our primary method of distribution is direct sales to individual clients.
Competition in the area is strong, ranging from home-based designers to certified designers with relationships with architects. Clients base their provider decisions on referrals and relationships, personality, past work, and certification.
There are several local competitors in the Boulder area, including interior designers, fabric retail stores, catalog providers, and discounters. Our competitive advantage lies in offering unique, sought-after products and exceptional client service.
We will implement three strategies in the upcoming year:
1. Generating Referrals: We will leverage existing contacts and build a referral network through professional associations. Press releases and seminars will also be used to increase awareness.
2. Product Sales: We will promote our products through demonstrations and cross-selling activities. We will showcase our art and antiques through online portfolios.
3. Web Presence: We will improve our website to better communicate our services and products. Monthly assessments will help evaluate performance and client inquiries.
Our value proposition is to offer the highest quality interior design experience with unique products and excellent client service.
Our marketing strategy will focus on establishing Barton Interiors as the top resource for interior design in the Boulder area. We will leverage existing client base, cross-sell products, and target new home constructions.
Product pricing is based on high value and convenience for our clients.
Promotion will include advertisements, co-sponsorship of events, and a quarterly postcard sent to clients. Our website will also drive traffic.
Our primary distribution channel is through retail stores, with the website serving as a secondary channel.
Our marketing programs will focus on generating awareness, leveraging existing clients, cross-selling, and targeting new home constructions.
Our positioning statement is that Barton Interiors is the source for personalized and client-oriented design services, unlike other designers or stores. We encourage clients to participate in the design process and offer great value for their investment.
Sales strategy relies on referrals and keeping in touch with past clients.
The website will be used for information purposes only, showcasing our work and contact information.
A sales forecast has not been provided.
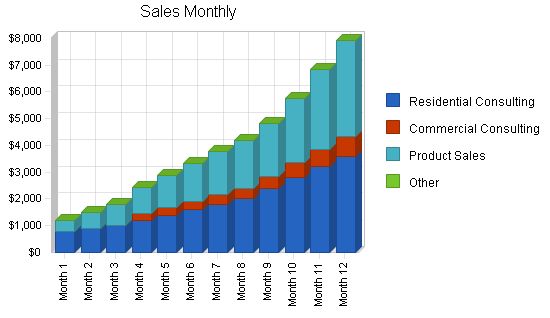
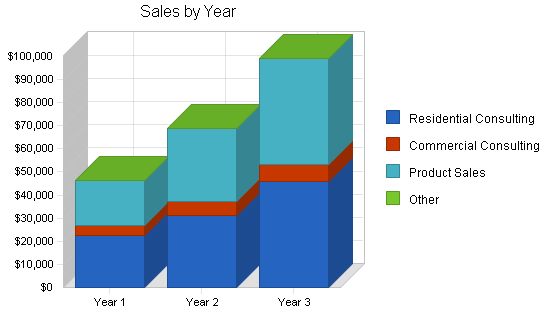
The sales forecast is divided into three revenue streams: residential consulting, commercial consulting, and product sales. The objective is to equalize the two streams by the second year, with product sales taking longer to secure in the first year. The forecast for the next year anticipates a modest 12% growth rate. Economic unpredictability complicates these projections.
Sales Forecast
Residential Consulting:
– Year 1: $22,700
– Year 2: $31,200
– Year 3: $46,000
Commercial Consulting:
– Year 1: $3,960
– Year 2: $6,240
– Year 3: $7,200
Product Sales:
– Year 1: $19,800
– Year 2: $31,200
– Year 3: $46,000
Other:
– Year 1: $0
– Year 2: $0
– Year 3: $0
Total Sales:
– Year 1: $46,460
– Year 2: $68,640
– Year 3: $99,200
Direct Cost of Sales
Residential Consulting:
– Year 1: $3,405
– Year 2: $4,680
– Year 3: $6,900
Commercial Consulting:
– Year 1: $594
– Year 2: $936
– Year 3: $1,080
Product Sales:
– Year 1: $10,890
– Year 2: $17,160
– Year 3: $25,300
Other:
– Year 1: $0
– Year 2: $0
– Year 3: $0
Subtotal Direct Cost of Sales:
– Year 1: $14,889
– Year 2: $22,776
– Year 3: $33,280
Sales Programs
Pricing:
– Residential consulting: $90 per hour
– Commercial consulting: $100 per hour
Distribution:
– All services and products will be distributed directly through personal contact.
Advertising and Promotion:
– The most successful advertising is anticipated to be through the Boulder Herald and through ads on local broadcasts of the “Martha Stewart” and “Interior Motives” television shows.
Client Service:
– Excellent, personalized, fun, one-of-a-kind client service is essential.
Strategic Alliances
Barton Interiors has dynamic alliances with the following:
– Several architect firms including Jill’s existing employer, Gibson & Sawyer, LLC.
– "Providance" retail store, specializing in gallery-type pieces for the home and office.
– "Interior Fabricators" business.
Milestones
Year Buying Program:
– Start Date: 1/2/2002
– End Date: 1/30/2002
– Budget: $560
– Manager: Jill
– Department: Products
Membership Strategy:
– Start Date: 2/2/2002
– End Date: 2/15/2002
– Budget: $225
– Manager: Jill
– Department: Promotions
Seminar Schedule & Prep.:
– Start Date: 3/1/2002
– End Date: 4/1/2002
– Budget: $45
– Manager: Jill
– Department: Marketing
Seminars:
– Start Date: 4/1/2002
– End Date: 5/30/2002
– Budget: $540
– Manager: Jill
– Department: Marketing
Client Review/Analysis:
– Start Date: 6/1/2002
– End Date: 6/15/2002
– Budget: $250
– Manager: Jill
– Department: Marketing
Furniture Market (High Point, N.C.):
– Start Date: 11/10/2002
– End Date: 11/20/2002
– Budget: $1,800
– Manager: Jill
– Department: Products
Year End Evaluation:
– Start Date: 12/20/2002
– End Date: 12/31/2002
– Budget: $250
– Manager: Jill & CPA
– Department: Management
Personnel Plan
Jill Barton:
– Year 1: $19,800
– Year 2: $28,800
– Year 3: $36,000
Other:
– Year 1: $0
– Year 2: $0
– Year 3: $0
Total People:
– Year 1: 0
– Year 2: 0
– Year 3: 0
Total Payroll:
– Year 1: $19,800
– Year 2: $28,800
– Year 3: $36,000
Financial Plan
Initial funding: $25,000 (invested by the owner)
Key factors of the financial plan:
1. Sales growth rate of 47% for 2002 and 15% for 2003.
2. Monthly average sales increase: $3,870 (first year), $5,720 (second year), $6,600 (third year).
3. Funding the business growth from generated revenue.
Potential risks:
– Slow sales resulting in lower cash flow.
– Unexpected and excessive cost increases.
– Overly aggressive actions by competitors.
– Entry of new competitors.
Worst case risks:
– Business inability to support itself.
– Financial, business, and personal devastation of venture failure.
The break-even analysis is expressed as a per-client unit based on average hourly billing, product sales, and transaction costs.
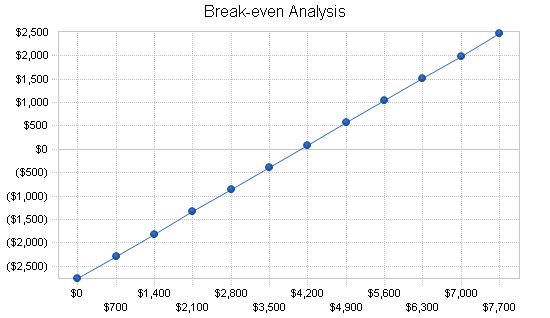
Break-even Analysis
Monthly Revenue Break-even: $4,067
Assumptions:
Average Percent Variable Cost: 32%
Estimated Monthly Fixed Cost: $2,763
Important Assumptions:
The following critical assumptions will determine future success:
– A healthy economy supporting moderate market growth.
– Ability to maintain a gross margin percentage exceeding 65%.
– Keeping operating costs low, especially in product purchases and ongoing monthly expenses.
– Receiving an initial payment for each project of 50% of estimated time and product purchases, with the remaining balance collected within 45 days of project completion.
General Assumptions:
Year 1 Year 2 Year 3
Plan Month: 1 2 3
Current Interest Rate: 9.50% 9.50% 9.50%
Long-term Interest Rate: 8.50% 8.50% 8.50%
Tax Rate: 28.17% 28.00% 28.17%
Other: 0 0 0
Key Financial Indicators:
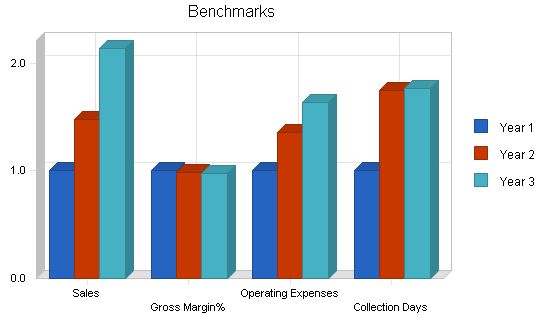
The key financial indicators focus on cash flow. There is minimal inventory, but late payments for completed jobs may be a concern. Timely billing and collection are critical. All expenses are tracked monthly, recorded in the accounting software, and compared to our business plan budget.
The start-up summary provides the initial expenses for Barton Interiors. Most costs are office-related, including equipment, samples, and promotional resources for furniture and home accessories.
Start-up Expenses:
– Legal: $500
– Stationery etc.: $850
– Brochures: $420
– Consultants: $450
– Insurance: $150
– Samples and Reference Books: $3,250
– Research and development: $800
– Expensed equipment: $4,250
– Other: $550
– Total Start-up Expenses: $11,220
Start-up Assets:
– Cash Required: $9,780
– Other Current Assets: $1,000
– Long-term Assets: $3,000
– Total Assets: $13,780
Total Requirements: $25,000
Start-up Funding:
– Start-up Expenses to Fund: $11,220
– Start-up Assets to Fund: $13,780
– Total Funding Required: $25,000
Assets:
– Non-cash Assets from Start-up: $4,000
– Cash Requirements from Start-up: $9,780
– Additional Cash Raised: $0
– Cash Balance on Starting Date: $9,780
– Total Assets: $13,780
Liabilities and Capital:
– Liabilities: $0
– Capital:
– Planned Investment:
– Jill Barton: $25,000
– Investor 2: $0
– Other: $0
– Additional Investment Requirement: $0
– Total Planned Investment: $25,000
– Loss at Start-up (Start-up Expenses): ($11,220)
– Total Capital: $13,780
– Total Capital and Liabilities: $13,780
– Total Funding: $25,000
Projected Profit and Loss:
The following represents the projected profit and loss for Barton Interiors from 2002 to 2004 based on sales and expense projections.
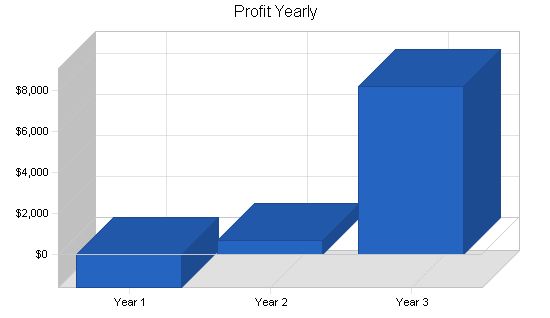
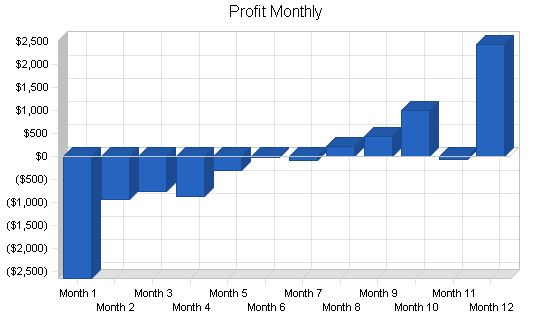
Pro Forma Profit and Loss
| Pro Forma Profit and Loss | |||
| Year 1 | Year 2 | Year 3 | |
| Sales | $46,460 | $68,640 | $99,200 |
| Direct Cost of Sales | $14,889 | $22,776 | $33,280 |
| Other | $0 | $0 | $0 |
| Total Cost of Sales | $14,889 | $22,776 | $33,280 |
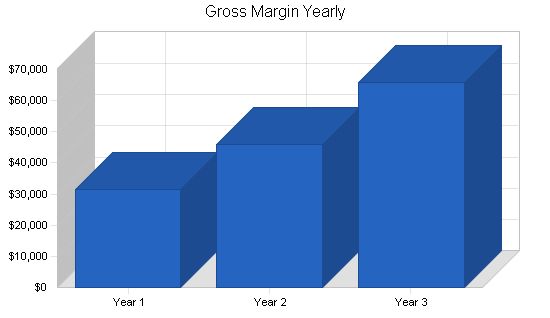
| Gross Margin | $31,571 | $45,864 | $65,920 |
| Gross Margin % | 67.95% | 66.82% | 66.45% |
| Expenses | |||
| Payroll | $19,800 | $28,800 | $36,000 |
| Sales and Marketing and Other Expenses | $11,560 | $13,430 | $15,100 |
| Depreciation | $300 | $750 | $800 |
| Leased Equipment | $0 | $0 | $0 |
| Utilities | $540 | $660 | $800 |
| Insurance | $960 | $1,200 | $1,600 |
| Rent | $0 | $0 | $0 |
| Payroll Taxes | $0 | $0 | $0 |
| Other | $0 | $0 | $0 |
| Total Operating Expenses | $33,160 | $44,840 | $54,300 |
| Profit Before Interest and Taxes | ($1,589) | $1,024 | $11,620 |
| EBITDA | ($1,289) | $1,774 | $12,420 |
| Interest Expense | $0 | $76 | $238 |
| Taxes Incurred | $0 | $265 | $3,206 |
| Net Profit | ($1,589) | $683 | $8,176 |
| Net Profit/Sales | -3.42% | 0.99% | 8.24% |
Projected Cash Flow
The cash flow projections are outlined below. These cash flow projects are based on our assumptions and revenue projections.
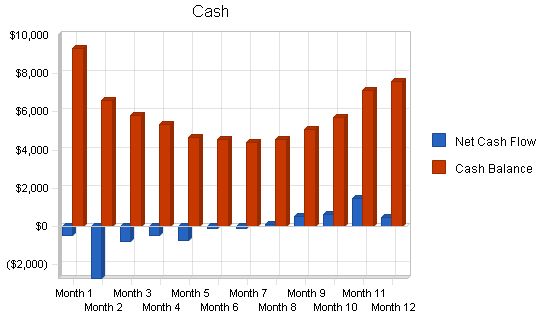
Pro Forma Cash Flow
Sales Tax, VAT, HST/GST Received
New Current Borrowing
New Other Liabilities (interest-free)
New Long-term Liabilities
Sales of Other Current Assets
Sales of Long-term Assets
New Investment Received
Subtotal Cash Received
Expenditures
Expenditures from Operations
Cash Spending
Bill Payments
Subtotal Spent on Operations
Additional Cash Spent
Net Cash Flow
Cash Balance
Projected Balance Sheet
Barton Interiors’ balance sheet is outlined below.
Pro Forma Balance Sheet
Assets
Current Assets
Cash
Accounts Receivable
Other Current Assets
Total Current Assets
Long-term Assets
Long-term Assets
Accumulated Depreciation
Total Long-term Assets
Total Assets
Liabilities and Capital
Current Liabilities
Accounts Payable
Current Borrowing
Other Current Liabilities
Subtotal Current Liabilities
Long-term Liabilities
Total Liabilities
Paid-in Capital
Retained Earnings
Earnings
Total Capital
Total Liabilities and Capital
Net Worth
Sales Growth
Percent of Total Assets
Accounts Receivable
Other Current Assets
Total Current Assets
Long-term Assets
Total Assets
Current Liabilities
Accounts Payable
Current Borrowing
Other Current Liabilities
Subtotal Current Liabilities
Long-term Liabilities
Total Liabilities
Net Worth
Percent of Sales
Sales
Gross Margin
Selling, General & Administrative Expenses
Advertising Expenses
Profit Before Interest and Taxes
Main Ratios
Current
Quick
Total Debt to Total Assets
Pre-tax Return on Net Worth
Pre-tax Return on Assets
Additional Ratios
Net Profit Margin
Return on Equity
Activity Ratios
Accounts Receivable Turnover
Collection Days
Accounts Payable Turnover
Payment Days
Total Asset Turnover
Debt Ratios
Debt to Net Worth
Current Liab. to Liab.
Liquidity Ratios
Net Working Capital
Interest Coverage
Additional Ratios
Assets to Sales
Current Debt/Total Assets
Acid Test
Sales/Net Worth
Dividend Payout
Appendix
Sales Forecast
Direct Cost of Sales
Residential Consulting
Commercial Consulting
Product Sales
Other
Total Sales
Subtotal Direct Cost of Sales
General Assumptions:
Month 1 2 3 4 5 6 7 8 9 10 11 12
Plan Month 1 2 3 4 5 6 7 8 9 10 11 12
Current Interest Rate 9.50% 9.50% 9.50% 9.50% 9.50% 9.50% 9.50% 9.50% 9.50% 9.50% 9.50% 9.50%
Long-term Interest Rate 8.50% 8.50% 8.50% 8.50% 8.50% 8.50% 8.50% 8.50% 8.50% 8.50% 8.50% 8.50%
Tax Rate 30.00% 28.00% 28.00% 28.00% 28.00% 28.00% 28.00% 28.00% 28.00% 28.00% 28.00% 28.00%
Other 0 0 0 0 0 0 0 0 0 0 0 0
Pro Forma Profit and Loss:
Month 1 2 3 4 5 6 7 8 9 10 11 12
Sales $1,200 $1,500 $1,800 $2,440 $2,880 $3,320 $3,760 $4,200 $4,840 $5,760 $6,840 $7,920
Direct Cost of Sales $340 $465 $590 $766 $912 $1,058 $1,204 $1,350 $1,526 $1,824 $2,226 $2,628
Other $0 $0 $0 $0 $0 $0 $0 $0 $0 $0 $0 $0
Total Cost of Sales $340 $465 $590 $766 $912 $1,058 $1,204 $1,350 $1,526 $1,824 $2,226 $2,628
Gross Margin $860 $1,035 $1,210 $1,674 $1,968 $2,262 $2,556 $2,850 $3,314 $3,936 $4,614 $5,292
Gross Margin % 71.67% 69.00% 67.22% 68.61% 68.33% 68.13% 67.98% 67.86% 68.47% 68.33% 67.46% 66.82%
Expenses
Payroll $1,200 $1,200 $1,200 $1,500 $1,500 $1,500 $1,800 $1,800 $1,800 $2,100 $2,100 $2,100
Sales and Marketing and Other Expenses $2,165 $615 $615 $885 $625 $625 $685 $685 $935 $685 $2,425 $615
Depreciation $25 $25 $25 $25 $25 $25 $25 $25 $25 $25 $25 $25
Leased Equipment $0 $0 $0 $0 $0 $0 $0 $0 $0 $0 $0 $0
Utilities $45 $45 $45 $45 $45 $45 $45 $45 $45 $45 $45 $45
Insurance $80 $80 $80 $80 $80 $80 $80 $80 $80 $80 $80 $80
Rent $0 $0 $0 $0 $0 $0 $0 $0 $0 $0 $0 $0
Payroll Taxes 15% $0 $0 $0 $0 $0 $0 $0 $0 $0 $0 $0 $0
Other $0 $0 $0 $0 $0 $0 $0 $0 $0 $0 $0 $0
Total Operating Expenses $3,515 $1,965 $1,965 $2,535 $2,275 $2,275 $2,635 $2,635 $2,885 $2,935 $4,675 $2,865
Profit Before Interest and Taxes ($2,655) ($930) ($755) ($861) ($307) ($13) ($79) $215 $429 $1,001 ($61) $2,427
EBITDA ($2,630) ($905) ($730) ($836) ($282) $12 ($54) $240 $454 $1,026 ($36) $2,452
Interest Expense $0 $0 $
Pro Forma Cash Flow
| Pro Forma Cash Flow | |||||||||||||
| Month 1 | Month 2 | Month 3 | Month 4 | Month 5 | Month 6 | Month 7 | Month 8 | Month 9 | Month 10 | Month 11 | Month 12 | ||
| Cash Received | |||||||||||||
| Cash from Operations | |||||||||||||
| Cash Sales | $840 | $1,050 | $1,260 | $1,708 | $2,016 | $2,324 | $2,632 | $2,940 | $3,388 | $4,032 | $4,788 | $5,544 | |
| Cash from Receivables | $0 | $12 | $363 | $453 | $546 | $736 | $868 | $1,000 | $1,132 | $1,266 | $1,461 | $1,739 | |
| Subtotal Cash from Operations | $840 | $1,062 | $1,623 | $2,161 | $2,562 | $3,060 | $3,500 | $3,940 | $4,520 | $5,298 | $6,249 | $7,283 | |
| Additional Cash Received | |||||||||||||
| Sales Tax, VAT, HST/GST Received | 0.00% | $0 | $0 | $0 | $0 | $0 | $0 | $0 | $0 | $0 | $0 | $0 | $0 |
| New Current Borrowing | $0 | $0 | $0 | $0 | $0 | $0 | $0 | $0 | $0 | $0 | $0 | $0 | $0 |
| New Other Liabilities (interest-free) | $0 | $0 | $0 | $0 | $0 | $0 | $0 | $0 | $0 | $0 | $0 | $0 | $0 |
| New Long-term Liabilities | $0 | $0 | $0 | $0 | $0 | $0 | $0 | $0 | $0 | $0 | $0 | $0 | $0 |
| Sales of Other Current Assets | $0 | $0 | $0 | $210 | $0 | $0 | $0 | $0 | $0 | $0 | $0 | $0 | $0 |
| Sales of Long-term Assets | $0 | $0 | $0 | $0 | $0 | $0 | $0 | $0 | $0 | $0 | $0 | $0 | $0 |
| New Investment Received | $0 | $0 | $0 | $0 | $0 | $0 | $0 | $0 | $0 | $0 | $0 | $0 | $0 |
| Subtotal Cash Received | $840 | $1,062 | $1,623 | $2,371 | $2,562 | $3,060 | $3,500 | $3,940 | $4,520 | $5,298 | $6,249 | $7,283 | |
| Expenditures | |||||||||||||
| Expenditures from Operations | |||||||||||||
| Cash Spending | $1,200 | $1,200 | $1,200 | $1,500 | $1,500 | $1,500 | $1,800 | $1,800 | $1,800 | $2,100 | $2,100 | $2,100 | |
| Bill Payments | $88 | $2,583 | $1,209 | $1,345 | $1,772 | $1,667 | $1,815 | $2,019 | $2,174 | $2,588 | $2,705 | $4,729 | |
| Subtotal Spent on Operations | $1,288 | $3,783 | $2,409 | $2,845 | $3,272 | $3,167 | $3,615 | $3,819 | $3,974 | $4,688 | $4,805 | $6,829 | |
| Additional Cash Spent | |||||||||||||
| Sales Tax, VAT, HST/GST Paid Out | $0 | $0 | $0 | $0 | $0 | $0 | $0 | $0 | $0 | $0 | $0 | $0 | |
| Principal Repayment of Current Borrowing | $0 | $0 | $0 | $0 | $0 | $0 | $0 | $0 | $0 | $0 | $0 | $0 | $0 |
| Other Liabilities Principal Repayment | $0 | $0 | $0 | $0 | $0 | $0 | $0 | $0 | $0 | $0 | $0 | $0 | $0 |
| Long-term Liabilities Principal Repayment | $0 | $0 | $0 | $0 | $0 | $0 | $0 | $0 | $0 | $0 | $0 | $0 | $0 |
| Purchase Other Current Assets | $0 | $0 | $0 | $0 | $0 | $0 | $0 | $0 | $0 | $0 | $0 | $0 | $0 |
| Purchase Long-term Assets | $0 | $0 | $0 | $0 | $0 | $0 | $0 | $0 | $0 | $0 | $0 | $0 | $0 |
| Dividends | $0 | $0 | $0 | $0 | $0 | $0 | $0 | $0 | $0 | $0 | $0 | $0 | $0 |
| Subtotal Cash Spent | $1,288 | $3,783 | $2,409 | $2,845 | $3,272 | $3,167 | $3,615 | $3,819 | $3,974 | $4,688 | $4,805 | $6,829 | |
| Net Cash Flow | ($448) | ($2,721) | ($786) | ($474) | ($710) | ($106) | ($114) | $122 | $546 | $611 | $1,444 | $454 | |
| Cash Balance | $9,332 | $6,612 | $5,826 | $5,352 | $4,642 | $4,536 | $4,421 | $4,543 | $5,089 | $5,700 | $7,143 | $7,597 | |
Pro Forma Balance Sheet
| Pro Forma Balance Sheet | |||||||||||||
| Month 1 | Month 2 | Month 3 | Month 4 | Month 5 | Month 6 | Month 7 | Month 8 | Month 9 | Month 10 | Month 11 | Month 12 | ||
| Assets | |||||||||||||
| Current Assets | |||||||||||||
| Cash | $9,780 | $9,332 | $6,612 | $5,826 | $5,352 | $4,642 | $4,536 | $4,421 | $4,543 | $5,089 | $5,700 | $7,143 | $7,597 |
| Accounts Receivable | $0 | $360 | $798 | $975 | $1,254 | $1,572 | $1,831 | $2,091 | $2,350 | $2,670 | $3,132 | $3,722 | $4,360 |
| Other Current Assets | $1,000 | $1,000 | $1,000 | $1,000 | $790 | $790 | $790 | $790 | $790 | $790 | $790 | $790 | $790 |
| Total Current Assets | $10,780 | $10,692 | $8,410 | $7,801 | $7,396 | $7,004 | $7,157 | $7,302 | $7,683 | $8,549 | $9,621 | $11,656 | $12,747 |
| Long-term Assets | |||||||||||||
| Long-term Assets | $3,000 | $3,000 | $3,000 | $3,000 | $3,000 | $3,000 | $3,000 | $3,000 | $3,000 | $3,000 | $3,000 | $3,000 | $3,000 |
| Accumulated Depreciation | $0 | $25 | $50 | $75 | $100 | $125 | |||||||
| Personnel Plan | |||||||||||||
| Month 1 | Month 2 | Month 3 | Month 4 | Month 5 | Month 6 | Month 7 | Month 8 | Month 9 | Month 10 | Month 11 | Month 12 | ||
| Jill Barton | 0% | $1,200 | $1,200 | $1,200 | $1,500 | $1,500 | $1,500 | $1,800 | $1,800 | $1,800 | $2,100 | $2,100 | $2,100 |
| Other | 0% | $0 | $0 | $0 | $0 | $0 | $0 | $0 | $0 | $0 | $0 | $0 | $0 |
| Total People | 0 | 0 | 0 | 0 | 0 | 0 | 0 | 0 | 0 | 0 | 0 | 0 | |
| Total Payroll | $1,200 | $1,200 | $1,200 | $1,500 | $1,500 | $1,500 | $1,800 | $1,800 | $1,800 | $2,100 | $2,100 | $2,100 | |

Business Plan Outline
- Executive Summary
- Products and Services
- Company Summary
- Market Analysis Summary
- Strategy and Implementation Summary
- Management Summary
- Financial Plan
- Appendix


BUILD A BUSINESS PLAN THAT’LL WOW LENDERS
Join 1 million entrepreneurs who plan, fund, and grow with LivePlan.
No thanks, I’ll pitch investors without business planning software.
Hello!
I’m Andrew Brooks, a seasoned finance consultant from the USA and the mind behind phonenumber247.com.
My career is built on a foundation of helping individuals and businesses thrive financially in an ever-changing economic landscape. At phonenumber247.com, my aim is to demystify the complex world of finance, providing clear, actionable advice that can help you navigate your financial journey with confidence. Whether it’s personal finance management, investment strategies, or understanding the nuances of market dynamics, I’m here to share insights and tools that can propel you towards your financial goals.
Welcome to my digital space, where every piece of advice is a step closer to financial clarity and success!
