Dribbling Indoor Soccer is the only indoor soccer facility in Wingback County, serving a population of 240,000 residents. The facility boasts two professional-style, lighted fields (73′ x 140′) with Field Turf for fast-action soccer in all weather conditions.
Divisions are available for youth, men, women, and coed players of all skill levels, providing a recreational yet competitive environment. League play runs year round, with a $40 annual fee for all participants and a $700 team registration fee per session. Each session includes 10 games and awards for the first place team.
Skills clinics cater to beginner adults and those looking to improve. The fields can also be rented for various events like practices, parties, and tournaments for lacrosse and field hockey. A soccer store on-site offers leading brands for players, teams, leagues, and schools. Additionally, a small café will serve drinks, sandwiches, and pastries.
By the end of the first year, Dribbling Indoor Soccer projects over 1,000 members, 30 adult teams, and 30 youth teams.
Dribbling Indoor Soccer’s Objectives are as follows:
– Build facility membership to over 800.
– Register 30 adult and 25 youth teams within the first year.
– Develop facility potential for special events.
The mission of Dribbling Indoor Soccer is to provide Wingback County residents with a state-of-the-art soccer facility for year-round enjoyment by both youth and adults.
Les Klew has been a fixture in the county’s soccer community for twenty years. He has coached hundreds of children and is currently the supervisor of soccer officials for the Wingback County area. His expertise has greatly contributed to the development of soccer in the county, which has earned him instant credibility with players and coaches.
Noh, Les’s wife, has also been an important figure in boosting soccer in Wingback County, particularly women’s soccer. She has coached numerous girls’ teams and served as the chairperson of the Wingback County Soccer Association.
With their extensive connections, both Les and Noh will actively promote the facility to players and coaches.
Dribbling Indoor Soccer is owned by Lester (Les) and Naomi (Noh) Klew. It will maintain a sole proprietorship status for the first two years, projecting that the Ouisterfield facility will be popular enough to establish a second indoor operation in Midfield. At that time, the business will reorganize as an S Corporation.
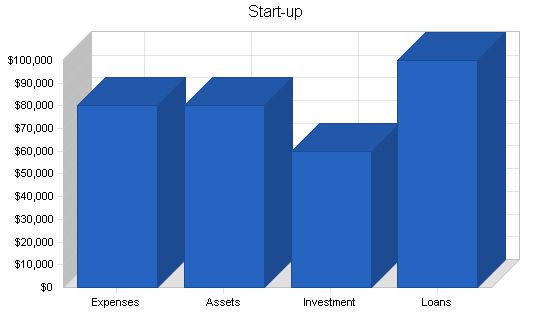
The start-up cost of Dribbling Indoor Soccer primarily focuses on field installation and setting up the soccer store. Les and Noh Klew will invest in the business, and in addition, secure a long-term loan. Specifics of start-up expenses and funding are provided in the tables and chart below.
Start-up Funding
Start-up Expenses to Fund: $80,000
Start-up Assets to Fund: $80,000
Total Funding Required: $160,000
Assets
Non-cash Assets from Start-up: $50,000
Cash Requirements from Start-up: $30,000
Additional Cash Raised: $0
Cash Balance on Starting Date: $30,000
Total Assets: $80,000
Liabilities and Capital
Liabilities
Current Borrowing: $0
Long-term Liabilities: $100,000
Accounts Payable (Outstanding Bills): $0
Other Current Liabilities (interest-free): $0
Total Liabilities: $100,000
Capital
Planned Investment:
Klew, Les and Noh: $60,000
Other: $0
Additional Investment Requirement: $0
Total Planned Investment: $60,000
Loss at Start-up (Start-up Expenses): ($80,000)
Total Capital: ($20,000)
Total Capital and Liabilities: $80,000
Total Funding: $160,000
Start-up
Requirements
Start-up Expenses
Legal: $1,000
Brochures: $1,000
Insurance: $3,000
Rent: $5,000
Soccer Shop Setup: $10,000
Field Installation: $52,000
Cafe: $8,000
Total Start-up Expenses: $80,000
Start-up Assets
Cash Required: $30,000
Start-up Inventory: $5,000
Other Current Assets: $5,000
Long-term Assets: $40,000
Total Assets: $80,000
Total Requirements: $160,000
2.3 Company Locations and Facilities
Dribbling Indoor Soccer is located on West 18th Street in Ouisterfield. The 30,000 square foot facility is a former warehouse that will be converted into a playing facility. The location is easily accessible to all city residents and is nearby Southtowne Park, the largest and most popular city park. This unique location is perfect, and the facility has ample off-street parking.
Products and Services
Dribbling Indoor Soccer is an indoor soccer facility that offers league play, soccer training, and a soccer shop. The facility is also available to be rented out for special events.
The fee schedule is as follows:
– Annual Facility Membership: $40
– Team Registration per Session: $700
– Facility Rental Fee: Member $55 – 65/hr, Non-Member $80/hr
– Skill Clinic Fees: Range from $80 (per week) for children to $400 for groups
The skill clinics are led by soccer skill instructors with “A” Level Coaching Certification and are geared toward novices who want to improve their soccer skills.
The facility also has a soccer shop that sells the best soccer gear, both indoor and outdoor. The shop offers the best selection of turf shoes available in the city.
Market Analysis Summary
Soccer is a popular sport in Wingback County. Currently, there are 6,000 children participating in youth soccer leagues and 3,000 adults participating in the adult league. The number of players is growing dramatically due to two factors.
The first factor is the large number of children in the county under the age of 12. There are approximately 30,000 children in the county under the age of 12, and the percentage of children in this age group is projected to continue growing for the next five years. Soccer is the most popular sport among this age group.
The second factor is the growing number of young people between the ages of 24-35 participating in team sports. Participation in coed softball has increased by 20% each year for the past three years, leading to the county building four new playing fields this year. The adult outdoor soccer league has grown by 50% over the past two years, and there are currently 24 adult league teams participating in the outdoor city soccer league.
4.1 Market Segmentation
Dribbling Indoor Soccer will focus on the following target customers:
– Youths, ages 6-14 years
– Adults, ages 24-35 years
Market Analysis:
Potential Customers Growth Year 1 Year 2 Year 3 Year 4 Year 5 CAGR
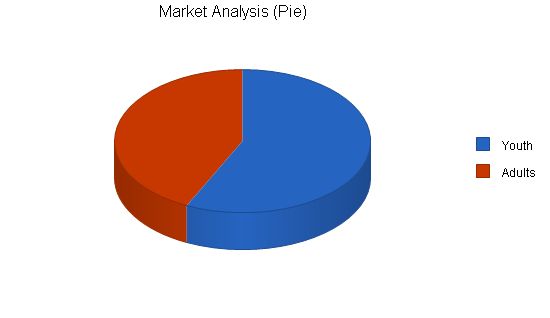
Youth 12% 40,000 44,800 50,176 56,197 62,941 12.00%
Adults 10% 30,000 33,000 36,300 39,930 43,923 10.00%
Total 11.16% 70,000 77,800 86,476 96,127 106,864 11.16%
Strategy and Implementation Summary:
Dribbling Indoor Soccer will aggressively pursue membership and team registration by discounting both the membership fee and the team fee.
– Membership Fee: Dribbling Indoor Soccer will offer a 25% discount on membership fees for the first six months.
– Team Fee: The team fee will be reduced by $100 if the team registers before the early sign-up deadline.
In addition, we will sell the facility rental potential to local schools, churches, and civic organizations.
5.1 Marketing Strategy:
Marketing Programs:
The marketing strategy for Dribbling will differ throughout the year, depending upon demand for the facility. During the winter, when most leagues play indoors, we will have to do very few marketing or advertising campaigns. During the summer, however, we must ensure that the center retains top of mind share with local recreational soccer players and parents seeking activities for their children during school holidays.
Marketing programs during the summer will consist of:
– Discounts: e.g. rent for one hour, get the second hour free.
– Advertise in the sports section of the local paper.
– Post fliers at other sports and recreation facilities.
Pricing:
All league participants must become members of Dribbling Indoor Soccer. The annual fee for individuals is $40. Team registration per season is $700.
Teams can also purchase clinics. A 1/2 day clinic, which can include up to 15 people, will cost $400. Children’s clinics/camps will be priced at $80 for five half-day sessions.
The fields will be available for rent on an hourly basis to members. Rental of a field will cost $55 per hour during the day and $65 per hour during evenings and weekends.
To develop good business strategies, perform a SWOT analysis of your business. It’s easy with our free guide and template. Learn how to perform a SWOT analysis.
5.2 Sales Strategy:
Dribbling Indoor Soccer will sell the indoor facility to the current outdoor soccer teams. We will operate a booth at the city’s soccer fields on weekends for the two months before Dribbling opens. In addition, we will directly call the team captains and coaches to sell the quality and convenience of the facility. Dribbling Indoor Soccer will offer membership rates for field rental to these teams to attract them to the facility. Spring is known for poor field conditions before the soccer season starts.
During the first two weekends in April, Dribbling Indoor Soccer will offer free indoor soccer clinics for children and adults.
5.2.1 Sales Forecast:
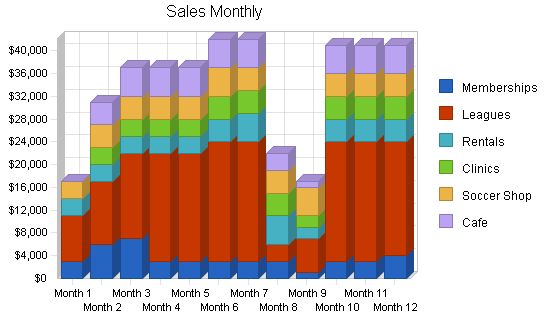
The following is the sales forecast for the next three years. The clinics, cafe, and the soccer shop will have direct cost of sales. The clinics will hire coaches to lead the clinics. The soccer shop’s direct cost will be the wholesale price of the shop’s inventory.
Dribbling Indoor Soccer will make a strong push to expand league play in the summer. The summer is usually softball and baseball season, and only competitive soccer teams play during the summer months. These competitive teams represent only 10% of young soccer players. The outdoor adult soccer leagues also don’t operate during the summer months, leaving many recreational soccer players with an opportunity to play.
The only slow period for sales will be in November and December. Though league sessions end in mid-November, December has proven to be a poor month to begin a new league session.
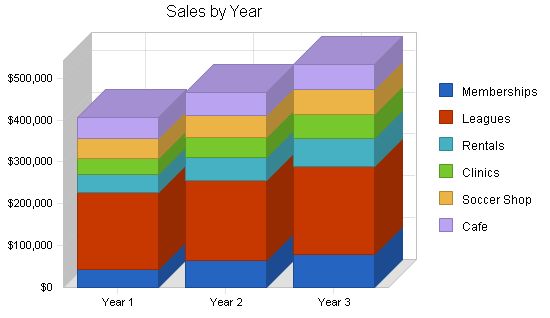
Sales Forecast
| Sales Forecast | |||
| Year 1 | Year 2 | Year 3 | |
| $42,000 | $65,000 | $78,000 | |
| $185,000 | $190,000 | $210,000 | |
| $43,000 | $55,000 | $67,000 | |
| $38,000 | $48,000 | $58,000 | |
| $49,000 | $54,000 | $59,000 | |
| $48,000 | $54,000 | $60,000 | |
| $405,000 | $466,000 | $532,000 | |
Management Summary
Les and Noh Klew will manage Dribbling Indoor Soccer. They are people-oriented, experienced supervisors, and certified officials for indoor soccer games.
Les played a key role in promoting soccer in Wingback County. He founded the Wingback County Soccer Council, which grew from a handful of interested individuals to a staff of six and a budget of $200,000. The council was instrumental in establishing the city’s new outdoor soccer facility and hosting the upcoming regional competition.
Noh also contributed significantly to soccer development in Wingback County. As the council’s marketing and fundraising coordinator, she consistently increased donations by 15% annually and implemented successful marketing campaigns to attract more youth and adult soccer teams.
6.1 Personnel Plan
The personnel of Dribbling Indoor Soccer include:
- Manager: Les Klew
- Assistant Manager: Noh Klew
- Senior Staff: 2
- Staff: 2
- Store Staff Person: 1
- Cafe Staff: 2
A janitorial service will handle facility cleaning, and clinic coaches will be hired on a short-term basis and paid from clinic revenues.
| Personnel Plan | |||
| Year 1 | Year 2 | Year 3 | |
| $33,600 | $36,000 | $38,000 | |
| $33,600 | $36,000 | $38,000 | |
| $52,800 | $55,000 | $57,000 | |
| $46,800 | $48,000 | $50,000 | |
| $19,200 | $21,000 | $23,000 | |
| $28,800 | $31,000 | $34,000 | |
| 7 | 7 | 7 | |
| $214,800 | $227,000 | $240,000 | |
Financial Plan
The following is the financial plan for Dribbling Indoor Soccer.
7.1 Break-even Analysis
Our monthly break-even, based on forecasted sales and anticipated expenses, is as follows:
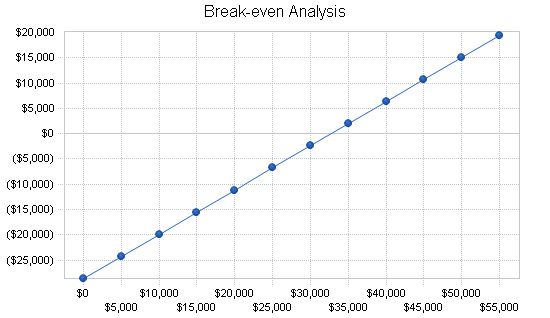
Break-even Analysis
Monthly Revenue Break-even: $32,741
Assumptions:
– Average Percent Variable Cost: 13%
– Estimated Monthly Fixed Cost: $28,618
7.2 Projected Profit and Loss
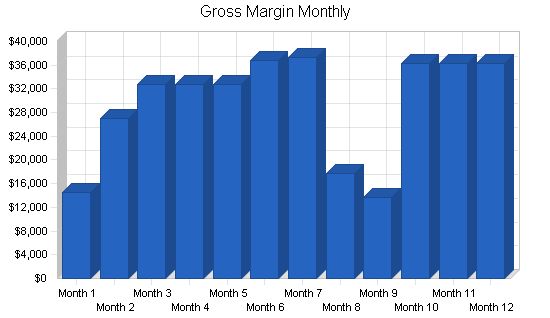
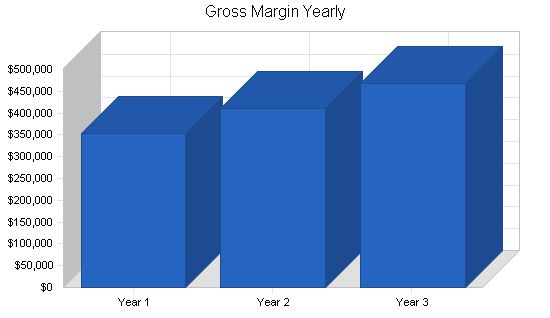
The table and charts below show the projected profit and loss for the next three years.
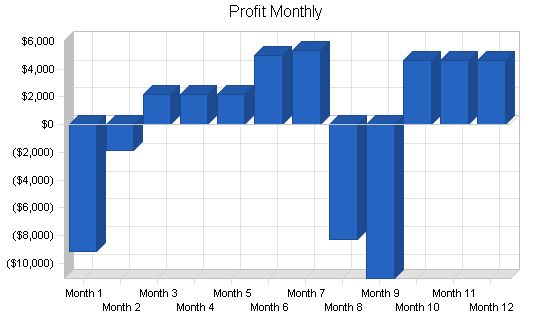
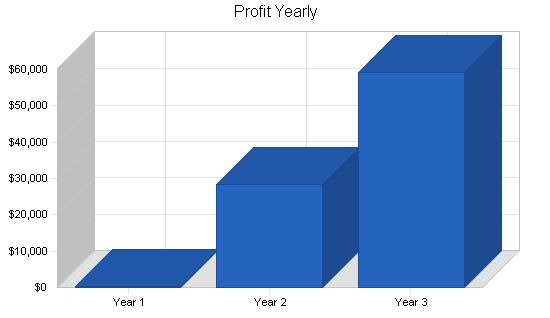
Pro Forma Profit and Loss
Year 1 Year 2 Year 3
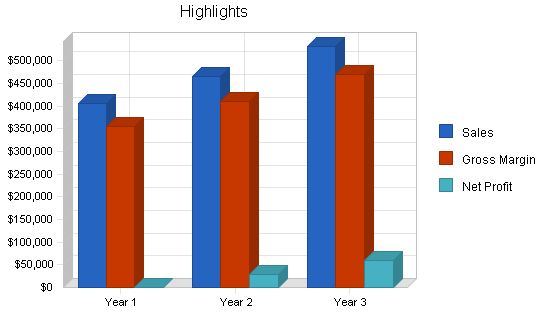
Sales $405,000 $466,000 $532,000
Direct Cost of Sales $51,000 $56,000 $63,000
Other Production Expenses $0 $0 $0
Total Cost of Sales $51,000 $56,000 $63,000
Gross Margin $354,000 $410,000 $469,000
Gross Margin % 87.41% 87.98% 88.16%
Expenses
Payroll $214,800 $227,000 $240,000
Sales and Marketing $31,600 $33,600 $33,600
Depreciation $6,000 $6,000 $6,000
Leased Equipment $0 $0 $0
Utilities $4,800 $4,800 $4,800
Insurance $6,000 $6,000 $6,000
Rent $48,000 $48,000 $48,000
Payroll Taxes $32,220 $34,050 $36,000
Other $0 $0 $0
Total Operating Expenses $343,420 $359,450 $374,400
Profit Before Interest and Taxes $10,580 $50,550 $94,600
EBITDA $16,580 $56,550 $100,600
Interest Expense $10,000 $10,000 $10,000
Taxes Incurred $174 $12,165 $25,380
Net Profit $406 $28,385 $59,220
Net Profit/Sales 0.10% 6.09% 11.13%
7.3 Projected Cash Flow
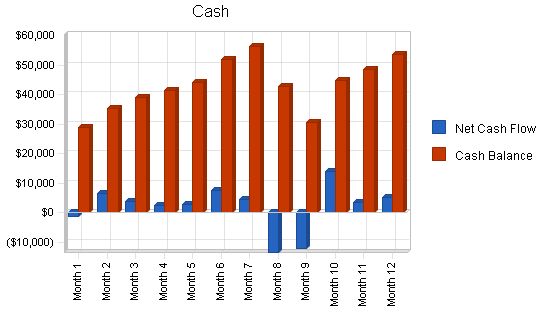
The following table and chart highlight the projected cash flow for three years.
Pro Forma Cash Flow
| Pro Forma Cash Flow | |||
| Year 1 | Year 2 | Year 3 | |
| Cash Received | |||
| Cash from Operations | |||
| Cash Sales | $405,000 | $466,000 | $532,000 |
| Subtotal Cash from Operations | $405,000 | $466,000 | $532,000 |
| Additional Cash Received | |||
| Sales Tax, VAT, HST/GST Received | $0 | $0 | $0 |
| New Current Borrowing | $0 | $0 | $0 |
| New Other Liabilities (interest-free) | $0 | $0 | $0 |
| New Long-term Liabilities | $0 | $0 | $0 |
| Sales of Other Current Assets | $0 | $0 | $0 |
| Sales of Long-term Assets | $0 | $0 | $0 |
| New Investment Received | $0 | $0 | $0 |
| Subtotal Cash Received | $405,000 | $466,000 | $532,000 |
| Expenditures | Year 1 | Year 2 | Year 3 |
| Expenditures from Operations | |||
| Cash Spending | $214,800 | $227,000 | $240,000 |
| Bill Payments | $166,660 | $205,627 | $225,659 |
| Subtotal Spent on Operations | $381,460 | $432,627 | $465,659 |
| Additional Cash Spent | |||
| Sales Tax, VAT, HST/GST Paid Out | $0 | $0 | $0 |
| Principal Repayment of Current Borrowing | $0 | $0 | $0 |
| Other Liabilities Principal Repayment | $0 | $0 | $0 |
| Long-term Liabilities Principal Repayment | $0 | $0 | $0 |
| Purchase Other Current Assets | $0 | $0 | $0 |
| Purchase Long-term Assets | $0 | $0 | $0 |
| Dividends | $0 | $0 | $0 |
| Subtotal Cash Spent | $381,460 | $432,627 | $465,659 |
| Net Cash Flow | $23,540 | $33,373 | $66,341 |
| Cash Balance | $53,540 | $86,914 | $153,255 |
7.4 Projected Balance Sheet
The following table highlights the projected balance sheet for three years.
| Pro Forma Balance Sheet | |||
| Year 1 | Year 2 | Year 3 | |
| Assets | |||
| Current Assets | |||
| Cash | $53,540 | $86,914 | $153,255 |
| Inventory | $5,225 | $5,737 | $6,454 |
| Other Current Assets | $5,000 | $5,000 | $5,000 |
| Total Current Assets | $63,765 | $97,651 | $164,709 |
| Long-term Assets | |||
| Long-term Assets | $40,000 | $40,000 | $40,000 |
| Accumulated Depreciation | $6,000 | $12,000 | $18,000 |
| Total Long-term Assets | $34,000 | $28,000 | $22,000 |
| Total Assets | $97,765 | $125,651 | $186,709 |
| Liabilities and Capital | Year 1 | Year 2 | Year 3 |
| Current Liabilities | |||
| Accounts Payable | $17,359 | $16,860 | $18,698 |
| Current Borrowing | $0 | $0 | $0 |
| Other Current Liabilities | $0 | $0 | $0 |
| Subtotal Current Liabilities | $17,359 | $16,860 | $18,698 |
| Long-term Liabilities | $100,000 | $100,000 | $100,000 |
| Total Liabilities | $117,359 | $116,860 | $118,698 |
| Paid-in Capital | $60,000 | $60,000 | $60,000 |
| Retained Earnings | ($80,000) | ($79,594) | ($51,209) |
| Earnings | $406 | $28,385 | $59,220 |
| Total Capital | ($19,594) | $8,791 | $68,011 |
| Total Liabilities and Capital | $97,765 | $125,651 | $186,709 |
| Net Worth | ($19,594) | $8,791 | $68,011 |
7.5 Business Ratios
Business ratios for the years of this plan are shown below. Industry profile ratios based on the Standard Industrial Classification (SIC) code 7997, Sport and Recreation Club, are shown for comparison.
| Ratio Analysis | ||||
| Year 1 | Year 2 | Year 3 | Industry Profile | |
| Sales Growth | 0.00% | 15.06% | 14.16% | 2.76% |
| Percent of Total Assets | ||||
| Inventory | 5.34% | 4.57% | 3.46% | 4.78% |
| Other Current Assets | 5.11% | 3.98% | 2.
Personnel Plan: Manager – Klew, Les: 0% – $2,800 (Month 1-12) Asst. Manager – Noh Klew: 0% – $2,800 (Month 1-12) Senior Staff: 0% – $4,400 (Month 1-12) Staff Members: 0% – $3,900 (Month 1-12) Soccer Store Staff Person: 0% – $1,600 (Month 1-12) Cafe Staff: 0% – $2,400 (Month 1-12) Total People: 7 (Month 1-12) Total Payroll: $17,900 (Month 1-12) General Assumptions: Plan Month: 1-12 Current Interest Rate: 10.00% (Month 1-12) Long-term Interest Rate: 10.00% (Month 1-12) Tax Rate: 30.00% (Month 1-12) Other: 0 (Month 1-12) Pro Forma Profit and Loss: Sales: $17,000 (Month 1), $31,000 (Month 2), $37,000 (Month 3-5), $42,000 (Month 6-7), $22,000 (Month 8), $17,000 (Month 9), $41,000 (Month 10-12) Direct Cost of Sales: $2,500 (Month 1), $4,000 (Month 2), $4,250 (Month 3-5), $5,250 (Month 6), $4,750 (Month 7), $3,250 (Month 8), $4,750 (Month 9-12) Other Production Expenses: $0 (Month 1-12) Total Cost of Sales: $2,500 (Month 1), $4,000 (Month 2), $4,250 (Month 3-5), $5,250 (Month 6), $4,750 (Month 7), $3,250 (Month 8), $4,750 (Month 9-12) Gross Margin: $14,500 (Month 1), $27,000 (Month 2), $32,750 (Month 3-5), $36,750 (Month 6), $37,250 (Month 7), $17,750 (Month 8), $13,750 (Month 9), $36,250 (Month 10-12) Gross Margin %: 85.29% (Month 1), 87.10% (Month 2), 88.51% (Month 3-5), 87.50% (Month 6), 88.69% (Month 7), 80.68% (Month 8), 80.88% (Month 9), 88.41% (Month 10-12) Expenses: Payroll: $17,900 (Month 1-12) Sales and Marketing and Other Expenses: $800 (Month 1), $2,800 (Month 2-12) Depreciation: $500 (Month 1-12) Leased Equipment: $0 (Month 1-12) Utilities: $400 (Month 1-12) Insurance: $500 (Month 1-12) Rent: $4,000 (Month 1-12) Payroll Taxes: 15% – $2,685 (Month 1-12) Other: $0 (Month 1-12) Total Operating Expenses: $26,785 (Month 1-12) Profit Before Interest and Taxes: ($12,285) (Month 1), ($1,785) (Month 2), $3,965 (Month 3-5), $7,965 (Month 6-7), ($11,035) (Month 8), ($15,035) (Month 9), $7,465 (Month 10-12) EBITDA: ($11,785) (Month 1), ($1,285) (Month 2), $4,465 (Month 3-5), $8,465 (Month 6-7), ($10,535) (Month 8), ($14,535) (Month 9), $7,965 (Month 10-12) Interest Expense: $833 (Month 1-12) Taxes Incurred: ($3,936) (Month 1), ($786) (Month 2), $939 (Month 3-5), $2,140 (Month 6), $2,290 (Month 7), ($3,561) (Month 8), ($4,761) (Month 9), $1,990 (Month 10-12) Net Profit: ($9,183) (Month 1), ($1,833) (Month 2), $2,192 (Month 3-5), $4,992 (Month 6), $5,342 (Month 7), ($8,308) (Month 8), ($11,108) (Month 9), $4,642 (Month 10-12) Net Profit/Sales: -54.02% (Month 1), -5.91% (Month 2), 5.92% (Month 3-5), 11.89% (Month 6), 12.72% (Month 7), -37.76% (Month 8), -65.34% (Month 9), 11.32% (Month 10-12) Pro Forma Cash Flow: | Month | Cash Received | Cash from Operations | Cash Sales | Subtotal Cash from Operations | |——-|—————|———————|————|—————————–| | 1 | N/A | $17,000 | $17,000 | $17,000 | | 2 | N/A | $31,000 | $31,000 | $31,000 | | 3 | N/A | $37,000 | $37,000 | $37,000 | | 4 | N/A | $37,000 | $37,000 | $37,000 | | 5 | N/A | $37,000 | $37,000 | $37,000 | | 6 | N/A | $42,000 | $42,000 | $42,000 | | 7 | N/A | $42,000 | $42,000 | $42,000 | | 8 | N/A | $22,000 | $22,000 | $22,000 | | 9 | N/A | $17,000 | $17,000 | $17,000 | | 10 | N/A | $41,000 | $41,000 | $41,000 | | 11 | N/A | $41,000 | $41,000 | $41,000 | | 12 | N/A | $41,000 | $41,000 | $41,000 | Pro Forma Balance Sheet: | Month | Assets | Current Assets | Cash | Inventory | Other Current Assets | Total Current Assets | Long-term Assets | Total Assets | |——-|—————-|—————-|——–|———–|———————|———————-|—————–|————–| | 1 | $80,000 | $40,000 | $28,891 | $3,500 | $5,000 | $37,391 | $39,500 | $76,891 | | 2 | $83,806 | $44,806 | $35,406 | $4,400 | $5,000 | $44,806 | $39,000 | $83,806 | | 3 | $87,303 | $48,803 | $39,128 | $4,675 | $5,000 | $48,803 | $38,500 | $87,303 | | 4 | $89,230 | $51,230 | $41,555 | $4,675 | $5,000 | $51,230 | $38,000 | $89,230 | | 5 | $91,422 | $53,922 | $44,247 | $4,675 | $5,000 | $53,922 | $37,500 | $91,422 | | 6 | $99,604 | $62,604 | $51,829 | $5,775 | $5,000 | $62,604 | $37,000 | $99,604 | | 7 | $103,013 | $66,513 | $56,288 | $5,225 | $5,000 | $66,513 | $36,500 | $103,013 | | 8 | $88,567 | $52,567 | $42,892 | $4,675 | $5,000 | $52,567 | $36,000 | $88,567 | | 9 | $74,800 | $39,300 | $30,725 | $3,575 | $5,000 | $39,300 | $35,500 | $74,800 | | 10 | $90,076 | $55,076 | $44,851 | $5,225 | $5,000 | $55,076 | $35,000 | $90,076 | | 11 | $93,123 | $58,623 | $48,398 | $5,225 | $5,000 | $58,623 | $34,500 | $93,123 | | 12 | $97,765 | $63,765 | $53,540 | $5,225 | $5,000 | $63,765 | $34,000 | $97,765 | Please note that the provided tables have been condensed and simplified for easy readability. |
|
Hello!
I’m Andrew Brooks, a seasoned finance consultant from the USA and the mind behind phonenumber247.com.
My career is built on a foundation of helping individuals and businesses thrive financially in an ever-changing economic landscape. At phonenumber247.com, my aim is to demystify the complex world of finance, providing clear, actionable advice that can help you navigate your financial journey with confidence. Whether it’s personal finance management, investment strategies, or understanding the nuances of market dynamics, I’m here to share insights and tools that can propel you towards your financial goals.
Welcome to my digital space, where every piece of advice is a step closer to financial clarity and success!
