Franchise Sandwich Shop Business Plan
The purpose of this plan is to secure additional funding to open a QSR franchise in Ashland, Oregon. The owners are willing to invest $30,000 and assume over $110,000 in short-term liability for inventory and early operations. We seek a $200,000 SBA 504 loan, amortized over 10 years.
The franchiser, “The Sub Shop Corp.,” is a rapidly growing franchise with sales exceeding $800,000,000 last year. Positioned between fast food and sit-down restaurants, it caters to health-conscious customers with higher incomes who are willing to pay more for a better fast food option. Our goal is to be their choice in the Ashland Metro area.
To succeed and promote a healthy lifestyle, we will sponsor local sporting events and donate 3% of profits to charities. We will also market our products through partnerships with local businesses, the Shakespearean Festival, local hotels, and catering services through party supply stores and hotel managers.
Our primary goal is to secure the $200,000 SBA loan. Once achieved, we will focus on building value for our constituents, employees, customers, and the community, aligning with the SBA’s objectives.
1.1 Objectives
Our first objective is to open the Franchise restaurant four months after confirming the site with the realtor. We confirmed our site in April, so our goal is to be up and running by August. Start-up costs between April and August can be found in the Start-up Summary Section.
The Sub Shop will turn a profit by the beginning of our second fiscal year.
We will pay down our $200,000 SBA loan to $180,000 by the end of year one.
Repeat customers will constitute 70% of our overall business by the end of year one. We will track customer habits and loyalty through a local marketing research firm and publish the results once a quarter.
Net Profit for year one will be 21%.
1.2 Mission
Our mission is to bring to market the tastiest and healthiest fast food in Ashland at a slight cost premium over other fast food restaurants. Our high standards of quality and cleanliness will establish our reputation as the cleanest fast food restaurant in Ashland.
Our community is as important to us as making a profit. We will devote 2% of profits to a local women’s shelter and 1% to a local environmental conservation fund. This company is founded on the concept that good works and good deeds not only serve the needs of the community but also keep our company healthy and committed to the success of its customers.
1.3 Keys to Success
The most important key to success is our location. It is crucial that our location meets our expectations and is convenient for potential customers. As stipulated by the franchise agreement, our “Type A – Profile 1” location must have a minimum of 6,000 customers within a four-block radius (or five-minute walk time). The pedestrian traffic must be adequate, and the lunch habits of the customers must be conducive to eating out.
Another key to success lies in our ability to execute our plan. If we neglect any aspect of our plan, such as numbers, employees, cleaning and food standards, or commitment to customers, we will not succeed and thrive.
“The Sub Shop” Corporation franchises, and sometimes owns and operates quick-service Italian-style sub sandwich shops called "The Sub Shop" subs.
The Sub Shop’s upscale concept fits a niche between fast food and fine dining, offering customers the best benefits of both segments. The company provides the convenience of fast food with rapid response times, affordability, as well as carry-out and home meal replacement options. The Sub Shop also offers a fresher and tastier alternative to typical fried fast food products such as hamburgers and french fries.
The Sub Shop’s concept was born in the kitchen of a popular Italian sit-down restaurant called Gianni’s. The goal of the original owner was to provide great Italian food in a clean, urban environment, and at a reasonable price. After two years as Gianni’s, the owner changed the name to The Sub Shop and began selling subs and soup to go. In 1993, the company expanded to two stores, and sales tripled. Financing was secured in December of 1993, and the company became a local franchise, then a national franchise. Now with 53 stores in 23 states and four countries, The Sub Shop has taken the fast food segment by storm by producing a better product than its competitors, and at a moderately low price.
2.1 Company Ownership
Ninety-seven percent of the restaurant belongs to Walsh and Walsh LLC. The company was formed in Oregon in 1995 and is owned by Jack William Walsh and his father Luke Walsh. Luke owns 77%, and Jack owns 30% of Walsh and Walsh LLC. The remaining 3% is held by Lisa McKewan, Store Manager.
2.2 Start-up Summary
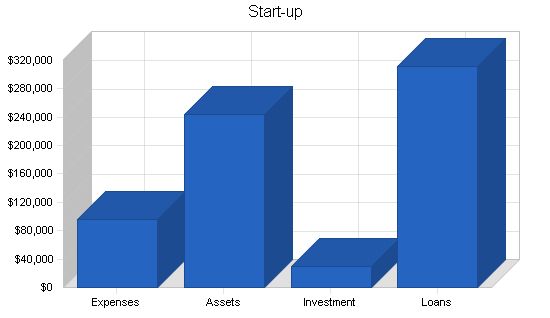
The start-up table shows a summary of our overall start-up costs. The highest initial outlay is for the franchise fee, which is required to launch the franchise. After paying the franchise fee, our only liability to the franchise will be the 7% cost of sales and 2.2% advertising charge. Normally the franchise fee would be paid in interest-accruing installments, but we decided to forego this to keep the books as clean as possible and to reduce the possibility of a “parent/child” conflict between our company and the constituents.
Cash requirements for start-up are $19,700, and most of this will sit in a zero-interest-bearing, highly liquid bank account. The first month our change in accounts payable will top $61,000, so we need this $19,700 in case sales are not what we expected. If sales are 30% off projected, this $19,700 will help us gather enough cash to pay off our accounts payable within 30 days. The principles will invest a combined $30,000 to start-up the franchise. We expect that the majority of this will be paid back to the owners within two years of operations in the form of dividends. This investment makes up over 8% of the total start-up requirements for the company. The remainder consists of one $65,000 short-term interest-bearing, unsecured personal loan, one $15,980 interest-free “First Card Visa” 0% promotional loan, and a $200,000 long-term loan guaranteed by the SBA 504 program. The expected term of the loan is 10 years.
The SBA loan that we are seeking will be secured via the pre-appraised market value of the land and property, as well as the improvements to be made on the property through 2001. The estimated net market value of the property following all improvements is approximately $320,000.
Start-up Requirements:
– Business License: $180
– Refrigerator/Freezer: $5,500
– Building Improvements: $35,000
– Franchise Fee: $45,000
– 3% Loan Origination Fee: $7,800
– Insurance: $1,500
– Research and development: $1,500
– Total Start-up Expenses: $96,480
Start-up Assets:
– Cash Required: $19,700
– Start-up Inventory: $15,800
– Other Current Assets: $4,000
– Long-term Assets: $205,000
– Total Assets: $244,500
Total Requirements: $340,980
Start-up Funding:
– Start-up Expenses to Fund: $96,480
– Start-up Assets to Fund: $244,500
– Total Funding Required: $340,980
Assets:
– Non-cash Assets from Start-up: $224,800
– Cash Requirements from Start-up: $19,700
– Additional Cash Raised: $0
– Cash Balance on Starting Date: $19,700
– Total Assets: $244,500
Liabilities and Capital:
– Liabilities:
– Current Borrowing: $65,000
– Long-term Liabilities: $200,000
– Accounts Payable (Outstanding Bills): $30,000
– Other Current Liabilities (interest-free): $15,980
– Total Liabilities: $310,980
– Capital:
– Planned Investment:
– Luke Walsh: $15,000
– Jack Walsh: $15,000
– Additional Investment Requirement: $0
– Total Planned Investment: $30,000
– Loss at Start-up (Start-up Expenses): ($96,480)
– Total Capital: ($66,480)
– Total Capital and Liabilities: $244,500
– Total Funding: $340,980
2.3 Company Locations and Facilities:
The company will be located between Oak St. and Water St. on Highway 99 in Ashland, Oregon. It is the busiest shopping district in Ashland, close to Lithia Park.
Products:
We offer a variety of submarine sandwiches, salads, soups, chili, chips, cookies, and sodas. Our sandwiches are made with The Sub Shop’s unique sweet mustard sauce, fresh daily bread, and made-to-order toasting.
3.1 Product Description:
All sandwiches can be customized. Our sandwiches are known for their fresh, toasted bread and freshly sliced meats and cheeses.
3.2 Competitive Comparison:
Our competition includes on-campus sandwich shops, fast food restaurants, and downtown eateries. We differentiate ourselves with our specialized sub sandwiches and focus on healthy, yet tasty fast food. Our competition may have healthy options, but their bread is often tasteless and stale, and their facilities are not clean.
3.3 Sales Literature:
We provide menus from The Sub Shop and custom flyers. Our flyers include catering prices, comparisons to competitors, and our hours of operation. They are strategically placed near local events and community centers.
3.4 Sourcing:
The Sub Shop Corp. supplies us with the necessary equipment. Due to bulk buying and standardized supply lines, our purchasing costs are 10% below non-franchise restaurants, with payment terms of 45 days.
3.5 Technology:
We utilize technology to streamline operations, using Business Plan Pro software for planning, ordering equipment for efficiency, and biodegradable products for sustainability. We also encourage recycling and explore renewable energy sources.
3.6 Future Products:
Future product suggestions are welcome and may be added to our product mix.
Market Analysis Summary:
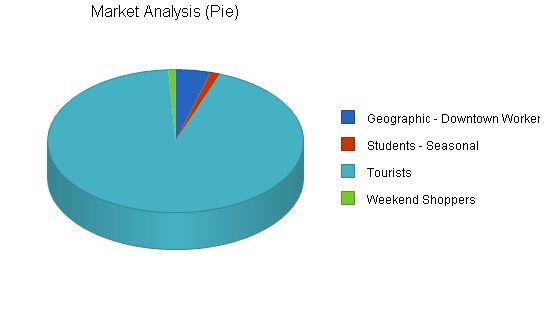
Our market consists of tourists, downtown workers, and students from Southern Oregon University. Tourists make up the largest segment, with over 362,000 visitors to Ashland each year. We aim to capture 15% of the local market and 20% of tourist visitors, totaling 138,000 meals.
Demographics indicate a shift towards non-traditional households and a desire for convenient food options. Ashland’s location and attractions contribute to its economic health, with tourism and education playing significant roles.
4.1 Market Segmentation:
Our largest market is tourists, followed by downtown workers. Weekend shoppers and students make up the remaining portion of our target market.
Market Analysis
Potential Customers Growth Year 1 Year 2 Year 3 Year 4 Year 5 CAGR
Geographic – Downtown Workers and Students 2% 17,000 17,255 17,514 17,777 18,044 1.50%
Students – Seasonal 3% 4,700 4,841 4,986 5,136 5,290 3.00%
Tourists 9% 362,000 394,580 430,092 468,800 510,992 9.00%
Weekend Shoppers 2% 3,500 3,553 3,606 3,660 3,715 1.50%
Total 8.57% 387,200 420,229 456,198 495,373 538,041 8.57%
4.2 Target Market Segment Strategy
Downtown Workers:
We will target downtown workers through local businesses, advertising, event sponsorship, and word of mouth.
Students:
Ashland has a seasonal student population of around 4,700. We expect to reach students through campus activities, marketing, and sponsoring special student events.
Tourists:
Over 100,000 tourists will visit the Oregon Shakespearean Festival in 2001. Approximately 262,000 people will visit Ashland for its premier recreational activities. We will reach tourists when they visit Ashland and differentiate ourselves from other venues on the street by offering relatively inexpensive food without compromising the premium shopping experience in Downtown Ashland.
Weekend Shoppers:
Weekend shoppers from Medford come to downtown Ashland for clothes, gifts, and crafts. With over 40,000 people living and working in Medford, we predict that at least 8% of them will shop in downtown Ashland.
4.2.1 Market Needs
There are two market needs we are attempting to fill:
1. A fast food restaurant that produces tasty food at a low cost in a clean environment. We will maintain high standards of cleanliness and appeal to customers’ healthy lifestyles.
2. Customers who seek a healthy, flavorful dining experience in a clean and comfortable environment. We will market products that satisfy their taste buds and desire for quality.
4.2.2 Market Trends
The market for fast food is becoming more demanding. Healthy fast food options have proven successful, and there is a trend towards quality in both food and ambiance. We will cater to customers who want more for less and are repulsed by traditional fast food practices.
Consumers spend about 46% of their food budget on eating out.
4.2.3 Market Growth
The QSR market is expected to grow at a weighted 4.82% rate due to the recession. However, the Ashland area and tourism in Jackson County are experiencing a healthy 8.57% growth, resulting in an estimated increase in our potential customer base.
The food service industry is estimated to reach $30 billion in 2010, with the QSR segment accounting for over 2/3 of total traffic and over half of restaurant sales. QSR sales are projected to reach $15 billion by 2010.
4.3.1 Industry Participants
The industry consists of large brand-name restaurants and local fast food chains. In the Ashland market, Burger King, McDonald’s, Taco Bell, and Taco Time, are the main competitors.
4.3.2 Distribution Patterns
We distribute our products directly to customers through retail and catering services without the use of resellers or distributors.
4.3.3 Competition and Buying Patterns
Fast food purchases are largely impulsive. Customers have their favorite fast food restaurants, and our goal is to capture those customers and build loyalty through purchase punch cards, daily specials, and direct mail marketing.
4.3.4 Main Competitors
Our main competitors are national fast food franchises, with SubSub being our largest competitor in the Ashland area. We will differentiate ourselves through taste, quality, attentiveness to customers, and overall dining experience.
Strategy and Implementation Summary
Our #1 strategy is to focus on providing an excellent customer experience. Our success depends on fulfilling our promises to customers and ensuring their satisfaction. We will adapt our strategies to customer and market trends while maintaining consistency in brand and message.
5.1 Strategy Pyramid
– Build Customer Loyalty and Word-of-Mouth (WOM) Buzz
– Punch Card System
– Community Event Sponsorship
– 10 Sandwiches, 11th Free
– 10K Jackson County Run
– European Prints, Furniture
Our value proposition is offering high-quality, healthy fast food at a reasonable price. Our facilities are clean, and our food is tastier than that of our competitors. We provide a comfortable, healthy dining environment.
5.3 Competitive Edge
We have a competitive edge in product quality and differentiation, cleanliness, and ambiance of our seating area. Our sandwiches, soups, etc., are of the finest quality, and our seating area features European-inspired decor. We will differentiate ourselves from SubSub by providing better customer service and food quality.
Our marketing strategy aims to reach the largest number of residents, tourists, and students with cost-effective tactics. We will focus on building customer loyalty, extending our franchise brand locally, and generating word-of-mouth advertising.
5.4.1 Positioning Statement
For those seeking a fast, friendly, and tasty lunch, we offer quick meals in a clean and pleasing environment. Our food and service are of high quality.
5.4.2 Pricing Strategy
Retail prices will be competitive, and our highest margins will come from catering services and large sub products. We will focus on expanding the catering segment.
5.4.3 Promotion Strategy
We will promote our products through local PR efforts, special mid-day promotions, community event sponsorships, classified paper advertisements, and active involvement in the community.
5.4.4 Distribution Strategy
We will distribute our products directly to customers without the use of resellers or distributors.
5.4.5 Marketing Programs
Our marketing programs will focus on customer retention, loyalty, and cost value. Examples include daily specials, direct mail coupons, and sponsorship of local events.
5.5 Milestones
See table below for important milestones:
Milestone Start Date End Date Budget Manager Department
Shakespeare Festival Ticket Stub Promotion 6/1/2001 10/31/2001 $700 Luke Department
50% off Coupon – Preparation and Distribution 6/1/2001 7/25/2001 $400 Jack Department
Sponsorship of "Pear Blossom Run" 2/1/2002 2/5/2002 $600 Jack Department
Establish Menus in Hotels – Slotting 5/1/2001 7/1/2001 $2,000 Lisa Department
Devise Specials Schedule and Logistics 7/1/2001 7/31/2001 $100 Luke Department
Wrap-up Menu, Special Offers 7/1/2001 7/25/2001 $0 Luke Department
Complete Interior Decor 7/1/2001 7/15/2001 $0 Jack Department
Hire and Train Employees 7/1/2001 7/31/2001 $1,200 Lisa Department
Other 1/1/2001 1/1/2001 $0 Manager Department
Totals $5,000
5.6 Sales Strategy
Our sales strategy is to reach a large number of Jackson County residents and tourists by offering value-added incentives to purchase our products. Our marketing and sales programs are closely aligned, with our sales programs focusing on customer retention and loyalty.
5.6.1 Sales Programs
Examples of our sales programs include daily in-store specials, direct mail coupons, sponsorship of local events, and ticket stub promotions.
5.6.2 Sales Forecast
The majority of our revenue will come from medium subs and cookies/desserts.
Sales Forecast:
– Unit Sales for Large Subs: 19,024 (Year 1), 20,926 (Year 2), 23,019 (Year 3), 25,321 (Year 4), 27,853 (Year 5)
– Unit Sales for Medium Subs: 139,508 (Year 1), 153,458 (Year 2), 168,804 (Year 3), 185,685 (Year 4), 204,253 (Year 5)
– Unit Sales for Small Subs: 50,730 (Year 1), 55,803 (Year 2), 61,383 (Year 3), 67,522 (Year 4), 74,274 (Year 5)
– Unit Sales for Entree Salads: 19,024 (Year 1), 20,926 (Year 2), 23,019 (Year 3), 25,321 (Year 4), 27,853 (Year 5)
– Unit Sales for Side Salads: 15,219 (Year 1), 16,741 (Year 2), 18,415 (Year 3), 20,256 (Year 4), 22,282 (Year 5)
– Unit Sales for Chips: 38,048 (Year 1), 41,852 (Year 2), 46,037 (Year 3), 50,641 (Year 4), 55,705 (Year 5)
– Unit Sales for Party Subs and/or Trays: 254 (Year 1), 279 (Year 2), 307 (Year 3), 338 (Year 4), 371 (Year 5)
– Unit Sales for Desserts: 16,487 (Year 1), 18,136 (Year 2), 19,950 (Year 3), 21,945 (Year 4), 24,139 (Year 5)
– Unit Sales for Cookies and Desserts: 63,413 (Year 1), 69,754 (Year 2), 76,729 (Year 3), 84,402 (Year 4), 92,842 (Year 5)
– Unit Sales for Soups and Chili: 17,756 (Year 1), 19,531 (Year 2), 21,484 (Year 3), 23,633 (Year 4), 25,996 (Year 5)
– Unit Sales for Drinks: 50,729 (Year 1), 55,803 (Year 2), 61,383 (Year 3), 67,522 (Year 4), 74,274 (Year 5)
– Total Unit Sales: 430,189 (Year 1), 473,210 (Year 2), 520,530 (Year 3), 572,584 (Year 4), 629,842 (Year 5)
Unit Prices:
– Unit Price for Large Subs: $7.10 (Year 1-5)
– Unit Price for Medium Subs: $5.10 (Year 1-5)
– Unit Price for Small Subs: $3.89 (Year 1-5)
– Unit Price for Entree Salads: $5.10 (Year 1-5)
– Unit Price for Side Salads: $1.59 (Year 1-5)
– Unit Price for Chips: $0.89 (Year 1-5)
– Unit Price for Party Subs and/or Trays: $22.00 (Year 1-5)
– Unit Price for Desserts: $1.49 (Year 1-5)
– Unit Price for Cookies and Desserts: $1.39 (Year 1-5)
– Unit Price for Soups and Chili: $1.89 (Year 1-5)
– Unit Price for Drinks: $0.99 (Year 1-5)
Sales:
– Sales for Large Subs: $135,069 (Year 1), $148,576 (Year 2), $163,433 (Year 3), $179,776 (Year 4), $197,754 (Year 5)
– Sales for Medium Subs: $711,488 (Year 1), $782,637 (Year 2), $860,901 (Year 3), $946,991 (Year 4), $1,041,690 (Year 5)
– Sales for Small Subs: $197,340 (Year 1), $217,074 (Year 2), $238,781 (Year 3), $262,659 (Year 4), $288,925 (Year 5)
– Sales for Entree Salads: $97,021 (Year 1), $106,723 (Year 2), $117,396 (Year 3), $129,135 (Year 4), $142,049 (Year 5)
– Sales for Side Salads: $24,198 (Year 1), $26,618 (Year 2), $29,280 (Year 3), $32,208 (Year 4), $35,429 (Year 5)
– Sales for Chips: $33,862 (Year 1), $37,249 (Year 2), $40,973 (Year 3), $45,071 (Year 4), $49,578 (Year 5)
– Sales for Party Subs and/or Trays: $5,580 (Year 1), $6,138 (Year 2), $6,752 (Year 3), $7,427 (Year 4), $8,170 (Year 5)
– Sales for Desserts: $24,566 (Year 1), $27,023 (Year 2), $29,725 (Year 3), $32,697 (Year 4), $35,967 (Year 5)
– Sales for Cookies and Desserts: $88,143 (Year 1), $96,958 (Year 2), $106,654 (Year 3), $117,319 (Year 4), $129,051 (Year 5)
– Sales for Soups and Chili: $33,558 (Year 1), $36,914 (Year 2), $40,605 (Year 3), $44,666 (Year 4), $49,132 (Year 5)
– Sales for Drinks: $50,222 (Year 1), $55,245 (Year 2), $60,769 (Year 3), $66,847 (Year 4), $73,531 (Year 5)
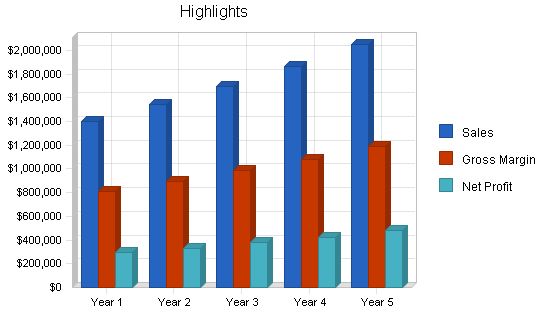
– Total Sales: $1,401,048 (Year 1), $1,541,154 (Year 2), $1,695,269 (Year 3), $1,864,796 (Year 4), $2,051,276 (Year 5)
Personnel Plan:
– Assistant Manager: $32,400 (Year 1), $34,344 (Year 2), $36,405 (Year 3), $38,589 (Year 4), $40,904 (Year 5)
– Store Manager: $44,400 (Year 1), $47,064 (Year 2), $49,888 (Year 3), $52,881 (Year 4), $56,054 (Year 5)
– Student Help (PT): $16,320 (Year 1-5)
– Total People: 7 (Year 1), 8 (Year 2), 10 (Year 3), 12 (Year 4-5)
– Total Payroll: $158,400 (Year 1), $167,834 (Year 2), $177,978 (Year 3), $188,657 (Year 4), $199,977 (Year 5)
7.4 Break-even Analysis
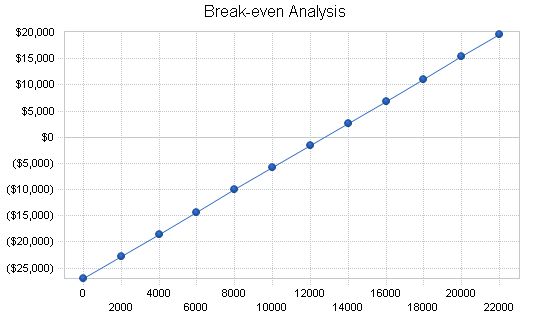
Our break-even analysis is based on estimated fixed costs. We expect fixed costs to include building and equipment leases, as well as other equipment costs and fees. Variable costs consist of labor, food inventory, and other product-related expenses. Our variable cost estimate is $1.14 per unit, subject to revision after reviewing actual data in the coming months.
Our monthly break-even unit sales total 12,754. This figure encompasses not only sandwiches but also cookies, soda, chips, and other add-ons. The break-even point is an average of entrees (sandwiches) and add-ons. The average revenue per unit is $3.26.
Break-even Analysis:
Monthly Units Break-even: 12,754
Monthly Revenue Break-even: $41,538
Assumptions:
Average Per-Unit Revenue: $3.26
Average Per-Unit Variable Cost: $1.14
Estimated Monthly Fixed Cost: $26,994
Projected Profit and Loss:
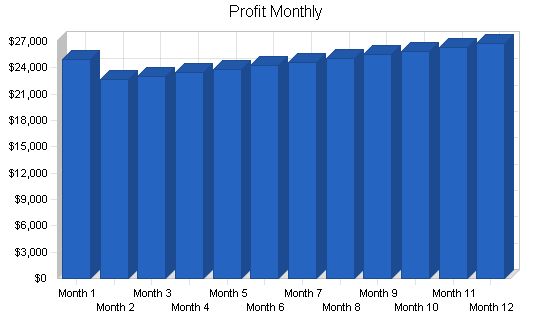
The table below shows the projected profit and loss for franchise Sub Shop.
Pro Forma Profit and Loss
Year 1 Year 2 Year 3 Year 4 Year 5
Sales $1,401,048 $1,541,154 $1,695,269 $1,864,796 $2,051,276
Direct Cost of Sales $490,544 $539,599 $593,559 $652,915 $718,206
Franchisor Royalty (7%) $98,073 $107,881 $118,669 $130,536 $143,589
Total Cost of Sales $588,618 $647,480 $712,228 $783,451 $861,796
Gross Margin $812,430 $893,674 $983,041 $1,081,346 $1,189,480
Gross Margin % 57.99% 57.99% 57.99% 57.99% 57.99%
Expenses
Payroll $158,400 $167,834 $177,978 $188,657 $199,977
Sales and Marketing and Other Expenses $69,714 $75,960 $82,634 $89,791 $97,479
Depreciation $4,548 $4,548 $4,548 $4,548 $4,548
Depreciation $60,000 $63,000 $66,000 $69,000 $72,000
Depreciation $7,200 $7,920 $8,712 $9,583 $10,542
Insurance $1,200 $1,320 $1,452 $1,597 $1,757
Cleaning Service $3,600 $3,960 $4,356 $4,792 $5,271
Cell Phone Service $4,200 $4,620 $5,082 $5,590 $6,149
Legal $2,400 $2,400 $2,400 $2,400 $2,400
Payroll Taxes $12,672 $13,427 $14,238 $15,093 $15,998
Other $0 $0 $0 $0 $0
Total Operating Expenses $323,934 $344,989 $367,400 $391,050 $416,120
Profit Before Interest and Taxes $488,496 $548,685 $615,641 $690,295 $773,360
EBITDA $493,044 $553,233 $620,189 $694,843 $777,908
Interest Expense $18,156 $15,848 $13,439 $11,031 $8,623
Taxes Incurred $174,138 $200,347 $222,614 $255,403 $282,698
Net Profit $296,203 $332,491 $379,588 $423,861 $482,039
Net Profit/Sales 21.14% 21.57% 22.39% 22.73% 23.50%
7.6 Projected Cash Flow
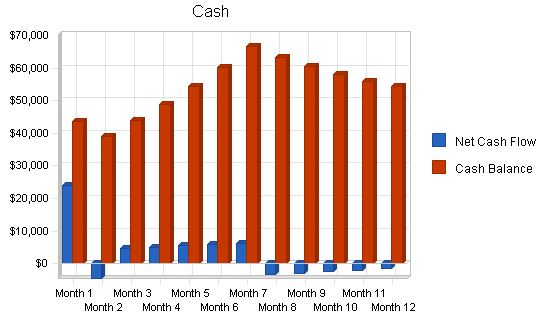
The following chart and table show the projected cash flow.
Pro Forma Cash Flow
| Pro Forma Cash Flow | |||||
| Year 1 | Year 2 | Year 3 | Year 4 | Year 5 | |
| Cash Received | |||||
| Cash from Operations | |||||
| Cash Sales | $1,401,048 | $1,541,154 | $1,695,269 | $1,864,796 | $2,051,276 |
| Subtotal Cash from Operations | $1,401,048 | $1,541,154 | $1,695,269 | $1,864,796 | $2,051,276 |
| Additional Cash Received | |||||
| Sales Tax, VAT, HST/GST Received | $0 | $0 | $0 | $0 | $0 |
| New Current Borrowing | $0 | $0 | $0 | $0 | $0 |
| New Other Liabilities (interest-free) | $0 | $0 | $0 | $0 | $0 |
| New Long-term Liabilities | $0 | $0 | $0 | $0 | $0 |
| Sales of Other Current Assets | $0 | $0 | $0 | $0 | $0 |
| Sales of Long-term Assets | $0 | $0 | $0 | $0 | $0 |
| New Investment Received | $0 | $0 | $0 | $0 | $0 |
| Subtotal Cash Received | $1,401,048 | $1,541,154 | $1,695,269 | $1,864,796 | $2,051,276 |
| Expenditures | Year 1 | Year 2 | Year 3 | Year 4 | Year 5 |
| Expenditures from Operations | |||||
| Cash Spending | $158,400 | $167,834 | $177,978 | $188,657 | $199,977 |
| Bill Payments | $922,938 | $1,036,091 | $1,130,375 | $1,244,014 | $1,361,367 |
| Subtotal Spent on Operations | $1,081,338 | $1,203,925 | $1,308,353 | $1,432,671 | $1,561,344 |
| Additional Cash Spent | |||||
| Sales Tax, VAT, HST/GST Paid Out | $0 | $0 | $0 | $0 | $0 |
| Principal Repayment of Current Borrowing | $12,000 | $12,000 | $12,000 | $12,000 | $12,000 |
| Other Liabilities Principal Repayment | $15,980 | $0 | $0 | $0 | $0 |
| Long-term Liabilities Principal Repayment | $20,004 | $20,004 | $20,004 | $20,004 | $20,004 |
| Purchase Other Current Assets | $0 | $75,000 | $0 | $0 | $0 |
| Purchase Long-term Assets | $35,000 | $250,000 | $0 | $0 | $0 |
| Dividends | $202,000 | $0 | $300,000 | $400,000 | $500,000 |
| Subtotal Cash Spent | $1,366,322 | $1,560,929 | $1,640,357 | $1,864,675 | $2,093,348 |
| Net Cash Flow | $34,726 | ($19,775) | $54,911 | $121 | ($42,072) |
| Cash Balance | $54,426 | $34,651 | $89,562 | $89,683 | $47,611 |
Projected Balance Sheet
7.7 Projected Balance Sheet
The following table is the projected balance sheet for the franchise Sub Shop.
| Pro Forma Balance Sheet | |||||
| Year 1 | Year 2 | Year 3 | Year 4 | Year 5 | |
| Assets | |||||
| Current Assets | |||||
| Cash | $54,426 | $34,651 | $89,562 | $89,683 | $47,611 |
| Inventory | $47,468 | $52,215 | $57,437 | $63,180 | $69,498 |
| Other Current Assets | $4,000 | $79,000 | $79,000 | $79,000 | $79,000 |
| Total Current Assets | $105,894 | $165,866 | $225,999 | $231,864 | $196,109 |
| Long-term Assets | |||||
| Long-term Assets | $240,000 | $490,000 | $490,000 | $490,000 | $490,000 |
| Accumulated Depreciation | $4,548 | $9,096 | $13,644 | $18,192 | $22,740 |
| Total Long-term Assets | $235,452 | $480,904 | $476,356 | $471,808 | $467,260 |
| Total Assets | $341,346 | $646,770 | $702,355 | $703,672 | $663,369 |
7.8 Business Ratios
Our ratios table shows industry numbers for SIC 5812, Eating Places. The SIC industry averages are generic and do not reflect our precise numbers.
| Ratio Analysis | ||||||
| Year 1 | Year 2 | Year 3 | Year 4 | Year 5 | Industry Profile | |
| Sales Growth | 0.00% | 10.00% | 10.00% | 10.00% | 10.00% | 7.60% |
| Percent of Total Assets | ||||||
| Inventory | 13.91% | 8.07% | 8.18% | 8.98% | 10.48% | 3.60% |
| Other Current Assets | 1.17% | 12.21% | 11.25% | 11.23% | 11.91% | 35.60% |
| Total Current Assets | 31.02% | 25.65% | 32.18% | 32.95% | 29.56% | 43.70% |
| Long-term Assets | 68.98% | 74.35% | 67.82% | 67.05% | 70.44% | 56.30% |
| Total Assets | 100.00% | 100.00% | 100.00% | 100.00% | 100.00% | 100.00% |
| Current Liabilities | ||||||
| Accounts Payable | … | |||||
| Pro Forma Cash Flow | |||||||||||||
| Month 1 | Month 2 | Month 3 | Month 4 | Month 5 | Month 6 | Month 7 | Month 8 | Month 9 | Month 10 | Month 11 | Month 12 | ||
| Cash Received | |||||||||||||
| Cash from Operations | |||||||||||||
| Cash Sales | $110,471 | $111,576 | $112,691 | $113,818 | $114,956 | $116,106 | $117,267 | $118,440 | $119,624 | $120,821 | $122,028 | $123,249 | |
| Subtotal Cash from Operations | $110,471 | $111,576 | $112,691 | $113,818 | $114,956 | $116,106 | $117,267 | $118,440 | $119,624 | $120,821 | $122,028 | $123,249 | |
| Cash from Operations | |||||||||||||
| Cash Sales | $110,471 | $111,576 | $112,691 | $113,818 | $114,956 | $116,106 | $117,267 | $118,440 | $119,624 | $120,821 | $122,028 | $123,249 | |
| Additional Cash Received | |||||||||||||
| Sales Tax, VAT, HST/GST Received | 0.00% | $0 | $0 | $0 | $0 | $0 | $0 | $0 | $0 | $0 | $0 | $0 | |
| New Current Borrowing | $0 | $0 | $0 | $0 | $0 | $0 | $0 | $0 | $0 | $0 | $0 | $0 | |
| New Other Liabilities (interest-free) | $0 | $0 | $0 | $0 | $0 | $0 | $0 | $0 | $0 | $0 | $0 | $0 | |
| New Long-term Liabilities | $0 | $0 | $0 | $0 | $0 | $0 | $0 | $0 | $0 | $0 | $0 | $0 | |
| Sales of Other Current Assets | $0 | $0 | $0 | $0 | $0 | $0 | $0 | $0 | $0 | $0 | $0 | $0 | |
| Sales of Long-term Assets | $0 | $0 | $0 | $0 | $0 | $0 | $0 | $0 | $0 | $0 | $0 | $0 | |
| New Investment Received | $0 | $0 | $0 | $0 | $0 | $0 | $0 | $0 | $0 | $0 | $0 | $0 | |
| Subtotal Cash Received | $110,471 | $111,576 | $112,691 | $113,818 | $114,956 | $116,106 | $117,267 | $118,440 | $119,624 | $120,821 | $122,028 | $123,249 | |
| Expenditures | |||||||||||||
| Month 1 | Month 2 | Month 3 | Month 4 | Month 5 | Month 6 | Month 7 | Month 8 | Month 9 | Month 10 | Month 11 | Month 12 | ||
| Expenditures from Operations | |||||||||||||
| Cash Spending | $13,200 | $13,200 | $13,200 | $13,200 | $13,200 | $13,200 | $13,200 | $13,200 | $13,200 | $13,200 | $13,200 | $13,200 | |
| Bill Payments | $33,289 | $97,911 | $75,804 | $76,533 | $77,269 | $78,012 | $78,764 | $79,523 | $80,290 | $81,063 | $81,846 | $82,635 | |
| Subtotal Spent on Operations | $46,489 | $111,111 | $89,004 | $89,733 | $90,469 | $91,212 | $91,964 | $92,723 | $93,490 | $94,263 | $95,046 | $95,835 | |
| Additional Cash Spent | |||||||||||||
| Sales Tax, VAT, HST/GST Paid Out | $0 | $0 | $0 | $0 | $0 | $0 | $0 | $0 | $0 | $0 | $0 | $0 | |
| Principal Repayment of Current Borrowing | $1,000 | $1,000 | $1,000 | $1,000 | $1,000 | $1,000 | $1,000 | $1,000 | $1,000 | $1,000 | $1,000 | $1,000 | |
| Other Liabilities Principal Repayment | $1,332 | $1,332 | $1,332 | $1,332 | $1,332 | $1,332 | $1,332 | $1,332 | $1,332 | $1,332 | $1,332 | $1,328 | |
| Long-term Liabilities Principal Repayment | $1,667 | $1,667 | $1,667 | $1,667 | $1,667 | $1,667 | $1,667 | $1,667 | $1,667 | $1,667 | $1,667 | $1,667 | |
| Purchase Other Current Assets | $0 | $0 | $0 | $0 | $0 | $0 | $0 | $0 | $0 | $0 | $0 | $0 | |
| Purchase Long-term Assets | $35,000 | $0 | $0 | $0 | $0 | $0 | $0 | $0 | $0 | $0 | $0 | $0 | |
| Dividends | $1,000 | $1,000 | $15,000 | $15,000 | $15,000 | $15,000 | $15,000 | $25,000 | $25,000 | $25,000 | $25,000 | $25,000 | |
| Subtotal Cash Spent | $86,488 | $116,110 | $108,003 | $108,732 | $109,468 | $110,211 | $110,963 | $121,722 | $122,489 | $123,262 | $124,045 | $124,830 | |
| Net Cash Flow | |||||||||||||
Hello!
I’m Andrew Brooks, a seasoned finance consultant from the USA and the mind behind phonenumber247.com.
My career is built on a foundation of helping individuals and businesses thrive financially in an ever-changing economic landscape. At phonenumber247.com, my aim is to demystify the complex world of finance, providing clear, actionable advice that can help you navigate your financial journey with confidence. Whether it’s personal finance management, investment strategies, or understanding the nuances of market dynamics, I’m here to share insights and tools that can propel you towards your financial goals.
Welcome to my digital space, where every piece of advice is a step closer to financial clarity and success!
