Electronics Repair Shop Business Plan
Tucson is a start-up business located in the West end of Tucson, Arizona. The company specializes in repairing and selling home entertainment electronics, such as TV, DVDs, VCRs, and CD players.
We will target individuals who value their entertainment equipment and own higher-end electronics, where repairing them would be more cost-effective than replacing. Many low-end VCRs, for example, are priced so low that it is more practical and convenient to purchase a new product than to repair the existing one.
The company is owned and managed by James Munroe, a retired Navy Commander with an electrical engineering degree from the University of Texas-Austin. He is a certified electronics technician with various brand companies. He will also employ his son to assist with running and growing the business.
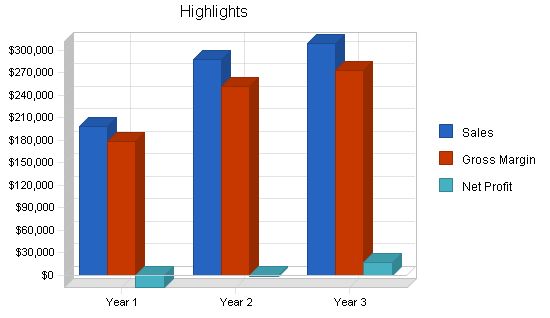
Tucson Electronics (TE) is a growth-oriented business with a ten-year goal of becoming a regional leader in TV/VCR/home stereo repair, with shops in the Tucson and Phoenix area. The objectives over the next three years for Tucson Electronics are to achieve steady growth in sales revenues by year three, achieve a local market share of approximately 20% in the Tucson area by year five, and expand the product line to include authorized satellite service installation and new home entertainment electronics sales.
The mission of Tucson Electronics is to provide high quality, convenient, and comprehensive TV/DVD/VCR and home electronics repair at a low cost. The most important aspect of our business is trust. Our goal is to have 100% customer satisfaction in regards to quality, friendliness, and time to completion while exceeding customer expectations at the lowest possible cost.
The keys to success for Tucson Electronics are high-quality work, attention to professional appearances, knowledgeable technicians who are friendly and customer-oriented, and maintaining a highly aggressive managerial oversight on costs to provide services at the lowest price.
Tucson Electronics is envisioned to be the low-cost leader in TV/DVD/VCR and home stereo repair for the Tucson area. The company will also provide satellite TV installation/servicing and new electronics sales, making it the local leader in comprehensive electronic sales/services. The company will be a sole proprietorship owned by Mr. James Munroe, located at 530 W. Prince Ave. The facilities will include a sales area, repair room, office space, and storage for parts and equipment. The company is seeking a loan to finance the start of operations.
The start-up funding for Tucson Electronics includes start-up expenses of $26,300 and start-up assets of $51,200, totaling $77,500. The assets include non-cash assets from start-up of $15,000, cash requirements from start-up of $36,200, and additional cash raised of $0. The total liabilities are $29,000, including long-term liabilities of $15,400 and other current liabilities of $13,600. The planned investment from James Munroe and Janet Munroe is $48,500, resulting in a total capital of $22,200. The total capital and liabilities equal $51,200, which is the total funding required.
Tucson Electronics offers a wide range of services, including repair and cleaning of home and car stereos and CB radios, TVs, VCRs, and DVDs. The company also sells used TVs, stereos, VCRs, and DVDs, provides free estimates on repair jobs, offers authorized warranty servicing on all major brands of home entertainment systems, and provides house calls and free pickup and delivery. Future products and services include TV/VCR/DVD rental, satellite TV installation and servicing, sales of new TVs, DVDs, VCRs, and stereos, and repair/sale of microwave ovens.
Tucson Electronics will source its parts through established dealers and directly through manufacturers to take advantage of volume discounts. The company will also procure parts from local suppliers to form strategic partnerships and lower overall costs. Free pickup and delivery services will be provided through a partnership with Caesar Courier Services.
Tucson Electronics will remain on the cutting edge by using computer diagnostic equipment in its shop and seeking new ways to provide a better service through technology. The company will pursue a low-cost leadership strategy as its competitive advantage and expand its product and service line to create higher switching costs.
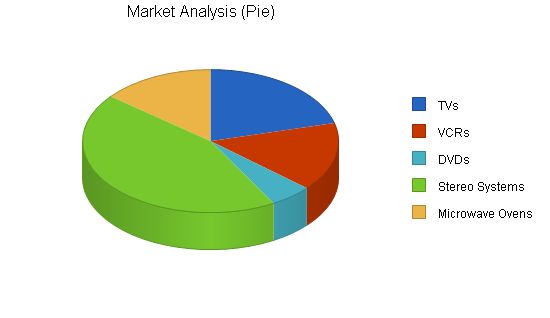
The market analysis for Tucson Electronics shows that there are approximately 332,500 households in the greater Tucson area. The company segments the market into product categories based on the estimated number of each electronic device in use and the growth rate of each product. The target segments include middle-class couples without children, single men living alone or with roommates, and baby boomers.
In conclusion, Tucson Electronics aims to achieve its objectives of becoming a regional leader in TV/VCR/home stereo repair by providing high-quality, convenient, and comprehensive services at a low cost. The company will focus on customer satisfaction, professionalism, and cost efficiency to differentiate itself in the highly competitive electronics repair industry.
Market Analysis
Year 1 Year 2 Year 3 Year 4 Year 5
Potential Customers Growth CAGR
TVs 3% 415,875 428,351 441,202 454,438 468,071 3.00%
VCRs -2% 310,645 304,432 298,343 292,376 286,528 -2.00%
DVDs 25% 106,400 133,000 166,250 207,813 259,766 25.00%
Stereo Systems 12% 875,500 980,560 1,098,227 1,230,014 1,377,616 12.00%
Microwave Ovens 8% 282,625 305,235 329,654 356,026 384,508 8.00%
Total 8.67% 1,991,045 2,151,578 2,333,676 2,540,667 2,776,489 8.67%
4.1.1 Market Trends
The market demand for electronics repair has been stable over the past decade. The increasing popularity of DVD players has created a need for highly trained technicians. As technology continues to advance, new opportunities for electronics repair are expected to arise, especially in the field of cellular telephones, PDAs, and other emerging electronics.
4.2 Service Business Analysis
The electronics repair industry is highly competitive, with firms having little power to influence market forces or prices. In a purely competitive environment like this, Tucson Electronics can provide repair services at maximum capacity without affecting prices or demand. To achieve a low cost leadership position, the company will focus on reducing costs and improving efficiency. Mrs. Munroe, who works in cost analysis for Wal-Mart, will provide cost analysis services to Tucson Electronics for free. The company will initially target the local Tucson region and gradually expand to compete with larger regional firms.
4.2.1 Competition and Buying Patterns
Customers in this industry make service purchases based on effective advertising and reputation. They seek prompt and reliable service from understanding representatives. Maintaining a positive image and providing an excellent service experience is crucial for customer retention and word-of-mouth marketing. Tucson Electronics aims to capitalize on the weaknesses of smaller, passive promotional efforts like Yellow Page ads by implementing effective and widespread advertising strategies.
4.2.2 Business Participants
The electronic repair industry is highly fragmented, with approximately 23,700 repair firms nationwide. Tucson Electronics will mainly compete against eight local "mom and pop" repair firms. The company’s goal is to outprice these local competitors and acquire their market share before competing with larger regional firms.
Strategy and Implementation Summary
Tucson Electronics has a strong marketing program that includes flyers, direct mailers, discounts, newspaper ads, Yellow Pages, referrals, radio ads, billboards, and web banners on local information sites. The company aims to send its message directly to customers and increase service awareness, value creation, competitive pricing, availability, and provide an attractive service experience. The estimated aggregate market share is approximately 16% by year four.
5.1.1 Pricing Strategy
Tucson Electronics operates in a purely competitive environment and must be a price taker. The company seeks to charge market prices or lower. Research suggests that the average price for electronic device repair is around $75. As long as costs do not exceed revenues, servicing electronic devices at maximum capacity will maximize short-run profits, resulting in an estimated long-term ROA of approximately 14%.
5.1.2 Promotion Strategy
The company’s promotion strategy includes flyers, direct mailers, price discounts, billboards, radio ads, newspaper ads, and Yellow Pages. Significant marketing expenditures are expected in the first two years to build awareness and customer value.
5.2 Competitive Edge
Tucson Electronics differentiates itself by providing quality and fast electronic repair at a lower cost than its local competitors. This approach provides flexibility in coping with increasing costs, ensures profitability during economic downturns, and differentiates the company from its competitors.
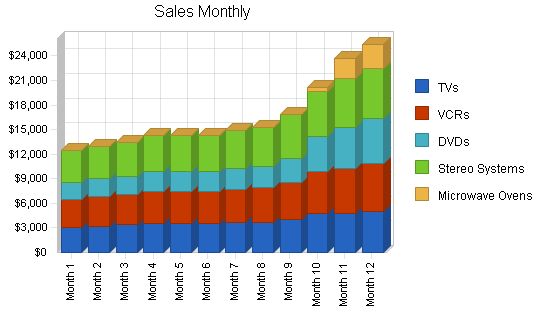
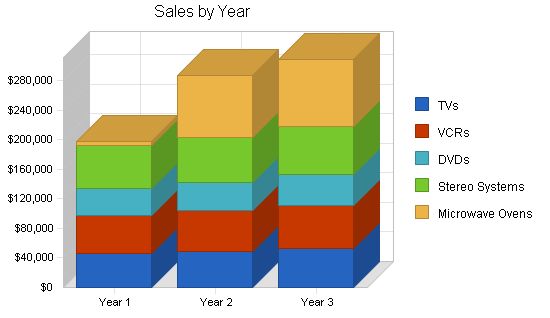
Due to the job-shop nature of the electronic repair industry, estimating sales is challenging. The forecast is based on the estimated number of electronics currently in homes in Tucson, assuming a 3% failure rate per year. With aggressive marketing efforts, a 10% market share is projected by year three. This number is then multiplied by the estimated price per unit to calculate yearly sales figures. Revise numbers for the first two years to account for initial revenue.
Sales Forecast
| Sales Forecast | |||
| Year 1 | Year 2 | Year 3 | |
| TVs | $46,250 | $49,025 | $52,604 |
| VCRs | $51,600 | $54,696 | $58,689 |
| DVDs | $36,500 | $38,690 | $41,514 |
| Stereo Systems | $57,700 | $61,162 | $65,627 |
| Microwave Ovens | $5,900 | $84,000 | $90,132 |
| Total Sales | $197,950 | $287,573 | $308,566 |
Management Summary
Mr. James Munroe, a retired Navy Commander with an electrical engineering degree from the University of Texas-Austin, gained extensive experience in project management, engineering, and electronics systems during his naval career. He also became a certified electronics technician with various brand companies during his leisure time. Now, Mr. Munroe aims to leverage his experience into a growth-oriented business that can eventually compete with industry giants.
Mr. Munroe’s son, Samuel, will also be involved in the business. Samuel is currently attending a local trade school and is expected to graduate with an electronics degree in the summer of 2002.
7.1 Personnel Plan
Tucson Electronics will initially have Mr. Munroe, his son, and two part-time technician trainees on staff. Accounting, bookkeeping, and marketing consulting services will be outsourced. The company’s intermediate goal is to have four full-time, fully trained technicians and a full-time office manager at the original facility. However, management will determine the best time to bring on such personnel based on future developments.
| Personnel Plan | |||
| Year 1 | Year 2 | Year 3 | |
| Mr. James Munroe | $36,000 | $36,000 | $36,000 |
| Mr. Samuel Munroe | $24,000 | $28,000 | $32,000 |
| Part-time technician | $14,400 | $28,000 | $28,000 |
| Part-time technician | $14,400 | $28,000 | $28,000 |
| Part-time technician | $0 | $15,000 | $15,000 |
| Total People | 4 | 5 | 5 |
| Total Payroll | $88,800 | $135,000 | $139,000 |
The following sections outline the financial plan for Tucson Electronics.
| General Assumptions | |||
| Year 1 | Year 2 | Year 3 | |
| Plan Month | 1 | 2 | 3 |
| Current Interest Rate | 10.00% | 10.00% | 10.00% |
| Long-term Interest Rate | 10.00% | 10.00% | 10.00% |
| Tax Rate | 30.00% | 30.00% | 30.00% |
| Other | 0 | 0 | 0 |
8.1 Break-even Analysis
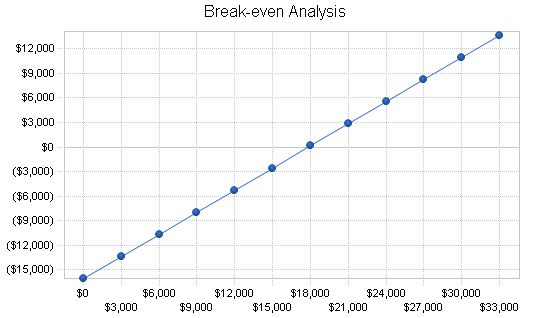
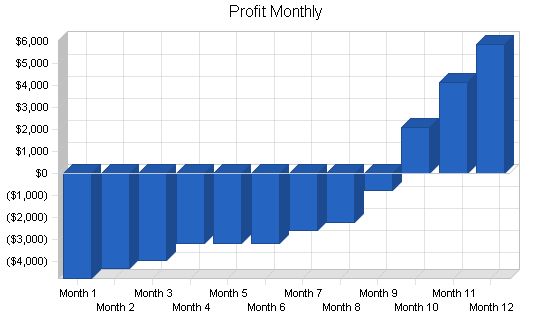
The company’s break-even analysis is based on average running costs in the industry, including payroll and fixed costs like rent and utilities. As Tucson Electronics operates as a job-shop, each task is unique and customized, making it difficult to estimate revenue per unit and variable costs. It’s important to note the high degree of variance within these estimates. The company is not expected to reach its break-even point until the last three months of the first year’s sales.
Break-even Analysis
Monthly Revenue Break-even: $17,844
Assumptions:
– Average Percent Variable Cost: 10%
– Estimated Monthly Fixed Cost: $16,059
Projected Profit and Loss:
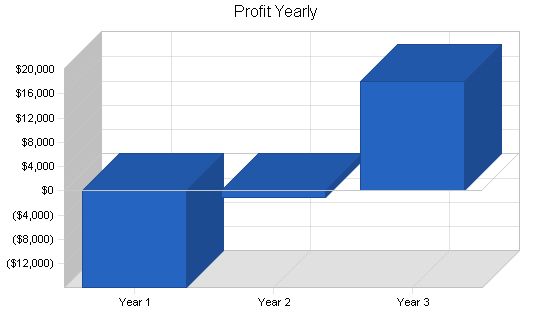
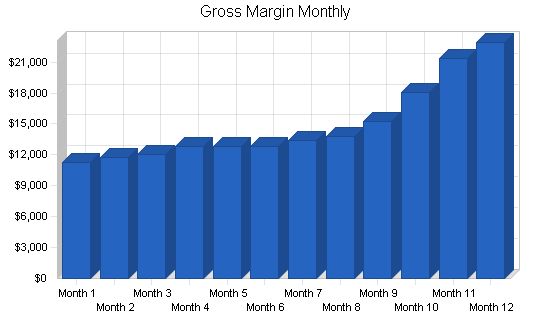
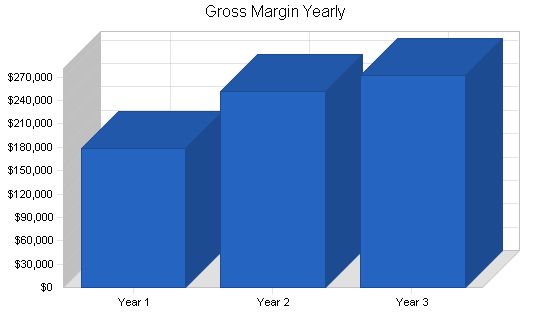
The table and charts below show the projected profit and loss for Tucson Electronics.
Pro Forma Profit and Loss
Year 1 Year 2 Year 3
Sales $197,950 $287,573 $308,566
Direct Cost of Sales $19,795 $36,000 $36,000
Other Production Expenses $0 $0 $0
Total Cost of Sales $19,795 $36,000 $36,000
Gross Margin $178,155 $251,573 $272,566
Gross Margin % 90.00% 87.48% 88.33%
Expenses
Payroll $88,800 $135,000 $139,000
Sales and Marketing and Other Expenses $28,600 $36,000 $26,000
Depreciation $1,992 $2,000 $2,000
Leased Equipment $6,000 $2,000 $2,000
Utilities $4,800 $5,000 $5,000
Insurance $7,200 $7,400 $7,400
Rent $42,000 $44,000 $44,000
Payroll Taxes $13,320 $20,250 $20,850
Other $0 $0 $0
Total Operating Expenses $192,712 $251,650 $246,250
Profit Before Interest and Taxes ($14,557) ($77) $26,316
EBITDA ($12,565) $1,923 $28,316
Interest Expense $1,370 $1,000 $640
Taxes Incurred $0 $0 $7,703
Net Profit ($15,927) ($1,077) $17,973
Net Profit/Sales -8.05% -0.37% 5.82%
8.3 Projected Cash Flow
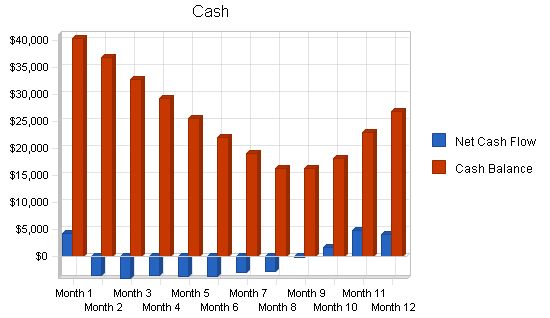
The following chart and table depict the projected cash flow for Tucson Electronics.
Pro Forma Cash Flow:
| Pro Forma Cash Flow | |||
| Cash Received | Year 1 | Year 2 | Year 3 |
| Cash From Operations | $197,950 | $287,573 | $308,566 |
| Cash Sales | $197,950 | $287,573 | $308,566 |
| Subtotal Cash From Operations | $197,950 | $287,573 | $308,566 |
| Additional Cash Received | |||
| Sales Tax, VAT, HST/GST Received | $0 | $0 | $0 |
| New Current Borrowing | $1,000 | $0 | $0 |
| New Other Liabilities (interest-free) | $0 | $0 | $0 |
| New Long-term Liabilities | $0 | $0 | $0 |
| Sales of Other Current Assets | $0 | $0 | $0 |
| Sales of Long-term Assets | $0 | $0 | $0 |
| New Investment Received | $0 | $3,000 | $0 |
| Subtotal Cash Received | $198,950 | $290,573 | $308,566 |
| Expenditures | Year 1 | Year 2 | Year 3 |
| Expenditures from Operations | |||
| Cash Spending | $88,800 | $135,000 | $139,000 |
| Bill Payments | $111,148 | $153,016 | $149,950 |
| Subtotal Spent on Operations | $199,948 | $288,016 | $288,950 |
| Additional Cash Spent | |||
| Sales Tax, VAT, HST/GST Paid Out | $0 | $0 | $0 |
| Principal Repayment of Current Borrowing | $1,000 | $0 | $0 |
| Other Liabilities Principal Repayment | $3,600 | $3,600 | $3,600 |
| Long-term Liabilities Principal Repayment | $3,600 | $3,600 | $3,600 |
| Purchase Other Current Assets | $0 | $2,000 | $3,000 |
| Purchase Long-term Assets | $0 | $5,000 | $5,000 |
| Dividends | $0 | $0 | $0 |
| Subtotal Cash Spent | $208,148 | $302,216 | $304,150 |
| Net Cash Flow | ($9,198) | ($11,643) | $4,416 |
| Cash Balance | $27,002 | $15,359 | $19,775 |
Projected Balance Sheet:
Projected Balance Sheet
The following table is the projected balance sheet for Tucson Electronics.
| Pro Forma Balance Sheet | |||
| Assets | Year 1 | Year 2 | Year 3 |
| Current Assets | |||
| Cash | $27,002 | $15,359 | $19,775 |
| Inventory | $2,794 | $5,081 | $5,081 |
| Other Current Assets | $8,000 | $10,000 | $13,000 |
| Total Current Assets | $37,796 | $30,440 | $37,856 |
| Long-term Assets | |||
| Long-term Assets | $4,000 | $9,000 | $14,000 |
| Accumulated Depreciation | $1,992 | $3,992 | $5,992 |
| Total Long-term Assets | $2,008 | $5,008 | $8,008 |
| Total Assets | $39,804 | $35,448 | $45,864 |
| Liabilities and Capital | Year 1 | Year 2 | Year 3 |
| Current Liabilities | |||
| Accounts Payable | $11,731 | $12,652 | $12,295 |
| Current Borrowing | $0 | $0 | $0 |
| Other Current Liabilities | $10,000 | $6,400 | $2,800 |
| Subtotal Current Liabilities | $21,731 | $19,052 | $15,095 |
| Long-term Liabilities | $11,800 | $8,200 | $4,600 |
| Total Liabilities | $33,531 | $27,252 | $19,695 |
| Paid-in Capital | $48,500 | $51,500 | $51,500 |
| Retained Earnings | ($26,300) | ($42,227) | ($43,304) |
| Earnings | ($15,927) | ($1,077) | $17,973 |
| Total Capital | $6,273 | $8,196 | $26,169 |
| Total Liabilities and Capital | $39,804 | $35,448 | $45,864 |
| Net Worth | $6,273 | $8,196 | $26,169 |
Business Ratios
The business ratios provide an overview of the profitability and risk level at which Tucson Electronics will operate. The table includes time series and cross-sectional analysis by comparing industry average ratios. The industry profile ratios are based on the Standard Industrial Classification (SIC) code 7622, Radio and Television Repair. There are some differences between the industry standards and Tucson Electronics’ ratios, mainly due to variations in company size. It is important to note the variability between the different years, as the company is expected to experience growth and fluctuating profitability in the initial years.
Overall, the company’s projections indicate that it faces typical risks in the industry and will be profitable in the long run. The higher advertising and start-up costs compared to competitors are a deliberate strategy to create a safety net in case of difficulties. Pre-tax return on net worth and pre-tax return on assets are particularly high in the first two years due to the expected revenue and cost variability.
| Ratio Analysis | |||||||||||||
| Sales Growth | 0.00% | 45.28% | 7.30% | 6.10% | |||||||||
| Percent of Total Assets | |||||||||||||
| Inventory | 7.02% | 14.33% | 11.08% | 19.00% | |||||||||
| Other Current Assets | 20.10% | 28.21% | 28.34% | 27.50% | |||||||||
| Total Current Assets | 94.96% | 85.87% | 82.54% | 76.90% | |||||||||
| Long-term Assets | Personnel Plan | ||||||||||||
| Mr. James Munroe | 0% | $3,000 | $3,000 | $3,000 | $3,000 | $3,000 | $3,000 | $3,000 | $3,000 | $3,000 | $3,000 | $3,000 | $3,000 |
| Mr. Samuel Munroe | 0% | $2,000 | $2,000 | $2,000 | $2,000 | $2,000 | $2,000 | $2,000 | $2,000 | $2,000 | $2,000 | $2,000 | $2,000 |
| Part-time technician | 0% | $1,200 | $1,200 | $1,200 | $1,200 | $1,200 | $1,200 | $1,200 | $1,200 | $1,200 | $1,200 | $1,200 | $1,200 |
| Part-time technician | 0% | $1,200 | $1,200 | $1,200 | $1,200 | $1,200 | $1,200 | $1,200 | $1,200 | $1,200 | $1,200 | $1,200 | $1,200 |
| Part-time technician | 0% | $0 | $0 | $0 | $0 | $0 | $0 | $0 | $0 | $0 | $0 | $0 | $0 |
| Total People | 4 | 4 | 4 | 4 | 4 | 4 | 4 | 4 | 4 | 4 | 4 | 4 | |
| Total Payroll | $7,400 | $7,400 | $7,400 | $7,400 | $7,400 | $7,400 | $7,400 | $7,400 | $7,400 | $7,400 | $7,400 | $7,400 | |
| General Assumptions | |||||||||||||
| Plan Month | 1 | 2 | 3 | 4 | 5 | 6 | 7 | 8 | 9 | 10 | 11 | 12 | |
| Current Interest Rate | 10.00% | 10.00% | 10.00% | 10.00% | 10.00% | 10.00% | 10.00% | 10.00% | 10.00% | 10.00% | 10.00% | 10.00% | |
| Long-term Interest Rate | 10.00% | 10.00% | 10.00% | 10.00% | 10.00% | 10.00% | 10.00% | 10.00% | 10.00% | 10.00% | 10.00% | 10.00% | |
| Tax Rate | 30.00% | 30.00% | 30.00% | 30.00% | 30.00% | 30.00% | 30.00% | 30.00% | 30.00% | 30.00% | 30.00% | 30.00% | |
| Other | 0 | 0 | 0 | 0 | 0 | 0 | 0 | 0 | 0 | 0 | 0 | 0 | |
| Pro Forma Profit and Loss | |||||||||||||
| Sales | $12,500 | $13,000 | $13,400 | $14,250 | $14,250 | $14,250 | $14,900 | $15,300 | $16,900 | $20,100 | $23,700 | $25,400 | |
| Direct Cost of Sales | $1,250 | $1,300 | $1,340 | $1,425 | $1,425 | $1,425 | $1,490 | $1,530 | $1,690 | $2,010 | $2,370 | $2,540 | |
| Other Production Expenses | $0 | $0 | $0 | $0 | $0 | $0 | $0 | $0 | $0 | $0 | $0 | $0 | |
| Total Cost of Sales | $1,250 | $1,300 | $1,340 | $1,425 | $1,425 | $1,425 | $1,490 | $1,530 | $1,690 | $2,010 | $2,370 | $2,540 | |
| Gross Margin | $11,250 | $11,700 | $12,060 | $12,825 | $12,825 | $12,825 | $13,410 | $13,770 | $15,210 | $18,090 | $21,330 | $22,860 | |
| Gross Margin % | 90.00% | 90.00% | 90.00% | 90.00% | 90.00% | 90.00% | 90.00% | 90.00% | 90.00% | 90.00% | 90.00% | 90.00% | |
| Expenses | |||||||||||||
| Payroll | $7,400 | $7,400 | $7,400 | $7,400 | $7,400 | $7,400 | $7,400 | $7,400 | $7,400 | $7,400 | $7,400 | $7,400 | |
| Sales and Marketing and Other Expenses | $2,200 | $2,200 | $2,200 | $2,200 | $2,200 | $2,200 | $2,200 | $2,200 | $2,200 | $3,400 | $3,200 | ||
| Depreciation | $166 | $166 | $166 | $166 | $166 | $166 | $166 | $166 | $166 | $166 | $166 | $166 | |
| Leased Equipment | $500 | $500 | $500 | $500 | $500 | $500 | $500 | $500 | $500 | $500 | $500 | $500 | |
| Utilities | $400 | $400 | $400 | $400 | $400 | $400 | $400 | $400 | $400 | $400 | $400 | $400 | |
| Insurance | $600 | $600 | $600 | $600 | $600 | $600 | $600 | $600 | $600 | $600 | $600 | $600 | |
| Rent | $3,500 | $3,500 | $3,500 | $3,500 | $3,500 | $3,500 | $3,500 | $3,500 | $3,500 | $3,500 | $3,500 | $3,500 | |
| Payroll Taxes | 15% | $1,110 | $1,110 | $1,110 | $1,110 | $1,110 | $1,110 | $1,110 | $1,110 | $1,110 | $1,110 | $1,110 | $1,110 |
| Other | $0 | $0 | $0 | $0 | $0 | $0 | $0 | $0 | $0 | $0 | $0 | $0 | |
| Total Operating Expenses | $15,876 | $15,876 | $15,876 | $15,876 | $15,876 | $15,876 | $15,876 | $15,876 | $15,876 | $17,076 | $16,876 | ||
| Pro Forma Cash Flow | |||||||||||||
| Month 1 | Month 2 | Month 3 | Month 4 | Month 5 | Month 6 | Month 7 | Month 8 | Month 9 | Month 10 | Month 11 | Month 12 | ||
| Cash Sales | $12,500 | $13,000 | $13,400 | $14,250 | $14,250 | $14,250 | $14,900 | $15,300 | $16,900 | $20,100 | $23,700 | $25,400 | |
| Subtotal Cash from Operations | $12,500 | $13,000 | $13,400 | $14,250 | $14,250 | $14,250 | $14,900 | $15,300 | $16,900 | $20,100 | $23,700 | $25,400 | |
| Sales Tax, VAT, HST/GST Received | 0.00% | $0 | $0 | $0 | $0 | $0 | $0 | $0 | $0 | $0 | $0 | $0 | |
| New Current Borrowing | $0 | $0 | $0 | $0 | $0 | $0 | $0 | $0 | $1,000 | $0 | $0 | $0 | |
| New Other Liabilities (interest-free) | $0 | $0 | $0 | $0 | $0 | $0 | $0 | $0 | $0 | $0 | $0 | $0 | |
| New Long-term Liabilities | $0 | $0 | $0 | $0 | $0 | $0 | $0 | $0 | $0 | $0 | $0 | $0 | |
| Sales of Other Current Assets | $0 | $0 | $0 | $0 | $0 | $0 | $0 | $0 | $0 | $0 | $0 | $0 | |
| Sales of Long-term Assets | $0 | $0 | $0 | $0 | $0 | $0 | $0 | $0 | $0 | $0 | $0 | $0 | |
| New Investment Received | $0 | $0 | $0 | $0 | $0 | $0 | $0 | $0 | $0 | $0 | $0 | $0 | |
| Subtotal Cash Received | $12,500 | $13,000 | $13,400 | $14,250 | $14,250 | $14,250 | $14,900 | $15,300 | $17,900 | $20,100 | $23,700 | $25,400 | |
Pro Forma Balance Sheet
| Pro Forma Balance Sheet | |||||||||||||
| Month 1 | Month 2 | Month 3 | Month 4 | Month 5 | Month 6 | Month 7 | Month 8 | Month 9 | Month 10 | Month 11 | Month 12 | ||
| Assets | |||||||||||||
| Current Assets | |||||||||||||
| Cash | $40,419 | $36,950 | $32,904 | $29,354 | $25,661 | $22,060 | $19,107 | $16,425 | $16,322 | $18,116 | $22,979 | $27,002 | |
| Inventory | $3,000 | $1,750 | $1,450 | $1,474 | $1,568 | $1,568 | $1,568 | $1,639 | $1,683 | $1,859 | $2,211 | $2,607 | $2,794 |
| Other Current Assets | $8,000 | $8,000 | $8,000 | $8,000 | $8,000 | $8,000 | $8,000 | $8,000 | $8,000 | $8,000 | $8,000 | $8,000 | $8,000 |
| Total Current Assets | $47,200 | $50,169 | $46,400 | $42,378 | $38,922 | $35,228 | $31,628 | $28,746 | $26,108 | $26,181 | $28,327 | $33,586 | $37,796 |
| Long-term Assets | |||||||||||||
| Long-term Assets | $4,000 | $3,834 | $3,668 | $3,502 | $3,336 | $3,170 | $3,004 | $2,838 | $2,672 | $2,506 | $2,340 | $2,174 | $2,008 |
| Total Assets | $51,200 | $54,003 | $50,068 | $45,880 | $42,258 | $38,398 | $34,632 | $31,584 | $28,780 | $28,687 | $30,667 | $35,760 | $39,804 |
| Liabilities and Capital | |||||||||||||
| Current Liabilities | |||||||||||||
| Accounts Payable | $0 | $8,155 | $9,119 | $9,468 | $9,615 | $9,522 | $9,520 | $9,650 | $9,659 | $9,947 | $10,424 | $11,972 | $11,731 |
| Current Borrowing | $0 | $0 | $0 | $0 | $0 | $0 | $0 | $0 | $0 | $1,000 | $1,000 | $1,000 | $0 |
| Other Current Liabilities | $13,600 | $13,300 | $13,000 | $12,700 | $12,400 | $12,100 | $11,800 | $11,500 | $11,200 | $10,900 | $10,600 | $10,300 | $10,000 |
| Subtotal Current Liabilities | $13,600 | $21,455 | $22,119 | $22,168 | $22,015 | $21,622 | $21,320 | $21,150 | $20,859 | $21,847 | $22,024 | $23,272 | $21,731 |
| Long-term Liabilities | $15,400 | $15,100 | $14,800 | $14,500 | $14,200 | $13,900 | $13,600 | $13,300 | $13,000 | $12,700 | $12,400 | $12,100 | $11,800 |
| Total Liabilities | $29,000 | $36,555 | $36,919 | $36,668 | |||||||||
Hello!
I’m Andrew Brooks, a seasoned finance consultant from the USA and the mind behind phonenumber247.com.
My career is built on a foundation of helping individuals and businesses thrive financially in an ever-changing economic landscape. At phonenumber247.com, my aim is to demystify the complex world of finance, providing clear, actionable advice that can help you navigate your financial journey with confidence. Whether it’s personal finance management, investment strategies, or understanding the nuances of market dynamics, I’m here to share insights and tools that can propel you towards your financial goals.
Welcome to my digital space, where every piece of advice is a step closer to financial clarity and success!
