Pottery Studio Business Plan
The Pottery Table is a new 44-seat paint-it-yourself pottery studio in Monroe. It’s a fun and easy place to have a party or create a one-of-a-kind gift.
The store staff provides pre-fired pottery, supplies, and a clean, cozy, and relaxing place to put it all together. They also offer idea books and helpful staff to get the "artist" started. Customers provide the inspiration to create unique gifts with a warm and personal touch, such as a mug with a child’s handprint, a custom photo frame, or a bowl for a canine companion.
Customers can even create items to match home decor with unmatched creative flexibility and color choice. The Pottery Table supplies everything needed for the process, including:
- Hundreds of pre-fired pottery choices.
- A wide selection of non-toxic glazes.
- All necessary brushes, sponges, and supplies.
When the artist finishes their work, a clear glaze will be applied and the pottery will be re-fired. Customers can pick up their finished pieces in about a week. The pottery is food and dishwasher safe.
Janet Miller, the owner of The Pottery Table, has over ten years of experience as a pottery instructor. She has taught hundreds of children and adults the joy of creating unique pottery, including leading classes through the city’s recreation program.
The objectives of The Pottery Table are to achieve 80% class capacity in the studio within the first year, create successful pre-school, new mother’s, and seniors pottery programs.
The mission of The Pottery Table is to provide customers with a great creative environment to design and create their unique pottery.
The Pottery Table is a new 44-seat paint-it-yourself pottery studio located in Monroe. It is organized as a limited partnership, with Janet Miller operating the business and the silent partner handling limited accounting responsibilities.
The studio is situated in the Grand Avenue Shopping Center, which also houses other retail stores, coffee shops, and restaurants, providing ample shared parking.
Janet Miller and a silent partner are the owners of The Pottery Table.
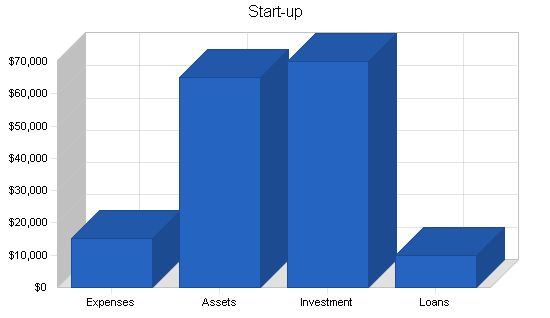
The start-up cost of The Pottery Table will mainly cover firing equipment and studio set up. Janet Miller and a silent partner will contribute equally, and Janet will secure a long-term loan.
Start-up
Requirements
Start-up Expenses
Legal – $500
Stationery etc. – $200
Brochures – $200
Insurance – $500
Rent – $700
Studio Setup – $13,000
Total Start-up Expenses – $15,100
Start-up Assets
Cash Required – $13,900
Start-up Inventory – $7,000
Other Current Assets – $0
Long-term Assets – $44,000
Total Assets – $64,900
Total Requirements – $80,000
Start-up Funding
Start-up Expenses to Fund – $15,100
Start-up Assets to Fund – $64,900
Total Funding Required – $80,000
Assets
Non-cash Assets from Start-up – $51,000
Cash Requirements from Start-up – $13,900
Additional Cash Raised – $0
Cash Balance on Starting Date – $13,900
Total Assets – $64,900
Liabilities and Capital
Liabilities
Current Borrowing – $0
Long-term Liabilities – $10,000
Accounts Payable (Outstanding Bills) – $0
Other Current Liabilities (interest-free) – $0
Total Liabilities – $10,000
Capital
Planned Investment
Janet Miller – $30,000
Silent Partner – $40,000
Additional Investment Requirement – $0
Total Planned Investment – $70,000
Loss at Start-up (Start-up Expenses) – ($15,100)
Total Capital – $54,900
Total Capital and Liabilities – $64,900
Total Funding – $80,000
Products and Services
The Pottery Table offers the following products and services:
– Instruction on painting and placing designs on pottery. Classes are $50 per person.
– Hundreds of pre-fired pottery choices. Starting at $5 and up.
– A huge selection of non-toxic glazes.
– All the brushes, sponges, and supplies needed.
– Unlimited studio time at $10 a session.
– Special gift basket pottery, ranging from $30- $70.
– Sale of pottery tools and accessories.
Market Analysis Summary
The city of Monroe has a population of 120,000 residents. Over the past four years, there has been significant growth in participation in the city’s park arts program.
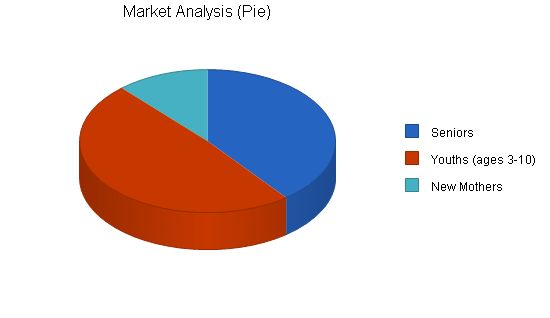
The groups that have been most supportive of the program are youths and seniors. Approximately 20% (24,000) of the population are active seniors who participate in numerous programs around the city. Youths, under the age of ten, represent 35% of the city’s population.
Recently, due to budget cuts, the arts program has been discontinued. The Pottery Table is positioned to attract the patrons of the discontinued arts program. The Pottery Table will establish programs specifically targeting seniors, young children, and new mothers.
4.1 Market Segmentation
The Pottery Table will focus on three customer groups:
– Seniors
– Youth (ages 3 – 10)
– New mothers.
Market Analysis:
Year 1 Year 2 Year 3 Year 4 Year 5
Potential Customers: Growth CAGR
Seniors: 12% 34,000 38,080 42,650 47,768 53,500 12.00%
Youths (ages 3-10): 10% 42,000 46,200 50,820 55,902 61,492 10.00%
New Mothers: 5% 10,000 10,500 11,025 11,576 12,155 5.00%
Total: 10.27% 86,000 94,780 104,495 115,246 127,147 10.27%
4.2 Target Market Segment Strategy:
The target market strategy for The Pottery Table:
– Seniors: This group is important for morning and early afternoon studio time. They are active members of senior organizations and clubs. The Pottery Table can market directly to attract seniors.
– Youth (ages 3 – 10): The Pottery Table will focus on bringing in pre-schoolers during the morning and early afternoon, and school-aged children during the late afternoon.
– New Mothers: Marketing to new mothers is the best way to build future customers. The new mother’s program will focus on creating pottery that celebrates the new baby.
4.3 Service Business Analysis:
The Pottery Table is a do-it-yourself craft business where customers create their own unique piece of pottery.
Several successful do-it-yourself businesses in Monroe focus on the joy of the creative process. However, there is only one existing pottery store in Monroe that offers the same service. The Kiln Room is located in the commercial district and caters to more serious pottery customers.
The Pottery Table’s focus is on entertainment rather than education. The customer experience is more important than the pottery itself. Repeat business and referrals are crucial for the craft business’s success.
Strategy and Implementation Summary:
The Pottery Table will develop relationships with senior centers, senior organizations/clubs, childcare programs, and afterschool programs. Discounted group rates will be offered to promote sales.
5.1 Competitive Edge:
The competitive edge for The Pottery Table is Janet Miller. Janet has been a pottery instructor for the city’s arts program for the past ten years. She is a highly-respected artist and instructor in the community.
Over the years, she has built a loyal following of students who have returned to her for more instruction. She has also promoted her program at the city’s senior center and childcare centers. Additionally, she is the most visible symbol of the now-discontinued city’s arts program.
5.2 Milestones:
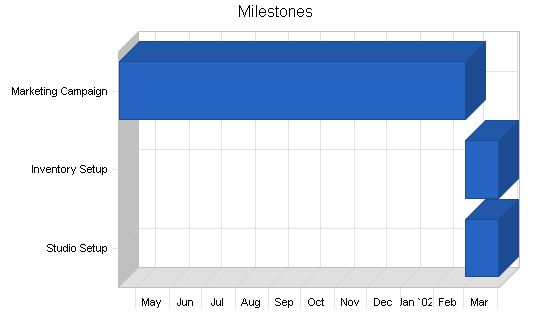
The accompanying table lists important program milestones, along with dates, managers in charge, and budgets. The milestone schedule emphasizes planning for implementation.
The table doesn’t show the commitment behind it. The business plan includes provisions for plan-vs.-actual analysis, and follow-up meetings will be held every month to discuss variance and course corrections.
Milestones:
– Studio Setup: 3/1/2002 – 4/1/2002, $13,000 budget, Manager: Janet Miller, Department: Marketing
– Inventory Setup: 3/1/2002 – 4/1/2002, $7,000 budget, Manager: Janet Miller, Department: Department
– Marketing Campaign: 3/1/2002 – 4/15/2001, $300 budget, Manager: Janet Miller, Department: Department
– Totals: $20,300 budget
Sales Strategy:
The Pottery Table’s sales strategy is to sell the creative experience to target customers. Janet Miller will make presentations at senior centers, childcare centers, afterschool programs, and parent groups.
The Pottery Table will offer free sessions for children during the first month of business. Children will be given a small cup to paint, which is part of a set. The Pottery Table will promote children returning and painting another cup in the set.
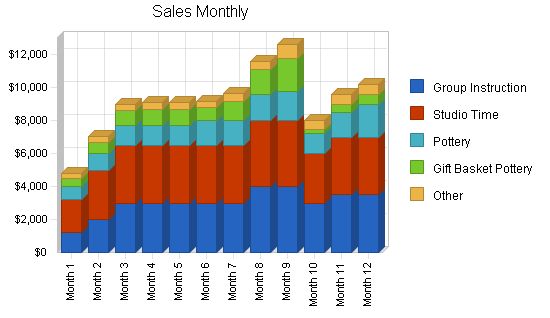
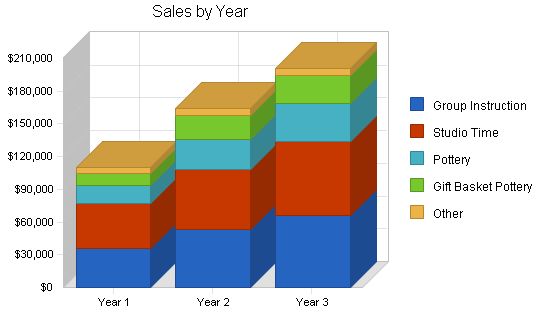
The following is the sales forecast for the next three years.
Sales Forecast:
Year 1 Year 2 Year 3
Sales
Group Instruction $36,200 $53,000 $66,000
Studio Time $40,500 $55,000 $68,000
Pottery $16,500 $28,000 $35,000
Gift Basket Pottery $11,000 $22,000 $25,000
Other $5,718 $6,300 $7,200
Total Sales $109,918 $164,300 $201,200
Direct Cost of Sales:
Year 1 Year 2 Year 3
Group Instruction $0 $0 $0
Studio Time $0 $0 $0
Pottery $8,250 $10,400 $13,200
Gift Basket Pottery $4,710 $8,800 $10,000
Other $2,859 $3,150 $3,600
Subtotal Direct Cost of Sales $15,819 $22,350 $26,800
– Seniors: Senior groups (six or more) will receive a 15% discount for group instruction and studio time, and a 15% discount for individuals using the studio between 9 a.m. and 3 p.m. on weekdays.
– Youth (ages 3 – 10): Youth will receive a group discount (six or more) of 15% for group instruction and studio time.
– New Mothers: New mothers will receive a 20% discount for group instruction and studio time.
Management Summary:
Janet Miller will be the manager of The Pottery Table.
Personnel Plan:
The personnel of The Pottery Table are as follows:
– Manager
– Instructors, part-time (2)
– Aides (1)
Year 1 Year 2 Year 3
Manager $24,000 $35,000 $40,000
Instructor $27,000 $40,000 $44,000
Aides $18,000 $20,000 $22,000
Other $0 $0 $0
Total People: 3
Total Payroll: $69,000 $95,000 $106,000
The following is the financial plan for The Pottery Table.
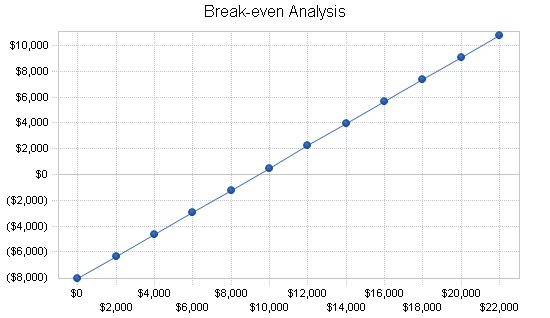
The monthly break-even point is shown in the table and chart below.
Break-even Analysis
Monthly Revenue Break-even: $9,426
Assumptions:
– Average Percent Variable Cost: 14%
– Estimated Monthly Fixed Cost: $8,070
7.2 Projected Profit and Loss
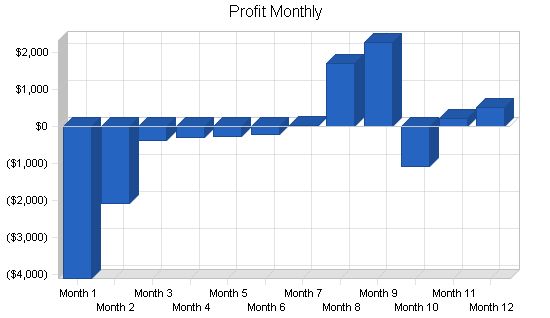
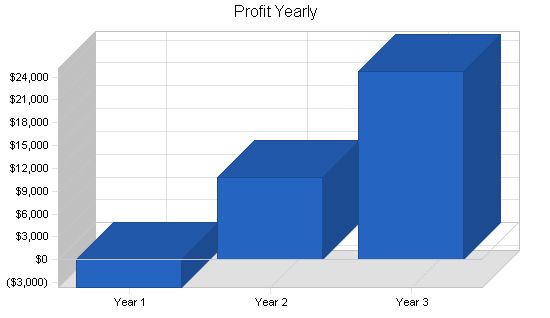
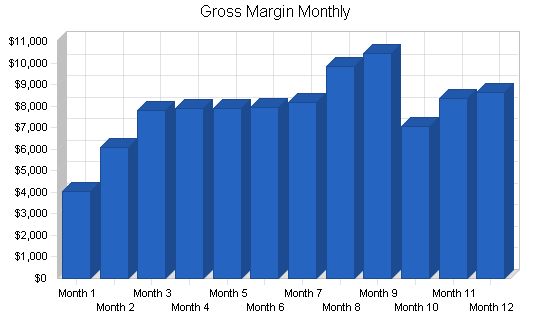
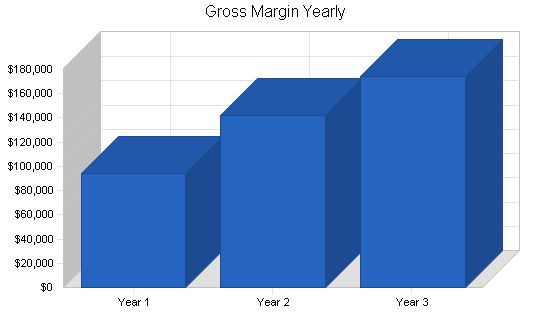
The table and charts below show projected profit and loss for the next three years.
Pro Forma Profit and Loss
Year 1 Year 2 Year 3
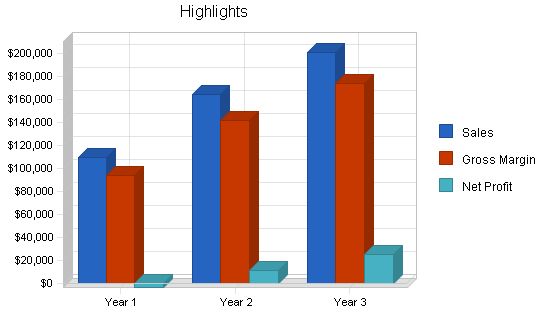
Sales $109,918 $164,300 $201,200
Direct Cost of Sales $15,819 $22,350 $26,800
Other Production Expenses $0 $0 $0
Total Cost of Sales $15,819 $22,350 $26,800
Gross Margin $94,099 $141,950 $174,400
Gross Margin % 85.61% 86.40% 86.68%
Expenses
Payroll $69,000 $95,000 $106,000
Sales and Marketing and Other Expenses $1,200 $1,500 $1,500
Depreciation $4,284 $4,282 $4,282
Leased Equipment $0 $0 $0
Utilities $2,400 $2,400 $2,400
Insurance $1,200 $0 $0
Rent $8,400 $8,400 $8,400
Payroll Taxes $10,350 $14,250 $15,900
Other $0 $0 $0
Total Operating Expenses $96,834 $125,832 $138,482
Profit Before Interest and Taxes ($2,735) $16,118 $35,918
EBITDA $1,549 $20,400 $40,200
Interest Expense $924 $751 $585
Taxes Incurred $0 $4,610 $10,600
Net Profit ($3,659) $10,757 $24,733
Net Profit/Sales -3.33% 6.55% 12.29%
7.3 Projected Cash Flow
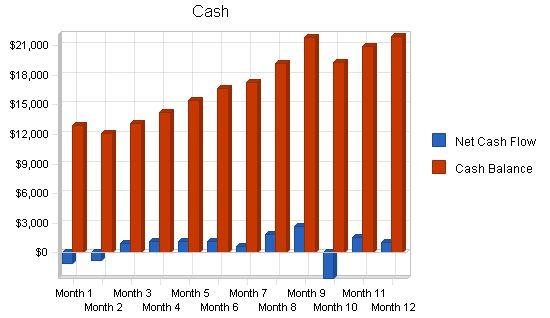
The following table and chart highlight the projected cash flow for three years.
Pro Forma Cash Flow
| Pro Forma Cash Flow | |||
| Year 1 | Year 2 | Year 3 | |
| Cash Received | |||
| Cash from Operations | |||
| Cash Sales | $109,918 | $164,300 | $201,200 |
| Subtotal Cash from Operations | $109,918 | $164,300 | $201,200 |
| Additional Cash Received | |||
| Sales Tax, VAT, HST/GST Received | $0 | $0 | $0 |
| New Current Borrowing | $0 | $0 | $0 |
| New Other Liabilities (interest-free) | $0 | $0 | $0 |
| New Long-term Liabilities | $0 | $0 | $0 |
| Sales of Other Current Assets | $0 | $0 | $0 |
| Sales of Long-term Assets | $0 | $0 | $0 |
| New Investment Received | $0 | $0 | $0 |
| Subtotal Cash Received | $109,918 | $164,300 | $201,200 |
| Expenditures | |||
| Expenditures from Operations | |||
| Cash Spending | $69,000 | $95,000 | $106,000 |
| Bill Payments | $31,216 | $54,225 | $65,702 |
| Subtotal Spent on Operations | $100,216 | $149,225 | $171,702 |
| Additional Cash Spent | |||
| Sales Tax, VAT, HST/GST Paid Out | $0 | $0 | $0 |
| Principal Repayment of Current Borrowing | $0 | $0 | $0 |
| Other Liabilities Principal Repayment | $0 | $0 | $0 |
| Long-term Liabilities Principal Repayment | $1,660 | $1,660 | $1,660 |
| Purchase Other Current Assets | $0 | $0 | $0 |
| Purchase Long-term Assets | $0 | $0 | $0 |
| Dividends | $0 | $0 | $0 |
| Subtotal Cash Spent | $101,876 | $150,885 | $173,362 |
| Net Cash Flow | $8,042 | $13,415 | $27,838 |
| Cash Balance | $21,942 | $35,357 | $63,195 |
7.4 Projected Balance Sheet
The following table highlights the projected balance sheet for three years.
| Pro Forma Balance Sheet | |||
| Year 1 | Year 2 | Year 3 | |
| Assets | |||
| Current Assets | |||
| Cash | $21,942 | $35,357 | $63,195 |
| Inventory | $1,702 | $2,404 | $2,883 |
| Other Current Assets | $0 | $0 | $0 |
| Total Current Assets | $23,644 | $37,762 | $66,078 |
| Long-term Assets | |||
| Long-term Assets | $44,000 | $44,000 | $44,000 |
| Accumulated Depreciation | $4,284 | $8,566 | $12,848 |
| Total Long-term Assets | $39,716 | $35,434 | $31,152 |
| Total Assets | $63,360 | $73,196 | $97,230 |
| Liabilities and Capital | Year 1 | Year 2 | Year 3 |
| Current Liabilities | |||
| Accounts Payable | $3,779 | $4,518 | $5,479 |
| Current Borrowing | $0 | $0 | $0 |
| Other Current Liabilities | $0 | $0 | $0 |
| Subtotal Current Liabilities | $3,779 | $4,518 | $5,479 |
| Long-term Liabilities | $8,340 | $6,680 | $5,020 |
| Total Liabilities | $12,119 | $11,198 | $10,499 |
| Paid-in Capital | $70,000 | $70,000 | $70,000 |
| Retained Earnings | ($15,100) | ($18,759) | ($8,002) |
| Earnings | ($3,659) | $10,757 | $24,733 |
| Total Capital | $51,241 | $61,998 | $86,731 |
| Total Liabilities and Capital | $63,360 | $73,196 | $97,230 |
| Net Worth | $51,241 | $61,998 | $86,731 |
7.5 Business Ratios
Business ratios for the years of this plan are shown below. Industry profile ratios based on the Standard Industrial Classification (SIC) code 3269, Pottery Products, are shown for comparison.
| Ratio Analysis | ||||
| Year 1 | Year 2 | Year 3 | Industry Profile | |
| Sales Growth | 0.00% | 49.48% | 22.46% | 5.10% |
| Percent of Total Assets | ||||
| Inventory | 2.69% | 3.28% | 2.97% | 18.40% |
| Other Current Assets | 0.00% | 0.00% | 0.00% | 39.20% |
| Total Current Assets | 37.32% | 51.59% | 67.96% | 76.70% |
| Long-term Assets | 62.68% | 48.41% | 32.04% | 23.30% |
| Total Assets | 100.00% | 100.00% | 100.00% | 100.00% |
| Current Liabilities | ||||
| Accounts Payable | 5.96% | 6.17% | 5.64% | 34.10% |
| Long-term Liabilities | 13.16% | 9.13% | 5.16% | 19.80% |
| Total Liabilities | 19.13% | 15.30% | 10.80% | 53.90% |
| Net Worth | 80.87% | 84.70% | 89.20% | 46.10% |
| Percent of Sales | ||||
| Sales | 100.00% | 100.00% | 100.00% | 100.00% |
| Gross Margin | 85.61% | 86.40% | 86.68% | 38.40% |
| Selling, General & Administrative Expenses | 88.94% | 79.85% | 74.39% | 21.60% |
| Advertising Expenses | 1.09% | 0.91% | 0.75% | 1.20% |
| Profit Before Interest and Taxes | -2.49% | 9.81% | 17.85% | 2.80% |
| Main Ratios | ||||
| Current | 6.26 | 8.36 | 12.06 | 1.77 |
| Quick | 5.81 | 7.83 | 11.53 | 1.01 |
| Total Debt to Total Assets | 19.13% | 15.30% | 10.80% | 53.90% |
| Pre-tax Return on Net Worth | -7.14% | 24.79% | 40.74% | 3.40% |
| Pre-tax Return on Assets | -5.77% | 20.99% | 36.34% | 7.40% |
| Additional Ratios | Year 1 | Year 2 | Year 3 | |
| Net Profit Margin | -3.33% | 6.55% | 12.29% | n.a |
| Return on Equity | -7.14% | 17.35% | 28.52% | n.a |
| Activity Ratios | ||||
| Inventory Turnover | 5.92 | 10.89 | 10.14 | n.a |
| Accounts Payable Turnover | 9.26 | 12.17 | 12.17 | n.a |
| Payment Days | 27 | 28 | 27 | n.a |
| Total Asset Turn | ||||
| Personnel Plan | |||||||||||||
| Manager | 0% | $2,000 | $2,000 | $2,000 | $2,000 | $2,000 | $2,000 | $2,000 | $2,000 | $2,000 | $2,000 | $2,000 | $2,000 |
| Instructor | 0% | $2,250 | $2,250 | $2,250 | $2,250 | $2,250 | $2,250 | $2,250 | $2,250 | $2,250 | $2,250 | $2,250 | $2,250 |
| Aides | 0% | $1,500 | $1,500 | $1,500 | $1,500 | $1,500 | $1,500 | $1,500 | $1,500 | $1,500 | $1,500 | $1,500 | $1,500 |
| Other | 0% | $0 | $0 | $0 | $0 | $0 | $0 | $0 | $0 | $0 | $0 | $0 | $0 |
| Total People | 3 | 3 | 3 | 3 | 3 | 3 | 3 | 3 | 3 | 3 | 3 | 3 | |
| Total Payroll | $5,750 | $5,750 | $5,750 | $5,750 | $5,750 | $5,750 | $5,750 | $5,750 | $5,750 | $5,750 | $5,750 | $5,750 |
| General Assumptions | |||||||||||||
| Plan Month | 1 | 2 | 3 | 4 | 5 | 6 | 7 | 8 | 9 | 10 | 11 | 12 | |
| Current Interest Rate | 10.00% | 10.00% | 10.00% | 10.00% | 10.00% | 10.00% | 10.00% | 10.00% | 10.00% | 10.00% | 10.00% | 10.00% | |
| Long-term Interest Rate | 10.00% | 10.00% | 10.00% | 10.00% | 10.00% | 10.00% | 10.00% | 10.00% | 10.00% | 10.00% | 10.00% | 10.00% | |
| Tax Rate | 30.00% | 30.00% | 30.00% | 30.00% | 30.00% | 30.00% | 30.00% | 30.00% | 30.00% | 30.00% | 30.00% | 30.00% | |
| Other | 0 | 0 | 0 | 0 | 0 | 0 | 0 | 0 | 0 | 0 | 0 | 0 |
| Pro Forma Profit and Loss | |||||||||||||
| Sales | $4,800 | $7,030 | $8,963 | $9,099 | $9,139 | $9,195 | $9,635 | $11,578 | $12,650 | $8,040 | $9,594 | $10,194 | |
| Direct Cost of Sales | $750 | $965 | $1,182 | $1,230 | $1,250 | $1,248 | $1,467 | $1,739 | $2,225 | $970 | $1,247 | $1,547 | |
| Other Production Expenses | $0 | $0 | $0 | $0 | $0 | $0 | $0 | $0 | $0 | $0 | $0 | $0 | |
| Total Cost of Sales | $750 | $965 | $1,182 | $1,230 | $1,250 | $1,248 | $1,467 | $1,739 | $2,225 | $970 | $1,247 | $1,547 | |
| Gross Margin | $4,050 | $6,065 | $7,782 | $7,870 | $7,890 | $7,948 | $8,167 | $9,839 | $10,425 | $7,070 | $8,347 | $8,647 | |
| Gross Margin % | 84.38% | 86.27% | 86.82% | 86.49% | 86.33% | 86.43% | 84.77% | 84.98% | 82.41% | 87.94% | 87.00% | 84.82% | |
| Expenses | |||||||||||||
| Payroll | $5,750 | $5,750 | $5,750 | $5,750 | $5,750 | $5,750 | $5,750 | $5,750 | $5,750 | $5,750 | $5,750 | $5,750 | |
| Sales and Marketing and Other Expenses | $100 | $100 | $100 | $100 | $100 | $100 | $100 | $100 | $100 | $100 | $100 | $100 | |
| Depreciation | $357 | $357 | $357 | $357 | $357 | $357 | $357 | $357 | $357 | $357 | $357 | $357 | |
| Leased Equipment | $0 | $0 | $0 | $0 | $0 | $0 | $0 | $0 | $0 | $0 | $0 | $0 | |
| Utilities | $200 | $200 | $200 | $200 | $200 | $200 | $200 | $200 | $200 | $200 | $200 | $200 | |
| Insurance | $100 | $100 | $100 | $100 | $100 | $100 | $100 | $100 | $100 | $100 | $100 | $100 | |
| Rent | $700 | $700 | $700 | $700 | $700 | $700 | $700 | $700 | $700 | $700 | $700 | $700 | |
| Payroll Taxes | 15% | $863 | $863 | $863 | $863 | $863 | $863 | $863 | $863 | $863 | $863 | $863 | $863 |
| Other | $0 | $0 | $0 | $0 | $0 | $0 | $0 | $0 | $0 | $0 | $0 | $0 | |
| Total Operating Expenses | $8,070 | $8,070 | $8,070 | $8,070 | $8,070 | $8,070 | $8,070 | $8,070 | $8,070 | $8,070 | $8,070 | $8,070 | |
| Profit Before Interest and Taxes | ($4,020) | ($2,005) | ($288) | ($200) | ($180) | ($122) | $98 | $1,770 | $2,356 | ($1,000) | $278 | $578 | |
| EBITDA | ($3,663) | ($1,648) | $69 | $157 | $177 | $235 | $455 | $2,127 | $2,713 | ($643) | $635 | $935 | |
| Interest Expense | $83 | $83 | $82 | $81 | $79 | $78 | $76 | $75 | $74 | $72 | $71 | $70 | |
| Taxes Incurred | $0 | $0 | $0 | $0 | $0 | $0 | $0 | $0 | $0 | $0 | $0 | $0 | |
| Net Profit | ($4,103) | ($2,088) | ($370) | ($280) | ($259) | ($200) | $22 | $1,695 | $2,282 | ($1,072) | $207 | $508 | |
| Net Profit/Sales | -85.48% | -29.70% | -4.13% | -3.08% | -2.83% | -2.17% | 0.22% | 14.64% | 18.04% | -13.33% | 2.15% | 4.98% |
Pro Forma Cash Flow
| Pro Forma Cash Flow | |||||||||||||
| Month 1 | Month 2 | Month 3 | Month 4 | Month 5 | Month 6 | Month 7 | Month 8 | Month 9 | Month 10 | Month 11 | Month 12 | ||
| Cash Received | |||||||||||||
| Cash from Operations | |||||||||||||
| Cash Sales | $4,800 | $7,030 | $8,963 | $9,099 | $9,139 | $9,195 | $9,635 | $11,578 | $12,650 | $8,040 | $9,594 | $10,194 | |
| Subtotal Cash from Operations | $4,800 | $7,030 | $8,963 | $9,099 | $9,139 | $9,195 | $9,635 | $11,578 | $12,650 | $8,040 | $9,594 | $10,194 | |
| Additional Cash Received | |||||||||||||
| Sales Tax, VAT, HST/GST Received | 0.00% | $0 | $0 | $0 | $0 | $0 | $0 | $0 | $0 | $0 | $0 | $0 | |
| New Current Borrowing | $0 | $0 | $0 | $0 | $0 | $0 | $0 | $0 | $0 | $0 | $0 | $0 | |
| New Other Liabilities (interest-free) | $0 | $0 | $0 | $0 | $0 | $0 | $0 | $0 | $0 | $0 | $0 | $0 | |
| New Long-term Liabilities | $0 | $0 | $0 | $0 | $0 | $0 | $0 | $0 | $0 | $0 | $0 | $0 | |
| Sales of Other Current Assets | $0 | $0 | $0 | $0 | $0 | $0 | $0 | $0 | $0 | $0 | $0 | $0 | |
| Sales of Long-term Assets | $0 | $0 | $0 | $0 | $0 | $0 | $0 | $0 | $0 | $0 | $0 | $0 | |
| New Investment Received | $0 | $0 | $0 | $0 | $0 | $0 | $0 | $0 | $0 | $0 | $0 | $0 | |
| Subtotal Cash Received | $4,800 | $7,030 | $8,963 | $9,099 | $9,139 | $9,195 | $9,635 | $11,578 | $12,650 | $8,040 | $9,594 | $10,194 | |
| Expenditures | |||||||||||||
| Expenditures from Operations | |||||||||||||
| Cash Spending | $5,750 | $5,750 | $5,750 | $5,750 | $5,750 | $5,750 | $5,750 | $5,750 | $5,750 | $5,750 | $5,750 | $5,750 | |
| Bill Payments | $68 | $2,046 | $2,046 | $2,044 | $2,043 | $2,075 | $3,064 | $3,755 | $4,100 | $4,704 | $2,073 | $3,199 | |
| Subtotal Spent on Operations | $5,818 | $7,796 | $7,796 | $7,794 | $7,793 | $7,825 | $8,814 | $9,505 | $9,850 | $10,454 | $7,823 | $8,949 | |
| Additional Cash Spent | |||||||||||||
| Sales Tax, VAT, HST/GST Paid Out | $0 | $0 | $0 | $0 | $0 | $0 | $0 | $0 | $0 | $0 | $0 | $0 | |
| Principal Repayment of Current Borrowing | $0 | $0 | $0 | $0 | $0 | $0 | $0 | $0 | $0 | $0 | $0 | $0 | |
| Other Liabilities Principal Repayment | $0 | $0 | $0 | $0 | $0 | $0 | $0 | $0 | $0 | $0 | $0 | $0 | |
| Long-term Liabilities Principal Repayment | $0 | $0 | $166 | $166 | $166 | $166 | $166 | $166 | $166 | $166 | $166 | $166 | |
| Purchase Other Current Assets | $0 | $0 | $0 | $0 | $0 | $0 | $0 | $0 | $0 | $0 | $0 | $0 | |
| Purchase Long-term Assets | $0 | $0 | $0 | $0 | $0 | $0 | $0 | $0 | $0 | $0 | $0 | $0 | |
| Dividends | $0 | $0 | $0 | $0 | $0 | $0 | $0 | $0 | $0 | $0 | $0 | $0 | |
| Subtotal Cash Spent | $5,818 | $7,796 | $7,962 | $7,960 | $7,959 | $7,991 | $8,980 | $9,671 | $10,016 | $10,620 | $7,989 | $9,115 | |
| Net Cash Flow | ($1,018) | ($766) | $1,001 | $1,139 | $1,180 | $1,204 | $655 | $1,907 | $2,634 | ($2,580) | $1,605 | $1,079 | |
| Cash Balance | $12,882 | $12,116 | $13,117 | $14,256 | $15,436 | $16,641 | $17,296 | $19,203 | $21,837 | $19,258 | $20,863 | $21,942 | |
Pro Forma Balance Sheet
| Pro Forma Balance Sheet | |||||||||||||
| Month 1 | Month 2 | Month 3 | Month 4 | Month 5 | Month 6 | Month 7 | Month 8 | Month 9 | Month 10 | Month 11 | Month 12 | ||
| Assets | |||||||||||||
| Current Assets | |||||||||||||
| Cash | $12,882 | $12,116 | $13,117 | $14,256 | $15,436 | $16,641 | $17,296 | $19,203 | $21,837 | $19,258 | $20,863 | $21,942 | |
| Inventory | $7,000 | $6,250 | $5,285 | $4,104 | $2,874 | $1,624 | $1,377 | $1,614 | $1,913 | $2,448 | $1,478 | $1,372 | $1,702 |
| Other Current Assets | $0 | $0 | $0 | $0 | $0 | $0 | $0 | $0 | $0 | $0 | $0 | $0 | |
| Total Current Assets | $19,132 | $17,401 | $17,221 | $17,130 | $17,061 | $18,017 | $18,910 | $21,116 | $24,285 | $20,735 | $22,235 | $23,644 | |
| Long-term Assets | |||||||||||||
| Long-term Assets | $44,000 | $44,000 | $44,000 | $44,000 | $44,000 | $44,000 | $44,000 | $44,000 | $44,000 | $44,000 | $44,000 | $44,000 | $44,000 |
| Accumulated Depreciation | $0 | $357 | $714 | $1,071 | $1,428 | $1,785 | $2,142 | $2,499 | $2,856 | $3,213 | $3,570 | $3,927 | $4,284 |
| Total Long-term Assets | $43,643 | $43,286 | $42,929 | $42,572 | $42,215 | $41,858 | $41,501 | $41,144 | $40,787 | $40,430 | $40,073 | $39,716 | |
| Total Assets | $62,775 | $60,687 | $60,150 | $59,702 | |||||||||
Hello!
I’m Andrew Brooks, a seasoned finance consultant from the USA and the mind behind phonenumber247.com.
My career is built on a foundation of helping individuals and businesses thrive financially in an ever-changing economic landscape. At phonenumber247.com, my aim is to demystify the complex world of finance, providing clear, actionable advice that can help you navigate your financial journey with confidence. Whether it’s personal finance management, investment strategies, or understanding the nuances of market dynamics, I’m here to share insights and tools that can propel you towards your financial goals.
Welcome to my digital space, where every piece of advice is a step closer to financial clarity and success!
