Mexican Restaurant Business Plan
This business plan was created to secure investors. La Salsa Fresh Mexican Grill is a highly sought-after franchise in Oregon, with great potential for growth. Currently, La Salsa is expanding in all of the neighboring states of Oregon. The Santa Barbara Restaurant Group (SBRG) franchises the La Salsa chain.
La Salsa will succeed in Eugene for two main reasons: first, there is no direct competition, making it a unique option in town; second, there is a high demand for this type of product in Eugene. The current population of the greater Eugene/Springfield metro area is over 300,000 according to Census 2000, and it is expected to continue growing.
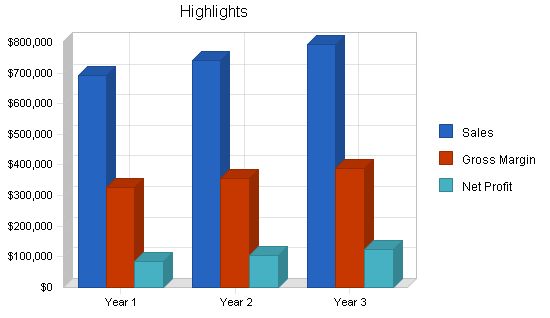
Creating a Limited Liability Corporation (LLC) will protect owners and investors from personal liability. Benjamin D. Strock plans to expand La Salsa in Oregon over the next three years, developing between 3 to 10 restaurants under the LLC. This business plan focuses on the first store, setting clear goals. Per store revenues for La Salsa range between $400,000 to $1,000,000, depending on location. Start-up costs from SBRG are estimated between $300,000 and $400,000, with an initial investment of around $600,000. A small business loan will cover half of this amount, and the remaining half will come from private investors. Net profits are expected to be high, yielding approximately $85,000 per store annually, possibly even higher.
The franchisor, SBRG, will have control over pricing, training, building, and advertising, in exchange for 8% to 10% of gross sales. Assuming that a location has been agreed upon by the franchisor, franchisee, and investors, the first La Salsa in Oregon is expected to be up and running within three months of initial financing.
Mission
La Salsa Fresh Mexican Grill aims to become the leading casual Mexican dining restaurant in Eugene while adhering to unwavering principles as it expands to more than three restaurants. The following six guiding principles will help evaluate the appropriateness of our decisions:
– Provide a positive work environment and treat our employees with respect.
– Embrace diversity as a fundamental aspect of our business.
– Maintain the highest standards of excellence in food production, preparation, and service for our customers.
– Foster lasting relationships with our guests.
– Make positive contributions to our communities and the environment.
– Recognize that profitability is crucial for our future success.
1.2 Objectives:
– Set up an LLC to limit liability.
– Complete construction in less than three months.
– Achieve positive net profit in the first quarter.
– Become a market leader in Eugene.
– Generate monthly revenues of $60,000 or more.
– Increase annual sales by 3-7%.
1.3 Keys to Success:
– Location, location, location.
– Secure bank financing at reasonable interest rates and individual investors.
– Recruit and hire qualified, motivated employees.
– Allocate marketing budget effectively to boost sales.
– Offer extraordinary food with unmatched taste.
The parent company asserts that La Salsa is a rapidly expanding Mexican chain across the nation. Its distinctive feature is the open-display kitchen where customers can witness the preparation of their food. The restaurant is also known for its unique salsa bar, which allows guests to customize their salsa according to their preferences. La Salsa prides itself on cooking without the use of microwaves, can openers, or lard. The flavorsome menu consists of gourmet burritos, handcrafted tacos, and vegetarian specialties. La Salsa has been a beloved West Coast favorite since 1979.
2.1 Company Ownership:
A Limited Liability Corporation (LLC) will be created to protect the owner and investors from personal liability. The initial focus of the LLC will be to franchise La Salsa. Benjamin D. Strock, the managing shareholder, intends to offer outside ownership in the LLC on an equity, debt, or combination basis to accelerate the growth of the La Salsa concept. Shareholders will receive a 12% priority return on their investment.
2.2 Start-up Summary:
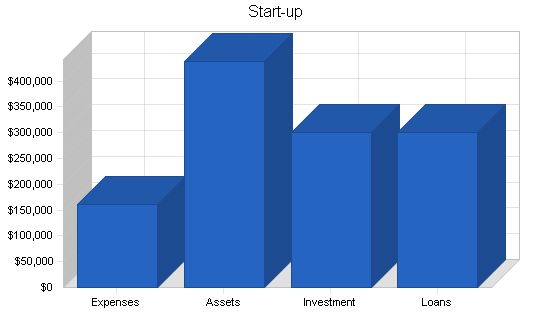
The Santa Barbara Restaurant Group, owners of the La Salsa chain, estimates the overall start-up costs to be between $300,000 and $400,000. The figures in the start-up cost table aim to reflect these estimates. The allocation into each category may not be precise, but the estimated costs are slightly higher than those of the Santa Barbara Restaurant Group. Overestimated costs allow for contingencies and ensure smooth operations.
Start-up Requirements
Start-up Expenses
– Legal: $5,000
– Stationery etc.: $2,000
– Brochures: $1,000
– Franchise Fee: $20,000
– Insurance: $1,000
– Rent: $5,000
– Development Fee: $10,000
– Expensed Equipment: $17,000
– Other: $100,000
– Total Start-up Expenses: $161,000
Start-up Assets
– Cash Required: $102,000
– Start-up Inventory: $50,000
– Other Current Assets: $0
– Long-term Assets: $287,000
– Total Assets: $439,000
Total Requirements: $600,000
Start-up Funding
Start-up Expenses to Fund: $161,000
Start-up Assets to Fund: $439,000
Total Funding Required: $600,000
Assets
– Non-cash Assets from Start-up: $337,000
– Cash Requirements from Start-up: $102,000
– Additional Cash Raised: $0
– Cash Balance on Starting Date: $102,000
– Total Assets: $439,000
Liabilities and Capital
Liabilities
– Current Borrowing: $0
– Long-term Liabilities: $300,000
– Accounts Payable (Outstanding Bills): $0
– Other Current Liabilities (interest-free): $0
– Total Liabilities: $300,000
Capital
– Planned Investment
– Richard & Ginny Strock: $100,000
– Benjamin D. Strock: $20,000
– Investor 3: $80,000
– Investor 4: $100,000
– Additional Investment Requirement: $0
– Total Planned Investment: $300,000
– Loss at Start-up (Start-up Expenses): ($161,000)
– Total Capital: $139,000
Total Capital and Liabilities: $439,000
Total Funding: $600,000
Company Locations and Facilities
The first option for location is close to Sacred Heart Hospital on 13th Avenue in Eugene, Oregon. This location will be important because the University of Oregon campus is close, as is the hospital. Students and hospital employees will have a new lunch spot which is much needed. The best location currently available is next to the Napoli Restaurant & Bakery, but it is only 800 square feet. In order to make this location feasible a partial/full buyout of Napoli Bakery is desirable. The bakery is not overly successful and will hopefully be cooperative in this process.
If the first restaurant is not located on 13th Ave., there are a few high traffic strip mall locations available. Located on the corner of 18th Ave. and Willamette Street, next to a mini-mall, Blockbuster Video, Little Caesar’s Pizza, and Hong Kong Chinese restaurant. South Eugene High School (open campus) is also very close by. There are 1367 square feet available, plenty of parking, high traffic and high visibility. This location rents for $970 a month, and appears to have excellent profit potential. Traffic counts from 1997 were approximately 15,000 for each direction on 18th Ave., and 11,000 one way on Willamette St. Overall revenues would most likely stay consistent with 13th Ave. location, but it is conceivable that without the effect of demand decline during the summer months next to University of Oregon, overall revenues could be substantially higher in this location.
As the company gains community recognition, La Salsa will expand to one or both of the neighboring shopping malls (Valley River Center or Gateway). Once the Eugene/Springfield market is developed, expansion to other Oregon cities-on-the-rise such as Corvallis, Bend, Medford, or Ashland is anticipated. Portland is not a strong candidate considering competition is already fierce in that region.
Market Analysis Summary
Market segmentation is described in the next section.
Market Segmentation
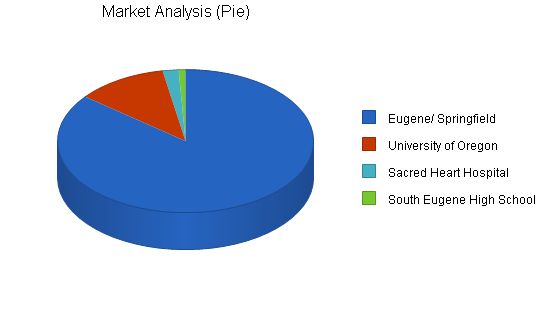
The 2000 Census of Eugene/Springfield says there are currently over 300,000 people populating this metropolitan area. Using basic demographic characteristics of age, gender, income, location, food preferences, ethnicity, an estimate of 150,000 potential customers was used in developing this plan.
The University of Oregon was established in 1876 and currently has over 20,000 students. It is expected to gradually increase in size as it has over the previous years.
Across the street from the University is Sacred Heart Hospital, which currently employs over 3,500 people (according to a hospital information representative) though it is likely moving to North Eugene in the near future. If this happens, the current hospital will remain open only as an emergency room. This move and change will take time, hence the growth rate is listed as -50%.
Both of the proposed initial locations are close to university student residential areas. At the 18th Ave. and Willamette St. location, high school students might be substituted for Sacred Heart Hospital employees as a source of mid-day customers. South Eugene High School has over 1,500 students.
Market Analysis
Year 1 Year 2 Year 3 Year 4 Year 5 CAGR
Potential Customers Growth Eugene/Springfield 3% 150,000 154,500 159,135 163,909 168,826 3.00% University of Oregon 3% 20,000 20,600 21,218 21,855 22,511 3.00% Sacred Heart Hospital -50% 3,500 1,750 875 438 219 -49.99% South Eugene High School 2% 1,500 1,523 1,546 1,569 1,593 1.52% Total 2.50% 175,000 178,373 182,774 187,771 193,149 2.50%
Target Market Segment Strategy
The quick casual dining industry’s target market is broad and includes all demographics.
Market Trends
Eugene is expanding and working on various projects, including:
– Building a new public library.
– Renovating and reopening Broadway St. to traffic.
– Constructing a new Federal Courthouse.
– Funding low-income housing in downtown.
– Renovating highway off-ramps at an estimated $88 million.
– Making additions to the University of Oregon’s football stadium.
These projects indicate the city’s preparation for expansionary times.
Market Needs
In Eugene, there is a lack of high-quality, quick food Mexican restaurants. Most local Mexican restaurants use canned foods, lard, and shredded meats. We will offer 100% fresh food prepared in front of our customers, with a customizable salsa bar.
Main Competitors
Quick Service Mexican
Burrito Boy – Popular quick Mexican restaurant in town, but we offer higher food quality and service.
Santa Fe Burrito – Low-quality quick Mexican restaurant, located on Willamette St., that uses canned foods and lard products.
Burrito Amigos – Not near the university campus, offers a traditional style of Mexican food.
Ritta’s Burritos – Started as a mobile stand and continues catering business, uses shredded meats and canned foods.
Las Brasas – Located on Blair Street, not a competitive threat to La Salsa.
Other Quick Service Mexican
La Salsa is not a direct competitor with drive-thru fast-food Mexican restaurants like Taco Bell and Taco Time. We offer higher quality, fresh food at a fraction of sit-down dining prices.
Strategy and Implementation Summary
Cost-effective marketing will be utilized, including local media, event marketing, and advertising on university campuses.
Pricing Strategy
All menu items are moderately priced, with an average customer spending $5-8 including food and drink. Student discounts may be offered.
Promotion Strategy
Advertising will be tailored to the location. Close to the university campus, promotional events and advertising will target students and hospital employees. High traffic locations will use traditional forms of restaurant promotion.
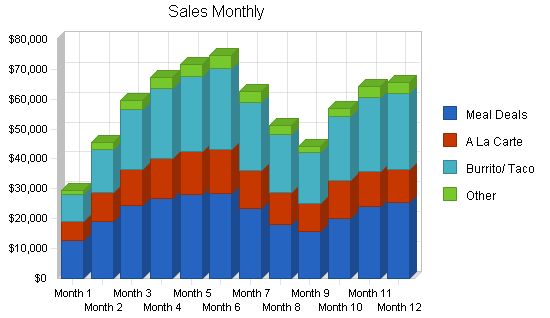
Sales forecasts start at a moderate level and build until the end of the school year. Sales may decline during the summer months but pick up again when students return to school. Proper location and parking availability can appeal to a larger market. Competitors have not arrived in town yet, so La Salsa has the opportunity for higher sales than predicted.
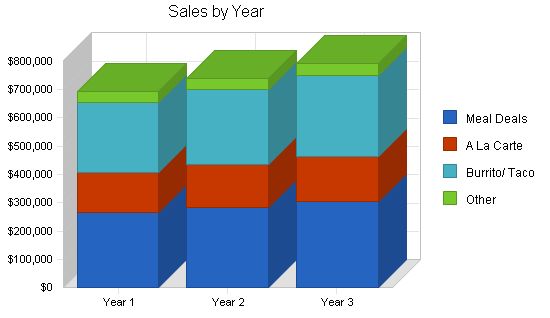
Sales Forecast:
| Sales | Year 1 | Year 2 | Year 3 |
| Meal Deals | $266,169 | $284,801 | $304,737 |
| A La Carte | $139,720 | $149,500 | $159,965 |
| Burrito/ Taco | $249,068 | $266,503 | $285,158 |
| Other | $37,151 | $39,752 | $42,534 |
| Total Sales | $692,108 | $740,556 | $792,394 |
Management Summary:
Benjamin D. Strock will run all business operations for La Salsa Fresh Mexican Grill, with an accounting professional reviewing the final accounting monthly. Other key personnel include the day-to-day manager and cooks. Qualified and available staff and management can be sourced from local labor pools.
5.1 Organizational Structure:
Benjamin D. Strock will oversee store operations. Each store will have a general manager responsible for day-to-day operations and rewarded through incremental profit sharing. Future organizational structure may include a director of store operations when store locations exceed three and/or expansion to other Oregon cities. A full-time accountant and a sales/marketing director may also be added at that juncture to support growth and execute the franchise expansion strategy.
5.2 Management Team:
BENJAMIN D. STROCK
[Personal and Confidential information removed.]
5.3 Personnel Plan:
Typical La Salsa locations have one cashier (usually the manager) and two or three cooks. Additional cooks may be needed based on sales volume. Initially, there will not be a marketing manager, with Benjamin D. Strock taking care of marketing. As the business grows, a marketing representative will be hired. Benjamin D. Strock will receive $3,000 per month for managing the first restaurants. Once profits increase, he may no longer be included on the payroll.
| Personnel Plan | |||
| Year 1 | Year 2 | Year 3 | |
| Production Personnel | |||
| Manager | $36,417 | $37,508 | $38,633 |
| Cooks (3) | $58,264 | $60,013 | $61,813 |
| Other | $34,417 | $35,448 | $36,512 |
| Subtotal | $129,098 | $132,969 | $136,958 |
| Sales and Marketing Personnel | |||
| Marketing | $12,168 | $12,531 | $12,907 |
| Other | $0 | $0 | $0 |
| Subtotal | $12,168 | $12,531 | $12,907 |
| General and Administrative Personnel | |||
| Benjamin Strock | $36,501 | $37,594 | $38,722 |
| Accountant | $12,140 | $12,503 | $12,878 |
| Other | $0 | $0 | $0 |
| Subtotal | $48,641 | $50,097 | $51,600 |
| Other Personnel | |||
| Name or Title | $0 | $0 | $0 |
| Other | $0 | $0 | $0 |
| Subtotal | $0 | $0 | $0 |
| Total People | 0 | 0 | 0 |
| Total Payroll | $189,907 | $195,597 | $201,465 |
The financial plan for La Salsa Fresh Mexican Grill is presented in the following sections. Year-end totals for the first three years are provided, while the appendix includes first-year monthly figures.
6.1 Important Assumptions:
The financial plan is based on several key assumptions, including the assumption that the economy will recover from the current recession. Access to equity capital and financing is assumed to be sufficient to support the financial plan as shown in the tables.
| General Assumptions | |||
| Year 1 | Year 2 | Year 3 | |
| Plan Month | 1 | 2 | 3 |
| Current Interest Rate | 10.00% | 10.00% | 10.00% |
| Long-Term Interest Rate | 7.00% | 7.00% | 7.00% |
| Tax Rate | 30.00% | 30.00% | 30.00% |
| Other | 0 | 0 | 0 |
6.2 Break-even Analysis:
The break-even analysis is based on estimated fixed costs.
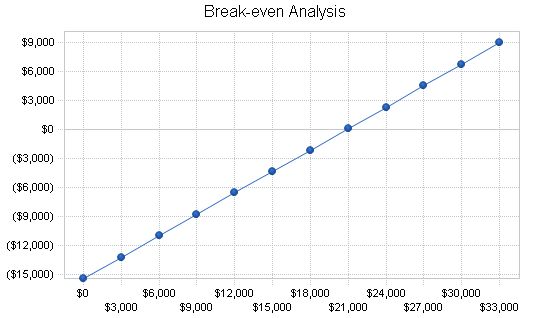
| Break-even Analysis | |
| Monthly Revenue Break-even | $20,895 |
| Assumptions: | |
| Average Percent Variable Cost | 26% |
| Estimated Monthly Fixed Cost | $15,398 |
6.3 Projected Profit and Loss
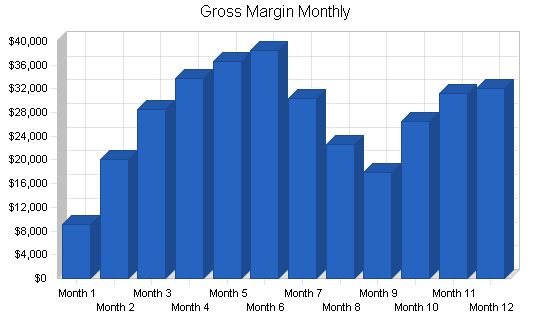
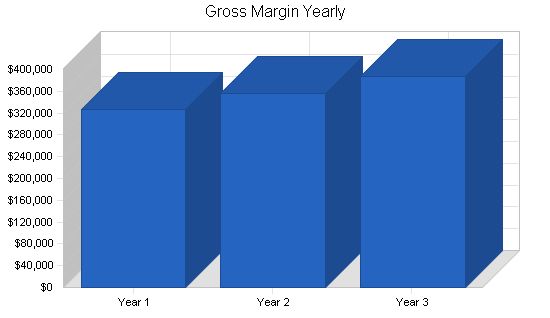
To avoid underestimating costs, the costs listed are higher than what will likely be experienced. This may make the profits and margins less attractive, but there are many ways to cut costs.
The Santa Barbara Restaurant Group requires a 4% royalty on gross sales to cover national and local advertising costs. This is included in the Profit/Loss table as Corporate Marketing Fee. The Franchise Fee is 6% of gross sales and is labeled Franchise Fee on the Profit/Loss table.
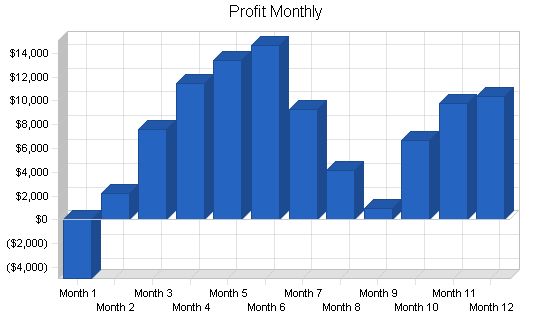
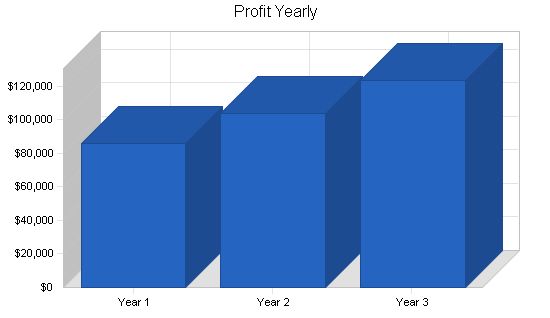
The table below shows the Pro Forma Profit and Loss for three years:
| Pro Forma Profit and Loss | |||
| Year 1 | Year 2 | Year 3 | |
| Sales | $692,108 | $740,556 | $792,394 |
| Direct Cost of Sales | $182,072 | $194,817 | $208,454 |
| Production Payroll | $129,098 | $132,969 | $136,958 |
| SBRG Franchise Fee | $41,526 | $44,433 | $47,544 |
| Other Production Expenses | $12,000 | $12,000 | $12,000 |
| Total Cost of Sales | $364,696 | $384,219 | $404,956 |
| Gross Margin | $327,412 | $356,336 | $387,439 |
| Gross Margin % | 47.31% | 48.12% | 48.89% |
| Operating Expenses | |||
| Sales and Marketing Expenses | |||
| Sales and Marketing Payroll | $12,168 | $12,531 | $12,907 |
| Advertising/ Promotion | $12,000 | $12,000 | $12,000 |
| SBRG Corporate Marketing Fee | $27,684 | $29,622 | $31,696 |
| Travel | $1,800 | $1,800 | $1,800 |
| Miscellaneous | $1,200 | $1,200 | $1,200 |
| Total Sales and Marketing Expenses | $54,852 | $57,153 | $59,603 |
| Sales and Marketing % | 7.93% | 7.72% | 7.52% |
| General and Administrative Expenses | |||
| General and Administrative Payroll | $48,641 | $50,097 | $51,600 |
| Sales and Marketing and Other Expenses | $0 | $0 | $0 |
| Depreciation | $12,000 | $12,000 | $12,000 |
| Leased Equipment | $0 | $0 | $0 |
| Utilities | $2,400 | $2,400 | $2,400 |
| Insurance | $2,400 | $2,400 | $2,400 |
| Rent | $36,000 | $36,000 | $36,000 |
| Payroll Taxes | $28,486 | $29,340 | $30,220 |
| Other General and Administrative Expenses | $0 | $0 | $0 |
| Total General and Administrative Expenses | $129,927 | $132,237 | $134,620 |
| General and Administrative % | 18.77% | 17.86% | 16.99% |
| Other Expenses: | |||
| Other Payroll | $0 | $0 | $0 |
| Consultants | $0 | $0 | $0 |
| Contract/Consultants | $0 | $0 | $0 |
| Total Other Expenses | $0 | $0 | $0 |
| Other % | 0.00% | 0.00% | 0.00% |
| Total Operating Expenses | $184,779 | $189,390 | $194,223 |
| Profit Before Interest and Taxes | $142,632 | $166,947 | $193,216 |
| EBITDA | $154,632 | $178,947 | $205,216 |
| Interest Expense | $20,194 | $18,690 | $17,020 |
| Taxes Incurred | $36,731 | $44,477 | $52,859 |
| Net Profit | $85,707 | $103,779 | $123,337 |
| Net Profit/Sales | 12.38% | 14.01% | 15.57% |
6.4 Projected Cash Flow
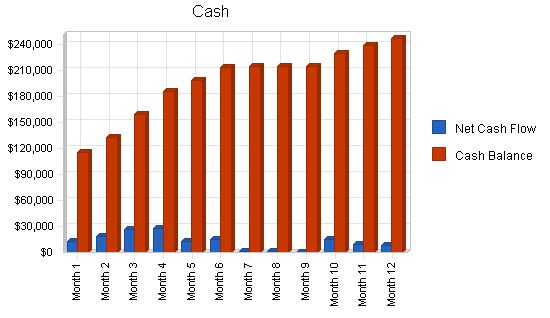
The chart and table below highlight the importance of maintaining cash on hand to ensure the business can continue running smoothly, especially in the event of any unforeseen problems.
Pro Forma Cash Flow:
| Pro Forma Cash Flow | |||
| Year 1 | Year 2 | Year 3 | |
| Cash Received | |||
| Cash from Operations | |||
| Cash Sales | $692,108 | $740,556 | $792,394 |
| Subtotal Cash from Operations | $692,108 | $740,556 | $792,394 |
| Additional Cash Received | |||
| Sales Tax, VAT, HST/GST Received | $0 | $0 | $0 |
| New Current Borrowing | $0 | $0 | $0 |
| New Other Liabilities (interest-free) | $0 | $0 | $0 |
| New Long-term Liabilities | $0 | $0 | $0 |
| Sales of Other Current Assets | $0 | $0 | $0 |
| Sales of Long-term Assets | $0 | $0 | $0 |
| New Investment Received | $0 | $0 | $0 |
| Subtotal Cash Received | $692,108 | $740,556 | $792,394 |
| Expenditures | Year 1 | Year 2 | Year 3 |
| Expenditures from Operations | |||
| Cash Spending | $189,907 | $195,597 | $201,465 |
| Bill Payments | $336,482 | $432,352 | $454,852 |
| Subtotal Spent on Operations | $526,389 | $627,949 | $656,317 |
| Additional Cash Spent | |||
| Sales Tax, VAT, HST/GST Paid Out | $0 | $0 | $0 |
| Principal Repayment of Current Borrowing | $0 | $0 | $0 |
| Other Liabilities Principal Repayment | $0 | $0 | $0 |
| Long-term Liabilities Principal Repayment | $21,479 | $23,032 | $24,697 |
| Purchase Other Current Assets | $0 | $0 | $0 |
| Purchase Long-term Assets | $0 | $0 | $0 |
| Dividends | $0 | $36,000 | $36,000 |
| Subtotal Cash Spent | $547,868 | $686,981 | $717,014 |
| Net Cash Flow | $144,240 | $53,574 | $75,381 |
| Cash Balance | $246,240 | $299,814 | $375,195 |
Projected Balance Sheet:
| Pro Forma Balance Sheet | |||
| Year 1 | Year 2 | Year 3 | |
| Assets | |||
| Current Assets | |||
| Cash | $246,240 | $299,814 | $375,195 |
| Inventory | $19,201 | $20,545 | $21,984 |
| Other Current Assets | $0 | $0 | $0 |
| Total Current Assets | $265,441 | $320,360 | $397,179 |
| Long-term Assets | |||
| Long-term Assets | $287,000 | $287,000 | $287,000 |
| Accumulated Depreciation | $12,000 | $24,000 | $36,000 |
| Total Long-term Assets | $275,000 | $263,000 | $251,000 |
| Total Assets | $540,441 | $583,360 | $648,179 |
| Liabilities and Capital | Year 1 | Year 2 | Year 3 |
| Current Liabilities | |||
| Accounts Payable | $37,214 | $35,385 | $37,564 |
| Current Borrowing | $0 | $0 | $0 |
| Other Current Liabilities | $0 | $0 | $0 |
| Subtotal Current Liabilities | $37,214 | $35,385 | $37,564 |
| Long-term Liabilities | $278,521 | $255,488 | $230,791 |
| Total Liabilities | $315,735 | $290,874 | $268,355 |
| Paid-in Capital | $300,000 | $300,000 | $300,000 |
| Retained Earnings | ($161,000) | ($111,293) | ($43,514) |
| Earnings | $85,707 | $103,779 | $123,337 |
| Total Capital | $224,707 | $292,486 | $379,823 |
| Total Liabilities and Capital | $540,441 | $583,360 | $648,179 |
| Net Worth | $224,707 | $292,486 | $379,823 |
| Ratio Analysis | ||||
| Year 1 | Year 2 | Year 3 | Industry Profile | |
| Sales Growth | 0.00% | 7.00% | 7.00% | 7.60% |
| Percent of Total Assets | ||||
| Inventory | 3.55% | 3.52% | 3.39% | 3.60% |
| Other Current Assets | 0.00% | 0.00% | 0.00% | 35.60% |
| Total Current Assets | 49.12% | 54.92% | 61.28% | 43.70% |
| Long-term Assets | 50.88% | 45.08% | 38.72% | 56.30% |
| Total Assets | 100.00% | 100.00% | 100.00% | 100.00% |
| Current Liabilities | ||||
| Accounts Payable | 6.89% | 6.07% | 5.80% | 32.70% |
| Long-term Liabilities | 51.54% | 43.80% | 35.61% | 28.50% |
| Total Liabilities | 58.42% | 49.86% | 41.40% | 61.20% |
| Net Worth | 41.58% | 50.14% | 58.60% | 38.80% |
| Percent of Sales | ||||
| Sales | 100.00% | 100.00% | 100.00% | 100.00% |
| Gross Margin | 47.31% | 48.12% | 48.89% | 60.50% |
| Pro Forma Cash Flow | |||||||||||||
| Month 1 | Month 2 | Month 3 | Month 4 | Month 5 | Month 6 | Month 7 | Month 8 | Month 9 | Month 10 | Month 11 | Month 12 | ||
| Cash Sales | $29,392 | $45,506 | $59,482 | $67,244 | $71,621 | $74,492 | $62,494 | $51,112 | $44,138 | $56,926 | $64,144 | $65,557 | |
| Subtotal Cash from Operations | $29,392 | $45,506 | $59,482 | $67,244 | $71,621 | $74,492 | $62,494 | $51,112 | $44,138 | $56,926 | $64,144 | $65,557 | |
| Sales Tax, VAT, HST/GST Received | 0.00% | $0 | $0 | $0 | $0 | $0 | $0 | $0 | $0 | $0 | $0 | $0 | |
| New Current Borrowing | $0 | $0 | $0 | $0 | $0 | $0 | $0 | $0 | $0 | $0 | $0 | $0 | |
| New Other Liabilities (interest-free) | $0 | $0 | $0 | $0 | $0 | $0 | $0 | $0 | $0 | $0 | $0 | $0 | |
| New Long-term Liabilities | $0 | $0 | $0 | $0 | $0 | $0 | $0 | $0 | $0 | $0 | $0 | $0 | |
| Sales of Other Current Assets | $0 | $0 | $0 | $0 | $0 | $0 | $0 | $0 | $0 | $0 | $0 | $0 | |
| Sales of Long-term Assets | $0 | $0 | $0 | $0 | $0 | $0 | $0 | $0 | $0 | $0 | $0 | $0 | |
| New Investment Received | $0 | $0 | $0 | $0 | $0 | $0 | $0 | $0 | $0 | $0 | $0 | $0 | |
| Subtotal Cash Received | $29,392 | $45,506 | $59,482 | $67,244 | $71,621 | $74,492 | $62,494 | $51,112 | $44,138 | $56,926 | $64,144 | $65,557 | |
| Cash Spending | $14,800 | $14,811 | $15,851 | $15,890 | $15,930 | $15,969 | $16,009 | $16,048 | $16,090 | $16,130 | $16,169 | $16,210 | |
| Bill Payments | $363 | $11,044 | $15,768 | $22,330 | $41,154 | $42,603 | $43,377 | $32,561 | $26,551 | $24,497 | $36,855 | $39,379 | |
| Subtotal Spent on Operations | $15,163 | $25,855 | $31,619 | $38,220 | $57,084 | $58,572 | $59,386 | $48,609 | $42,641 | $40,627 | $53,024 | $55,589 | |
| Sales Tax, VAT, HST/GST Paid Out | $0 | $0 | $0 | $0 | $0 | $0 | $0 | $0 | $0 | $0 | $0 | $0 | |
| Principal Repayment of Current Borrowing | $0 | $0 | $0 | $0 | $0 | $0 | $0 | $0 | $0 | $0 | $0 | $0 | |
| Other Liabilities Principal Repayment | $0 | $0 | $0 | $0 | $0 | $0 | $0 | $0 | $0 | $0 | $0 | $0 | |
| Long-term Liabilities Principal Repayment | $1,733 | $1,743 | $1,754 | $1,764 | $1,774 | $1,784 | $1,795 | $1,805 | $1,816 | $1,826 | $1,837 | $1,848 | |
| Purchase Other Current Assets | $0 | $0 | $0 | $0 | $0 | $0 | $0 | $0 | $0 | $0 | $0 | $0 | |
| Purchase Long-term Assets | $0 | $0 | $0 | $0 | $0 | $0 | $0 | $0 | $0 | $0 | $0 | $0 | |
| Dividends | $0 | $0 | $0 | $0 | $0 | $0 | $0 | $0 | $0 | $0 | $0 | $0 | |
| Subtotal Cash Spent | $16,896 | $27,598 | $33,372 | $39,984 | $58,859 | $60,357 | $61,180 | $50,415 | $44,456 | $42,453 | $54,861 | $57,437 | |
| Net Cash Flow | $12,496 | $17,908 | $26,110 | $27,260 | $12,762 | $14,135 | $1,314 | $697 | ($318) | $14,473 | $9,283 | $8,120 | |
| Cash Balance | $114,496 | $132,404 | $158,514 | $185,773 | $198,536 | $212,671 | $213,985 | $214,682 | $214,364 | $228,837 | $238,119 | $246,240 | |
Pro Forma Balance Sheet:
| Pro Forma Balance Sheet | |||||||||||||
| Month 1 | Month 2 | Month 3 | Month 4 | Month 5 | Month 6 | Month 7 | Month 8 | Month 9 | Month 10 | Month 11 | Month 12 | ||
| Cash | $102,000 | $114,496 | $132,404 | $158,514 | $185,773 | $198,536 | $212,671 | $213,985 | $214,682 | $214,364 | $228,837 | $238,119 | $246,240 |
| Inventory | $50,000 | $42,369 | $30,482 | $17,156 | $19,393 | $20,670 | $21,531 | $18,071 | $14,794 | $12,811 | $16,475 | $18,706 | $19,201 |
| Total Current Assets | $152,000 | $156,865 | $162,886 | $175,670 | $205,166 | $219,206 | $234,202 | $232,056 | $229,476 | $227,175 | $245,312 | $256,825 | $265,441 |
| Long-term Assets | $287,000 | $286,000 | $285,000 | $284,000 | $283,000 | $282,000 | $281,000 | $280,000 | $279,000 | $278,000 | $277,000 | $276,000 | $275,000 |
| Total Assets | $439,000 | $442,865 | $447,886 | $459,670 | $488,166 | $501,206 | $515,202 | $512,056 | $508,476 | $505,175 | $522,312 | $532,825 | $540,441 |
| Current Liabilities | $0 | $10,525 | $15,045 | $20,960 | $39,736 | $41,145 | $42,284 | $31,673 | $25,748 | $23,271 | $35,542 | $38,096 | $37,214 |
| Long-term Liabilities | $300,000 | $298,267 | $296,523 | $294,770 | $293,006 | $291,232 | $289,448 | $287,653 | $285,848 | $284,032 | $282,205 | $280,368 | $278,521 |
| Total Liabilities | $300,000 | $308,791 | $311,568 | $315,730 | $332,742 | $332,377 | $331,732 | $319,326 | $311, | ||||
Hello!
I’m Andrew Brooks, a seasoned finance consultant from the USA and the mind behind phonenumber247.com.
My career is built on a foundation of helping individuals and businesses thrive financially in an ever-changing economic landscape. At phonenumber247.com, my aim is to demystify the complex world of finance, providing clear, actionable advice that can help you navigate your financial journey with confidence. Whether it’s personal finance management, investment strategies, or understanding the nuances of market dynamics, I’m here to share insights and tools that can propel you towards your financial goals.
Welcome to my digital space, where every piece of advice is a step closer to financial clarity and success!
