Electronics Repair Business Plan
Abbey Electronic Services is a full-service electronic repair business in the Cherry Grove section of Montclair. The business is located in the Cherry Grove Shopping Center and has repair agreements with Harry’s Electronics and Olson’s Appliance Superstore. Abbey Electronic Services also provides authorized warranty service for selected manufacturers.
Aside from business clients, Abbey’s will offer electronic repairs to the general public, whether with or without warranty service. The residential community in Cherry Grove will be a strong customer base for the business.
Richard Abbey, the owner of Abbey Electronic Services, has 25 years of experience in consumer electronics repair and is a well-respected electronics instructor at the community college.
Abbey Electronic Services will have a staff of two electronics technicians in addition to Richard.
Mission
Abbey Electronic Services aims to provide high-quality electrical repair services with a focus on convenience and rapid service. The company utilizes computerized monitoring of all parts inventory to ensure that critical parts are always in stock. Additionally, Abbey Electronic Services has strong relationships with regional vendors for rapid parts delivery.
Keys to Success
Abbey Electronic Services’ keys to success include exceptional, expedient, and convenient electrical repair services, building a strong professional relationship with customers, and rapid order and delivery of electrical part items.
Abbey Electronic Services is a startup business managed by Richard Abbey. The business will capitalize on the growing need for reliable and convenient electrical repair services in the Cherry Grove area. Most of the funding for the business will come from a ten-year SBA loan.
Start-up Summary
Richard Abbey will invest personal funds, and the remaining financing will come from a ten-year Small Business Administration (SBA) loan.
Services
Abbey Electronic Services offers repair services for various electronic products, including washer/dryer, refrigerators, cooking ranges, televisions, DVD players/VCRs, and camcorders.
Market Analysis Summary
Abbey Electronic Services focuses on meeting the demand of the local resident customer base and service agreements with Harry’s Electronics and Olson’s Appliance Superstore. The company estimates that 60% of its revenues will come from these business customers. The remaining 40% will come from local walk-in traffic. The company aims to serve the local customer base as the core of its business.
Target Market Segment Strategy
Abbey Electronic Services positions itself as the local focus for electronic repairs in the Cherry Grove area. The area has experienced significant residential growth and currently has no established electronic repair service.
Strategy and Implementation Summary
Abbey Electronic Services aims to succeed by offering high-quality and convenient electronic repair service. The business understands that quality workmanship is key to customer satisfaction and referrals.
Competitive Edge
The competitive advantage of Abbey Electronic Services is its people. Richard Abbey, the owner, and the technicians have extensive experience in the electronic repair field and prioritize customer satisfaction.
Abbey Electronic Services projects sales of $235,000 in Year 1, $252,000 in Year 2, and $275,000 in Year 3.
Management Summary
Abbey Electronic Services has hired technicians John Williamson and Jim Logan to join the team. Both technicians have a history of exceptional workmanship and strong customer relations.
Personnel Plan
The staff consists of Richard Abbey, John Williamson, and Jim Logan. Each technician is certified to perform repairs on specific products.
The financial plan includes a break-even analysis and projected sales forecast.
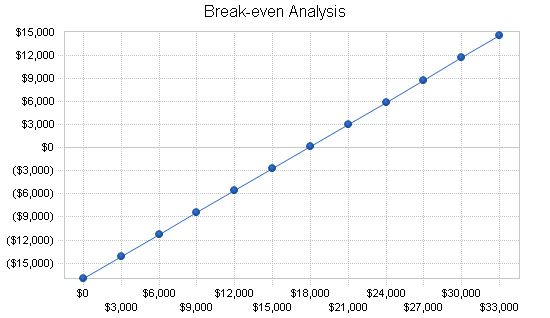
Break-even Analysis:
Monthly Revenue Break-even: $17,777
Assumptions:
– Average Percent Variable Cost: 4%
– Estimated Monthly Fixed Cost: $17,002
7.2 Projected Profit and Loss:
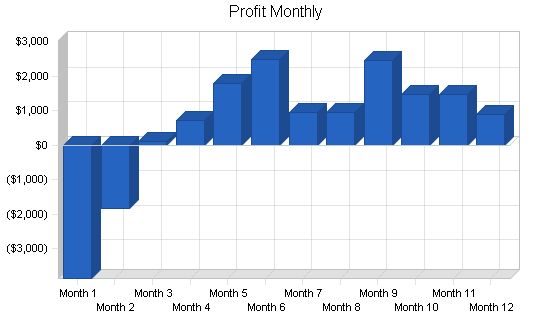
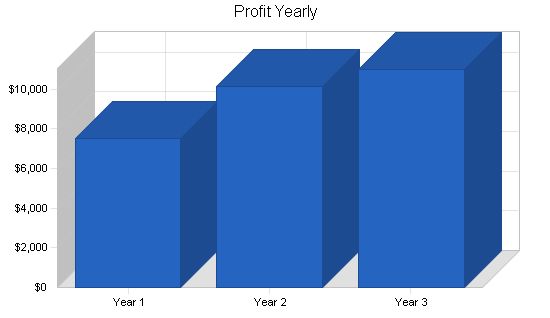
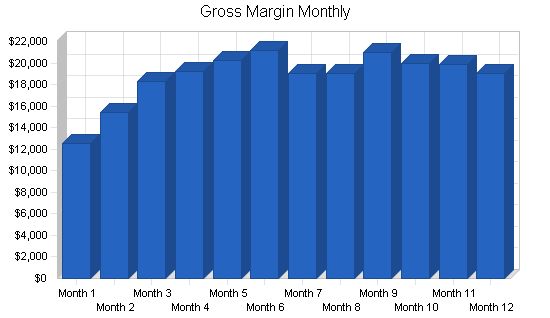
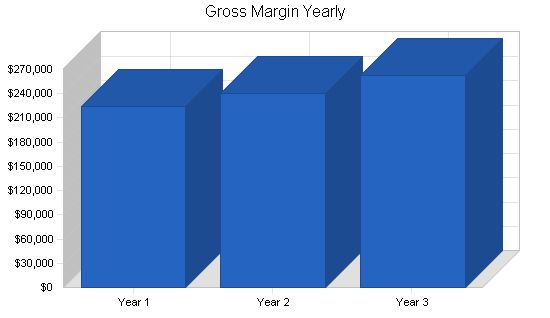
The table and chart below depict projected profit and loss for three years.
Pro Forma Profit and Loss:
| Pro Forma Profit and Loss | |||
| Year 1 | Year 2 | Year 3 | |
| Sales | $235,000 | $252,000 | $275,000 |
| Direct Cost of Sales | $10,250 | $11,700 | $12,800 |
| Other Production Expenses | $0 | $0 | $0 |
| Total Cost of Sales | $10,250 | $11,700 | $12,800 |
| Gross Margin | $224,750 | $240,300 | $262,200 |
| Gross Margin % | 95.64% | 95.36% | 95.35% |
| Expenses | |||
| Payroll | $144,000 | $156,000 | $174,000 |
| Sales and Marketing and Other Expenses | $7,400 | $5,400 | $5,400 |
| Depreciation | $2,220 | $2,220 | $2,220 |
| Leased Equipment | $14,400 | $14,400 | $14,400 |
| Utilities | $2,400 | $2,400 | $2,400 |
| Insurance | $0 | $0 | $0 |
| Rent | $12,000 | $12,000 | $12,000 |
| Payroll Taxes | $21,600 | $23,400 | $26,100 |
| Other | $0 | $0 | $0 |
| Total Operating Expenses | $204,020 | $215,820 | $236,520 |
| Profit Before Interest and Taxes | $20,730 | $24,480 | $25,680 |
| EBITDA | $22,950 | $26,700 | $27,900 |
| Interest Expense | $10,000 | $10,000 | $10,000 |
| Taxes Incurred | $3,219 | $4,344 | $4,704 |
| Net Profit | $7,511 | $10,136 | $10,976 |
| Net Profit/Sales | 3.20% | 4.02% | 3.99% |
Projected Cash Flow:
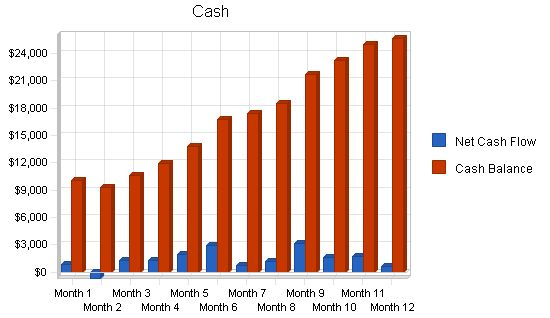
The table and chart show the projected cash flow for three years.
Pro Forma Cash Flow
| Pro Forma Cash Flow | |||
| Year 1 | Year 2 | Year 3 | |
| Cash Received | |||
| Cash from Operations | |||
| Cash Sales | $235,000 | $252,000 | $275,000 |
| Subtotal Cash from Operations | $235,000 | $252,000 | $275,000 |
| Additional Cash Received | |||
| Sales Tax, VAT, HST/GST Received | $0 | $0 | $0 |
| New Current Borrowing | $0 | $0 | $0 |
| New Other Liabilities (interest-free) | $0 | $0 | $0 |
| New Long-term Liabilities | $0 | $0 | $0 |
| Sales of Other Current Assets | $0 | $0 | $0 |
| Sales of Long-term Assets | $0 | $0 | $0 |
| New Investment Received | $0 | $0 | $0 |
| Subtotal Cash Received | $235,000 | $252,000 | $275,000 |
| Expenditures | Year 1 | Year 2 | Year 3 |
| Expenditures from Operations | |||
| Cash Spending | $144,000 | $156,000 | $174,000 |
| Bill Payments | $74,582 | $83,456 | $87,462 |
| Subtotal Spent on Operations | $218,582 | $239,456 | $261,462 |
| Additional Cash Spent | |||
| Sales Tax, VAT, HST/GST Paid Out | $0 | $0 | $0 |
| Principal Repayment of Current Borrowing | $0 | $0 | $0 |
| Other Liabilities Principal Repayment | $0 | $0 | $0 |
| Long-term Liabilities Principal Repayment | $0 | $0 | $0 |
| Purchase Other Current Assets | $0 | $0 | $0 |
| Purchase Long-term Assets | $0 | $0 | $0 |
| Dividends | $0 | $0 | $0 |
| Subtotal Cash Spent | $218,582 | $239,456 | $261,462 |
| Net Cash Flow | $16,418 | $12,544 | $13,538 |
| Cash Balance | $25,618 | $38,162 | $51,700 |
7.4 Projected Balance Sheet
The table shows the projected balance sheet for three years.
| Pro Forma Balance Sheet | |||
| Year 1 | Year 2 | Year 3 | |
| Assets | |||
| Cash | $25,618 | $38,162 | $51,700 |
| Other Current Assets | $0 | $0 | $0 |
| Total Current Assets | $25,618 | $38,162 | $51,700 |
| Long-term Assets | |||
| Long-term Assets | $100,000 | $100,000 | $100,000 |
| Accumulated Depreciation | $2,220 | $4,440 | $6,660 |
| Total Long-term Assets | $97,780 | $95,560 | $93,340 |
| Total Assets | $123,398 | $133,722 | $145,040 |
| Liabilities and Capital | Year 1 | Year 2 | Year 3 |
| Current Liabilities | |||
| Accounts Payable | $6,687 | $6,875 | $7,217 |
| Current Borrowing | $0 | $0 | $0 |
| Other Current Liabilities | $0 | $0 | $0 |
| Subtotal Current Liabilities | $6,687 | $6,875 | $7,217 |
| Long-term Liabilities | $100,000 | $100,000 | $100,000 |
| Total Liabilities | $106,687 | $106,875 | $107,217 |
| Paid-in Capital | $50,000 | $50,000 | $50,000 |
| Retained Earnings | ($40,800) | ($33,289) | ($23,153) |
| Earnings | $7,511 | $10,136 | $10,976 |
| Total Capital | $16,711 | $26,847 | $37,823 |
| Total Liabilities and Capital | $123,398 | $133,722 | $145,040 |
| Net Worth | $16,711 | $26,847 | $37,823 |
7.5 Business Ratios
Business ratios for the years of this plan are shown below. Industry profile ratios based on the Standard Industrial Classification (SIC) code 7622, Radio and Television Repair, are shown for comparison.
| Ratio Analysis | ||||
| Year 1 | Year 2 | Year 3 | Industry Profile | |
| Sales Growth | 0.00% | 7.23% | 9.13% | 6.10% |
| Percent of Total Assets | ||||
| Other Current Assets | 0.00% | 0.00% | 0.00% | 27.50% |
| Total Current Assets | 20.76% | 28.54% | 35.65% | 76.90% |
| Long-term Assets | 79.24% | 71.46% | 64.35% | 23.10% |
| Total Assets | 100.00% | 100.00% | 100.00% | 100.00% |
| Current Liabilities | 5.42% | 5.14% | 4.98% | 36.90% |
| Long-term Liabilities | 81.04% | 74.78% | 68.95% | 15.80% |
| Total Liabilities | 86.46% | 79.92% | 73.92% | 52.70% |
| Net Worth | 13.54% | 20.08% | 26.08% | 47.30% |
| Percent of Sales | ||||
| Sales | 100.00% | 100.00% | 100.00% | 100.00% |
| Gross Margin | 95.64% | 95.36% | 95.35% | 0.00% |
| Selling, General & Administrative Expenses | 92.44% | 91.33% | 92.26% | 83.50% |
| Advertising Expenses | 0.85% | 0.00% | 0.00% | 0.50% |
| Profit Before Interest and Taxes | 8.82% |
General Assumptions: – Month 1 to Month 12 – Current Interest Rate: 10.00% – Long-term Interest Rate: 10.00% – Tax Rate: 30.00% – Other: 0 Pro Forma Profit and Loss: – Month 1 to Month 12 – Sales: $13,000 to $20,000 – Direct Cost of Sales: $500 to $1,100 – Other Production Expenses: $0 – Total Cost of Sales: $500 to $1,100 – Gross Margin: $12,500 to $19,000 – Gross Margin %: 96.15% to 95.00% – Expenses – Payroll: $12,000 – Sales and Marketing and Other Expenses: $800 to $500 – Depreciation: $185 – Leased Equipment: $1,200 – Utilities: $200 – Insurance: $0 – Rent: $1,000 – Payroll Taxes: 15%, $1,800 – Other: $0 – Total Operating Expenses: $17,185 to $16,885 – Profit Before Interest and Taxes: ($4,685) to $2,115 – EBITDA: ($4,500) to $2,300 – Interest Expense: $833 – Taxes Incurred: ($1,655) to $384 – Net Profit: ($3,863) to $897 – Net Profit/Sales: -29.71% to 4.49% Pro Forma Cash Flow |
||
| Pro Forma Cash Flow | |||||||||||||
| Month 1 | Month 2 | Month 3 | Month 4 | Month 5 | Month 6 | Month 7 | Month 8 | Month 9 | Month 10 | Month 11 | Month 12 | ||
| Cash Sales | $13,000 | $16,000 | $19,000 | $20,000 | $21,000 | $22,000 | $20,000 | $20,000 | $22,000 | $21,000 | $21,000 | $20,000 | |
| Subtotal Cash from Operations | $13,000 | $16,000 | $19,000 | $20,000 | $21,000 | $22,000 | $20,000 | $20,000 | $22,000 | $21,000 | $21,000 | $20,000 | |
| Sales Tax, VAT, HST/GST Received | 0.00% | $0 | $0 | $0 | $0 | $0 | $0 | $0 | $0 | $0 | $0 | $0 | $0 |
| New Current Borrowing | $0 | $0 | $0 | $0 | $0 | $0 | $0 | $0 | $0 | $0 | $0 | $0 | $0 |
| New Other Liabilities (interest-free) | $0 | $0 | $0 | $0 | $0 | $0 | $0 | $0 | $0 | $0 | $0 | $0 | $0 |
| New Long-term Liabilities | $0 | $0 | $0 | $0 | $0 | $0 | $0 | $0 | $0 | $0 | $0 | $0 | $0 |
| Sales of Other Current Assets | $0 | $0 | $0 | $0 | $0 | $0 | $0 | $0 | $0 | $0 | $0 | $0 | $0 |
| Sales of Long-term Assets | $0 | $0 | $0 | $0 | $0 | $0 | $0 | $0 | $0 | $0 | $0 | $0 | $0 |
| New Investment Received | $0 | $0 | $0 | $0 | $0 | $0 | $0 | $0 | $0 | $0 | $0 | $0 | $0 |
| Subtotal Cash Received | $13,000 | $16,000 | $19,000 | $20,000 | $21,000 | $22,000 | $20,000 | $20,000 | $22,000 | $21,000 | $21,000 | $20,000 | |
| Cash Spending | $12,000 | $12,000 | $12,000 | $12,000 | $12,000 | $12,000 | $12,000 | $12,000 | $12,000 | $12,000 | $12,000 | $12,000 | $12,000 |
| Bill Payments | $156 | $4,710 | $5,684 | $6,735 | $7,091 | $7,053 | $7,327 | $6,883 | $6,899 | $7,360 | $7,341 | $7,343 | $12,000 |
| Subtotal Spent on Operations | $12,156 | $16,710 | $17,684 | $18,735 | $19,091 | $19,053 | $19,327 | $18,883 | $18,899 | $19,360 | $19,341 | $19,343 | |
| Sales Tax, VAT, HST/GST Paid Out | $0 | $0 | $0 | $0 | $0 | $0 | $0 | $0 | $0 | $0 | $0 | $0 | $0 |
| Principal Repayment of Current Borrowing | $0 | $0 | $0 | $0 | $0 | $0 | $0 | $0 | $0 | $0 | $0 | $0 | $0 |
| Other Liabilities Principal Repayment | $0 | $0 | $0 | $0 | $0 | $0 | $0 | $0 | $0 | $0 | $0 | $0 | $0 |
| Long-term Liabilities Principal Repayment | $0 | $0 | $0 | $0 | $0 | $0 | $0 | $0 | $0 | $0 | $0 | $0 | $0 |
| Purchase Other Current Assets | $0 | $0 | $0 | $0 | $0 | $0 | $0 | $0 | $0 | $0 | $0 | $0 | $0 |
| Purchase Long-term Assets | $0 | $0 | $0 | $0 | $0 | $0 | $0 | $0 | $0 | $0 | $0 | $0 | $0 |
| Dividends | $0 | $0 | $0 | $0 | $0 | $0 | $0 | $0 | $0 | $0 | $0 | $0 | $0 |
| Subtotal Cash Spent | $12,156 | $16,710 | $17,684 | $18,735 | $19,091 | $19,053 | $19,327 | $18,883 | $18,899 | $19,360 | $19,341 | $19,343 | $12,000 |
| Net Cash Flow | $844 | ($710) | $1,316 | $1,265 | $1,909 | $2,947 | $673 | $1,117 | $3,101 | $1,640 | $1,659 | $657 | |
| Cash Balance | $10,044 | $9,334 | $10,650 | $11,915 | $13,824 | $16,771 | $17,444 | $18,561 | $21,662 | $23,302 | $24,961 | $25,618 | |
Pro Forma Balance Sheet
| Pro Forma Balance Sheet | |||||||||||||
| Month 1 | Month 2 | Month 3 | Month 4 | Month 5 | Month 6 | Month 7 | Month 8 | Month 9 | Month 10 | Month 11 | Month 12 | ||
| Assets | Starting Balances | ||||||||||||
| Current Assets | |||||||||||||
| Cash | $9,200 | $10,044 | $9,334 | $10,650 | $11,915 | $13,824 | $16,771 | $17,444 | $18,561 | $21,662 | $23,302 | $24,961 | $25,618 |
| Other Current Assets | $0 | ||||||||||||
| Total Current Assets | $9,200 | $10,044 | $9,334 | $10,650 | $11,915 | $13,824 | $16,771 | $17,444 | $18,561 | $21,662 | $23,302 | $24,961 | $25,618 |
| Long-term Assets | |||||||||||||
| Long-term Assets | $100,000 | $100,000 | $100,000 | $100,000 | $100,000 | $100,000 | $100,000 | $100,000 | $100,000 | $100,000 | $100,000 | $100,000 | $100,000 |
| Accumulated Depreciation | $0 | $185 | $370 | $555 | $740 | $925 | $1,110 | $1,295 | $1,480 | $1,665 | $1,850 | $2,035 | $2,220 |
| Total Long-term Assets | $100,000 | $99,815 | $99,630 | $99,445 | $99,260 | ||||||||
Hello!
I’m Andrew Brooks, a seasoned finance consultant from the USA and the mind behind phonenumber247.com.
My career is built on a foundation of helping individuals and businesses thrive financially in an ever-changing economic landscape. At phonenumber247.com, my aim is to demystify the complex world of finance, providing clear, actionable advice that can help you navigate your financial journey with confidence. Whether it’s personal finance management, investment strategies, or understanding the nuances of market dynamics, I’m here to share insights and tools that can propel you towards your financial goals.
Welcome to my digital space, where every piece of advice is a step closer to financial clarity and success!
