Sun Heat is a California-based start-up company that specializes in offering solar home water heating systems, led by Sara Clark. The market for solar heating in Southern California, where they receive over 245 days of sun a year, is substantial. Sun Heat has identified two market segments to target: individuals who prefer DIY systems, and those who prefer to hire a skilled installer. The DIY segment has an annual growth rate of 9%, with 3.9 million potential customers. The professional install market has an annual growth rate of 8%, with 2.7 million potential customers.
Sun Heat offers two versions of their solar home water heating system: a DIY system and a unit installed by a licensed professional. Both options appeal to cost-conscious and environmentally aware customers. Sun Heat’s system can reduce an individual family’s electricity expenditure on water heating by 70%-90%.
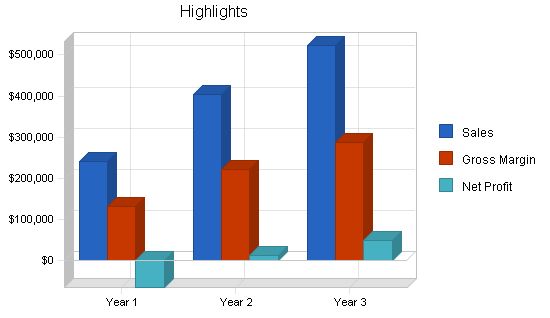
Sara Clark, who possesses an undergraduate degree in environmental studies as well as Master’s degrees in engineering and business administration, leads Sun Heat. Sales are projected to grow significantly in years two and three, resulting in a corresponding increase in net profit.
Contents
1.1 Objectives
- Become the premier manufacturer of solar-based water heating systems.
- Achieve market penetration within the first three years.
- Create a customer-centric organization based on cutting-edge technology.
1.2 Mission
Sun Heat’s mission is to become the leading solar water heater company, offering high-quality products, exceptional customer service, and environmental sustainability.
1.3 Keys to Success
Sun Heat has identified three keys to success:
- Provide reliable and easy-to-maintain solar water heating systems.
- Expand the market for solar heating as a mainstream energy source.
- Implement strict financial controls.
Company Summary
Sun Heat is a California registered corporation, with Sara Clark as the main shareholder.
2.1 Company Ownership
Sun Heat is a CA corporation, owned by Sara Clark, the Founder and President.
2.2 Start-up Summary
Sun Heat requires the following items for start-up:
- Computer system: seven terminals, four laser printers, one central server, broadband Internet connections, Microsoft Office for all computers, two ACT! licenses, and two QuickBooks Pro licenses.
- Laptop computer and LCD projector.
- Website development.
- Office furniture: desks, cabinets, and chairs for seven stations.
- Waiting room furniture.
- Eight-extension telephone system with a hardware-based voice mail system.
- Three large whiteboards.
- Sales room promotional displays.
- Fax machine and copier.
- Racks and shelving for the warehouse.
- Forklift.
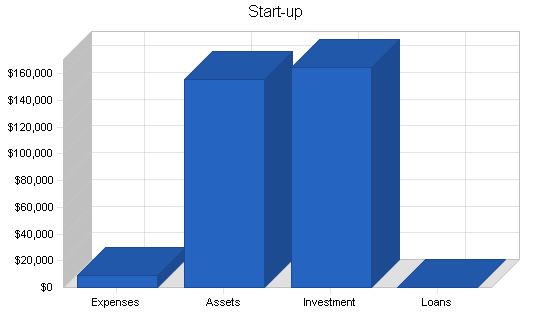
Start-up Funding
Start-up Expenses to Fund: $9,000
Start-up Assets to Fund: $156,000
Total Funding Required: $165,000
Assets
Non-cash Assets from Start-up: $62,000
Cash Requirements from Start-up: $94,000
Additional Cash Raised: $0
Cash Balance on Starting Date: $94,000
Total Assets: $156,000
Liabilities and Capital
Liabilities
Current Borrowing: $0
Long-term Liabilities: $0
Accounts Payable (Outstanding Bills): $0
Other Current Liabilities (interest-free): $0
Total Liabilities: $0
Capital
Planned Investment
Investor 1: $60,000
Investor 2: $55,000
Other: $50,000
Additional Investment Requirement: $0
Total Planned Investment: $165,000
Loss at Start-up (Start-up Expenses): ($9,000)
Total Capital: $156,000
Total Capital and Liabilities: $156,000
Total Funding: $165,000
Products
Sun Heat will sell two versions of a solar home water heating system. One will be a do-it-yourself model, and the second will be installed by a licensed professional. By offering these two models, Sun Heat caters to customers who enjoy DIY projects and those who prefer professional installation.
Solar power is a clean, renewable source of energy that is environmentally friendly. Sun Heat effectively harnesses the sun’s energy to provide hot water for households. The system can save families 70%-90% of the total electricity costs for water heating, meeting most of the heating needs during summer. In times of reduced sunlight, the system preheats the water before using the conventional water heating system.
The Sun Heat system, designed for single-family homes, consists of a solar collector, a storage container, a pump, and various valves. The system is open-loop and connected to city water, ensuring simplicity and cost-effectiveness. The solar collectors or panels are typically located on the roof, and the heated water is pumped into a storage tank. Safety valves are installed throughout the system to prevent overheating and protect against component failure.
Sun Heat’s products are manufactured by a reputable supplier and assembled at their factory, allowing for high-quality products without large manufacturing costs.
Sun Heat offers a five-year warranty on their products against manufacturer’s defects. Additionally, licensed installers are required to provide an 18-month warranty on the installation labor to ensure proper installation and maintain brand reputation.
Market Analysis Summary
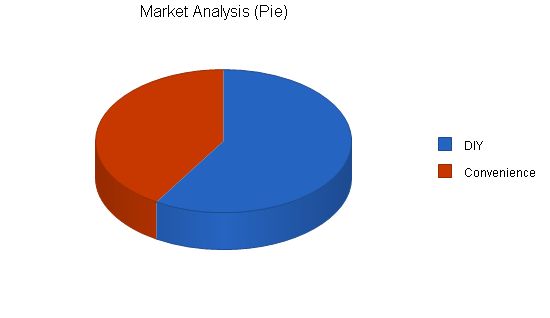
Sun Heat targets two market segments: the "DIY" segment and the "Convenience" segment. The solar water heating industry has diverse offerings, ranging from DIY kits to professional installation services. Sun Heat aims to meet the needs of both segments.
The DIY segment consists of individuals with building and repair skills who enjoy tackling projects on their own. This segment is motivated by saving money, the satisfaction of completing projects, and customizing their work. They are typically married with at least one child at home, have a household income between $50,000-$80,000, and undertake multiple projects per year.
The Convenience segment values the advantages of a solar water heating system but prefers professional installation. They recognize the environmental and economic benefits of solar power and have higher household incomes. This segment tends to be slightly older, with ages ranging from 35-65, and have higher education levels.
Sun Heat’s products will be sold through DIY retailers and professional installers. DIY retailers purchase Sun Heat products in bulk for resale, while professional installers are approved partners for installation services.
Market Analysis:
Potential Customers Growth Year 1 Year 2 Year 3 Year 4 Year 5 CAGR
DIY 9% 3,968,987 4,326,196 4,715,554 5,139,954 5,602,550 9.00%
Convenience 8% 2,789,254 3,012,394 3,253,386 3,513,657 3,794,750 8.00%
Total 8.59% 6,758,241 7,338,590 7,968,940 8,653,611 9,397,300 8.59%
4.2 Target Market Segment Strategy:
Sun Heat concentrates on two market segments for several reasons. The lack of high quality products available to the DIY crowd and the size and growth of the do-it-yourself market make it attractive. The new wave of environmentalism is another reason, as more people want to reduce their negative impact on the environment and solar hot water heating provides an easy and economical solution.
4.3 Industry Analysis:
The industry comprises many manufacturers of solar water heating components and systems, serving different markets. Some companies sell components to assemblers, while others make all the components in-house. Solar heating systems vary in complexity, with some using computers to make adjustments based on the sun’s position. Each company competes within a specific niche. Sun Heat’s competitive edge lies in serving two markets with similar products.
4.3.1 Competition and Buying Patterns:
Sun Heat’s main competitors are Mega Sun, Solar Energy Systems, Shell Solar, Imagination Solar, and Go Solar Company. Mega Sun’s products are good but less competitive due to shipping and manufacturing costs. Solar Energy Systems offers cheaper but low-quality DIY systems. Shell Solar is a high-end manufacturer with more efficient products, but they are expensive. Imagination Solar offers a simple but inefficient DIY system. Go Solar Company manufactures solar electric systems and will soon release a solar water heating system.
Buying patterns differ between DIY customers, who seek advice from sales agents at Lowes and Home Depot, and professional installs, who rely on word of mouth or advice from contractors.
Strategy and Implementation Summary:
Sun Heat has two competitive edges: serving both the DIY and professional install markets, and offering high-quality systems. Their marketing focuses on educating customers about the environmental and economic benefits of installing a solar water heating system.
5.1 Competitive Edge:
Sun Heat stands out by serving both the DIY and professional install markets, increasing their potential customer base at minimal costs. They offer the same high-quality product to both segments, unlike their competitors who only provide basic models to DIYers.
5.2 Marketing Strategy:
Sun Heat’s marketing campaign highlights the environmental and economic benefits of solar water heating systems. They target DIY and professional install markets, as well as retailers carrying their products. Sun Heat also aims to establish relationships with utilities to offer financial incentives to customers using alternative energy sources.
5.3 Sales Strategy:
To reach the DIY segment, Sun Heat works with retailers to inform them about their superior product. They are developing a licensing program for the professional install market, offering product information, training, and certification. Sun Heat provides technical support to installers, fostering strong relationships. They offer an excellent margin system to installers and use promotions during trade shows to generate sales. High-quality sales literature is distributed to illustrate the superior quality of Sun Heat products.
5.3.1 Sales Forecast:
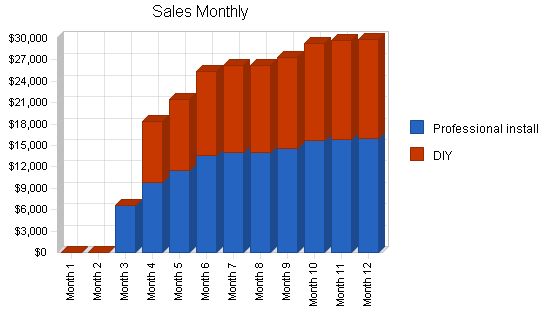
Sales for Sun Heat are expected to increase steadily. The company has adopted a conservative sales forecast. Please refer to the detailed sales table and graphs for monthly and yearly sales information.
(Note: Please review the provided table and graphs for the detailed sales forecast.)
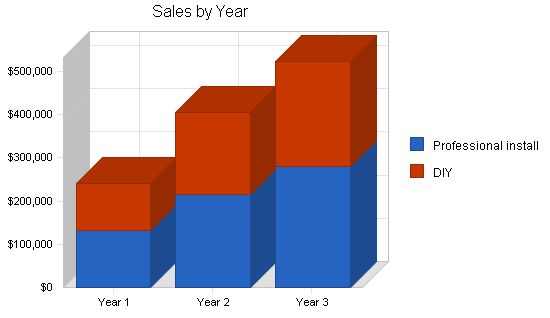
Sales Forecast
| Sales | Year 1 | Year 2 | Year 3 |
| Professional install | $131,573 | $216,025 | $279,887 |
| DIY | $108,736 | $187,942 | $243,502 |
| Total Sales | $240,309 | $403,967 | $523,389 |
5.4 Milestones
Sun Heat has several milestones to use as organizational goals. The table below provides the details.
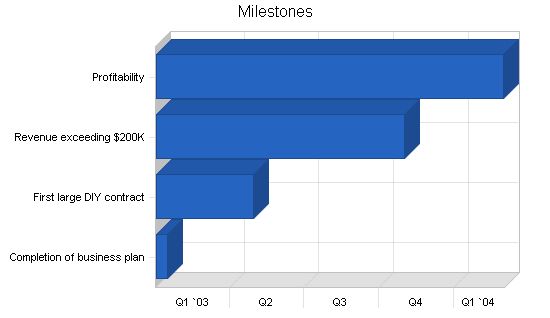
"Milestones"
Milestone Start Date End Date Budget Manager Department
Completion of business plan 1/1/2003 1/15/2003 $0 Sara Marketing
First large DIY contract 1/1/2003 4/30/2003 $0 Sales Department
Revenue exceeding $200K 1/1/2003 11/1/2003 $0 Sales Department
Profitability 1/1/2003 3/1/2004 $0 Sara Department
Totals $0
Web Plan Summary
Sun Heat will create a website to distribute product information. This will be an efficient source of disbursement since once the site is complete, maintenance costs are low and the site can serve a large number of potential users. The site will also provide technical information for current owners of Sun Heat units.
Website Marketing Strategy
The marketing and sales department will rely heavily on the website as a clearinghouse for information about Sun Heat products. Energy saving estimates, technical requirements, installations guidelines, and product comparisons will be available. All printed materials will refer to the website as an information source. Sun Heat recognizes the value of the website and will promote it accordingly.
Development Requirements
Sun Heat has identified a programmer who has the time, technical skills, and artistic vision to create Sun Heat’s site. The site will take four to six weeks to complete and then require bi-monthly updates.
Management Summary
Sara Clark will lead Sun Heat. Sara has undergraduate degrees in environmental studies and Masters in engineering and business administration. While pursuing this degree, Sara worked with a photovoltaic manufacturer and took an idea of a solar panel for charging cellular batteries from the conceptual stage to the sales stage.
Personnel Plan
– Sara: product design, component procurement, business development, marketing/sales, high level accounting.
– Sales (2): set up licensing program, installer support, retail resellers sales and support, direct sales.
– Warehouse (2): inventory, sales fulfillment.
– Customer support (1): all aspects of customer service.
– Bookkeeper (1): responsible for accounts payable/receivable and some HR functions.
Personnel Plan Year 1 Year 2 Year 3
Sara $24,000 $30,000 $36,000
Sales $22,000 $24,000 $26,000
Sales $18,000 $24,000 $26,000
Warehouse $14,300 $15,600 $15,600
Warehouse $11,700 $15,600 $15,600
Customer service $13,000 $15,600 $15,600
Bookkeeper/ HR $15,400 $16,800 $16,800
Total People 7 7 7
Total Payroll $118,400 $141,600 $151,600
The following sections will outline important financial information.
Important Assumptions
General Assumptions Year 1 Year 2 Year 3
Plan Month 1 2 3
Current Interest Rate 10.00% 10.00% 10.00%
Long-term Interest Rate 10.00% 10.00% 10.00%
Tax Rate 30.00% 30.00% 30.00%
Other 0 0 0
The Break-even Analysis indicates the monthly revenue needed to reach the break-even point.
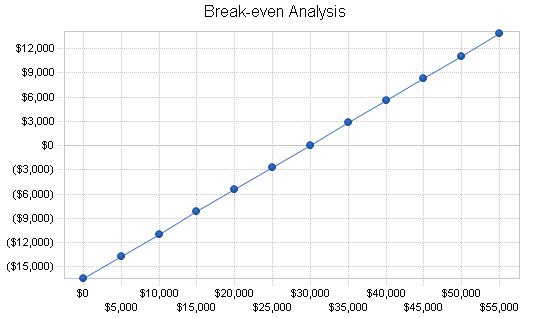
Break-even Analysis
Monthly Revenue Break-even: $29,872
Assumptions:
– Average Percent Variable Cost: 45%
– Estimated Monthly Fixed Cost: $16,430
Projected Profit and Loss:
The table below shows the projected profit and loss.
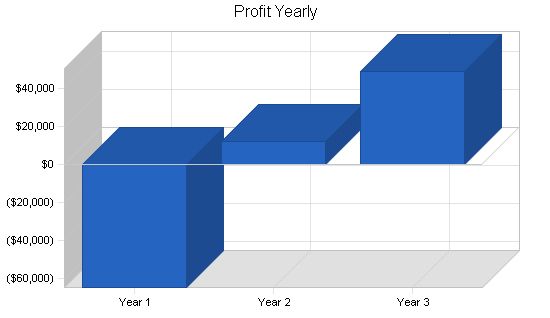
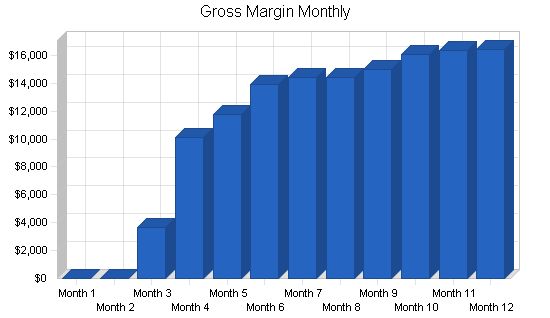
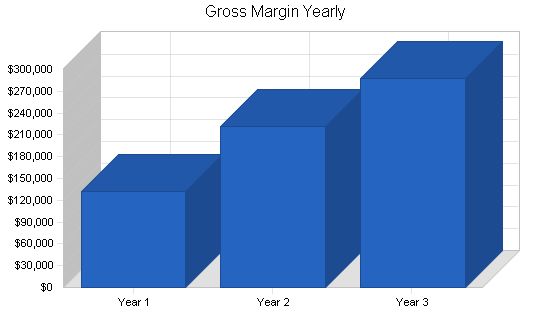
Pro Forma Profit and Loss:
| Pro Forma Profit and Loss | |||
| Year 1 | Year 2 | Year 3 | |
| Sales | $240,309 | $403,967 | $523,389 |
| Direct Cost of Sales | $108,139 | $181,785 | $235,525 |
| Other Costs of Goods | $0 | $0 | $0 |
| Total Cost of Sales | $108,139 | $181,785 | $235,525 |
| Gross Margin | $132,170 | $222,182 | $287,864 |
| Gross Margin % | 55.00% | 55.00% | 55.00% |
| Expenses | |||
| Payroll | $118,400 | $141,600 | $151,600 |
| Sales and Marketing and Other Expenses | $5,400 | $5,400 | $5,400 |
| Depreciation | $12,396 | $1,033 | $1,033 |
| Rent | $24,000 | $25,000 | $26,000 |
| Utilities | $9,000 | $750 | $750 |
| Insurance | $7,800 | $7,800 | $7,800 |
| Payroll Taxes | $17,760 | $21,240 | $22,740 |
| Other | $2,400 | $2,400 | $2,400 |
| Total Operating Expenses | $197,156 | $205,223 | $217,723 |
| Profit Before Interest and Taxes | ($64,986) | $16,959 | $70,141 |
| EBITDA | ($52,590) | $17,992 | $71,174 |
| Interest Expense | $0 | $0 | $0 |
| Taxes Incurred | $0 | $5,088 | $21,042 |
| Net Profit | ($64,986) | $11,871 | $49,099 |
| Net Profit/Sales | -27.04% | 2.94% | 9.38% |
Projected Cash Flow:
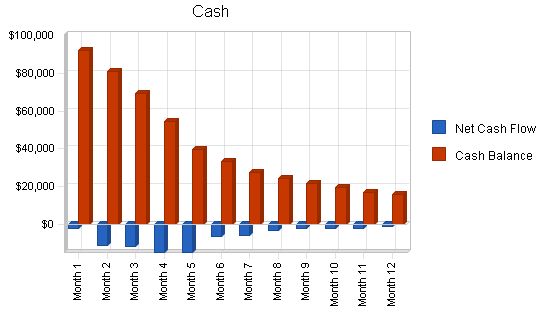
Here is the projected cash flow chart and table:
Pro Forma Cash Flow:
Year 1 Year 2 Year 3
Cash Received
Cash from Operations
Cash Sales $60,077 $100,992 $130,847
Cash from Receivables $136,262 $273,031 $370,691
Subtotal Cash from Operations $196,340 $374,022 $501,538
Additional Cash Received
Sales Tax, VAT, HST/GST Received $0 $0 $0
New Current Borrowing $0 $0 $0
New Other Liabilities (interest-free) $0 $0 $0
New Long-term Liabilities $0 $0 $0
Sales of Other Current Assets $0 $0 $0
Sales of Long-term Assets $0 $0 $0
New Investment Received $0 $0 $0
Subtotal Cash Received $196,340 $374,022 $501,538
Expenditures
Year 1 Year 2 Year 3
Expenditures from Operations
Cash Spending $118,400 $141,600 $151,600
Bill Payments $155,929 $247,529 $315,723
Subtotal Spent on Operations $274,329 $389,129 $467,323
Additional Cash Spent
Sales Tax, VAT, HST/GST Paid Out $0 $0 $0
Principal Repayment of Current Borrowing $0 $0 $0
Other Liabilities Principal Repayment $0 $0 $0
Long-term Liabilities Principal Repayment $0 $0 $0
Purchase Other Current Assets $0 $0 $0
Purchase Long-term Assets $0 $0 $0
Dividends $0 $0 $0
Subtotal Cash Spent $274,329 $389,129 $467,323
Net Cash Flow ($77,989) ($15,107) $34,215
Cash Balance $16,011 $904 $35,119
Projected Balance Sheet:
Year 1 Year 2 Year 3
Pro Forma Balance Sheet
Assets
Current Assets
Cash $16,011 $904 $35,119
Accounts Receivable $43,969 $73,914 $95,765
Other Current Assets $0 $0 $0
Total Current Assets $59,980 $74,818 $130,883
Long-term Assets
Long-term Assets $62,000 $62,000 $62,000
Accumulated Depreciation $12,396 $13,429 $14,462
Total Long-term Assets $49,604 $48,571 $47,538
Total Assets $109,584 $123,389 $178,421
Liabilities and Capital
Year 1 Year 2 Year 3
Current Liabilities
Accounts Payable $18,570 $20,504 $26,438
Current Borrowing $0 $0 $0
Other Current Liabilities $0 $0 $0
Subtotal Current Liabilities $18,570 $20,504 $26,438
Long-term Liabilities $0 $0 $0
Total Liabilities $18,570 $20,504 $26,438
Paid-in Capital $165,000 $165,000 $165,000
Retained Earnings ($9,000) ($73,986) ($62,115)
Earnings ($64,986) $11,871 $49,099
Total Capital $91,014 $102,885 $151,984
Total Liabilities and Capital $109,584 $123,389 $178,421
Net Worth $91,014 $102,885 $151,984
Year 1 Year 2 Year 3 Industry Profile
Ratio Analysis
Sales Growth 0.00% 68.10% 29.56% 10.72%
Percent of Total Assets
Accounts Receivable 40.12% 59.90% 53.67% 10.41%
Other Current Assets 0.00% 0.00% 0.00% 40.72%
Total Current Assets 54.73% 60.64% 73.36% 51.79%
Long-term Assets 45.27% 39.36% 26.64% 48.21%
Total Assets 100.00% 100.00% 100.00% 100.00%
Current Liabilities
Accounts Payable 16.95% 16.62% 14.82% 12.65%
Long-term Liabilities 0.00% 0.00% 0.00% 40.12%
Total Liabilities 16.95% 16.62% 14.82% 52.77%
Net Worth 83.05% 83.38% 85.18% 47.23%
Percent of Sales
Sales 100.00% 100.00% 100.00% 100.00%
Gross Margin 55.00% 55.00% 55.00% 47.48%
Selling, General & Administrative Expenses 82.04% 52.06% 45.62% 13.69%
Advertising Expenses 0.00% 0.00% 0.00% 0.03%
Profit Before Interest and Taxes -27.04% 4.20% 13.40% 9.26%
Main Ratios
Current 3.23 3.65 4.95 2.10
Quick 3.23 3.65 4.95 1.69
Total Debt to Total Assets 16.95% 16.62% 14.82% 60.03%
Pre-tax Return on Net Worth -71.40% 16.48% 46.15% 7.72%
Pre-tax Return on Assets -59.30% 13.74% 39.31% 19.31%
Additional Ratios
Net Profit Margin -27.04% 2.94% 9.38% n.a
Return on Equity -71.40% 11.54% 32.31% n.a
Activity Ratios
Accounts Receivable Turnover 4.10 4.10 4.10 n.a
Collection Days 56 71 79 n.a
Accounts Payable Turnover 9.40 12.17 12.17 n.a
Payment Days 27 29 27 n.a
Total Asset Turnover 2.19 3.27 2.93 n.a
Debt Ratios
Debt to Net Worth 0.20 0.20 0.17 n.a
Current Liabilities to Liabilities 1.00 1.00 1.00 n.a
Liquidity Ratios
Net Working Capital $41,410 $54,314 $104,446 n.a
Interest Coverage 0.00 0.00 0.00 n.a
Additional Ratios
Assets to Sales 0.46 0.31 0.34 n.a
Current Debt/Total Assets 17% 17% 15% n.a
Acid Test 0.86 0.04 1.33 n.a
Sales/Net Worth 2.64 3.93 3.44 n.a
Dividend Payout 0.00 0.00 0.00 n.a
Appendix:
Sales Forecast
Month 1 Month 2 Month 3 Month 4 Month 5 Month 6 Month 7 Month 8 Month 9 Month 10 Month 11 Month 12
Sales
Professional install $0 $0 $6,589 $9,854 $11,454 $13,545 $13,989 $14,022 $14,585 $15,655 $15,878 $16,002
DIY $0 $0 $0 $8,573 $9,965 $11,784 $12,170 $12,199 $12,689 $13,620 $13,814 $13,922
Total Sales $0 $0 $6,589 $18,427 $21,419 $25,329 $26,159 $26,221 $27,274 $29,275 $29,692 $29,924
Direct Cost of Sales
Month 1 Month 2 Month 3 Month 4 Month 5 Month 6 Month 7 Month 8 Month 9 Month 10 Month 11 Month 12
Professional install $0 $0 $2,965 $4,434 $5,154 $6,095 $6,295 $6,310 $6,563 $7,045 $7,145 $7,201
DIY $0 $0 $0 $3,858 $4,484 $5,303 $5,477 $5,490 $5,710 $6,129 $6,216 $6,265
Subtotal Direct Cost of Sales $0 $0 $2,965 $8,292 $9,639 $11,398 $11,772 $11,800 $12,273 $13,174 $13,361 $13,466
Personnel Plan:
Sara: 0%, $2,000 for months 1-12
Sales: 0%, $0 for month 1, $2,000 for months 2-12
Sales: 0%, $0 for months 1-3, $2,000 for months 4-12
Warehouse: 0%, $0 for months 1-3, $1,300 for months 4-12
Warehouse: 0%, $0 for months 1-3, $1,300 for months 4-12
Customer service: 0%, $0 for months 1-2, $1,300 for months 3-12
Bookkeeper/HR: 0%, $0 for month 1, $1,400 for months 2-12
Total People: 1 for month 1, 4 for month 2, 5 for month 3, 7 for months 4-12
Total Payroll: $2,000 for month 1, $6,700 for month 2, $8,000 for month 3, $11,300 for months 4-12
General Assumptions:
Plan Month: 1 for month 1-12
Current Interest Rate: 10.00% for month 1-12
Long-term Interest Rate: 10.00% for month 1-12
Tax Rate: 30.00% for month 1-12
Other: 0 for month 1-12
Pro Forma Profit and Loss:
Sales: $0 for months 1-2, $6,589 for month 3, $18,427 for month 4, $21,419 for month 5, $25,329 for month 6, $26,159 for month 7, $26,221 for month 8, $27,274 for month 9, $29,275 for month 10, $29,692 for month 11, $29,924 for month 12
Direct Cost of Sales: $0 for months 1-2, $2,965 for month 3, $8,292 for month 4, $9,639 for month 5, $11,398 for month 6, $11,772 for month 7, $11,800 for month 8, $12,273 for month 9, $13,174 for month 10, $13,361 for month 11, $13,466 for month 12
Other Costs of Goods: $0 for months 1-12
Total Cost of Sales: $0 for months 1-2, $2,965 for month 3, $8,292 for month 4, $9,639 for month 5, $11,398 for month 6, $11,772 for month 7, $11,800 for month 8, $12,273 for month 9, $13,174 for month 10, $13,361 for month 11, $13,466 for month 12
Gross Margin: $0 for months 1-2, $3,624 for month 3, $10,135 for month 4, $11,780 for month 5, $13,931 for month 6, $14,388 for month 7, $14,422 for month 8, $15,001 for month 9, $16,101 for month 10, $16,331 for month 11, $16,458 for month 12
Gross Margin %: 0.00% for months 1-2, 55.00% for months 3-12
Expenses:
Payroll: $2,000 for month 1, $6,700 for month 2, $8,000 for month 3, $11,300 for months 4-12
Sales and Marketing and Other Expenses: $450 for months 1-12
Depreciation: $1,033 for months 1-12
Rent: $2,000 for months 1-12
Utilities: $750 for months 1-12
Insurance: $650 for months 1-12
Payroll Taxes: 15%, $300 for month 1, $1,005 for month 2, $1,200 for month 3, $1,695 for months 4-12
Other: $200 for months 1-12
Total Operating Expenses: $7,383 for month 1, $12,788 for month 2, $14,283 for month 3, $18,078 for months 4-12
Profit Before Interest and Taxes: ($7,383) for month 1, ($12,788) for month 2, ($10,659) for month 3, ($7,943) for months 4-12
EBITDA: ($6,350) for month 1, ($11,755) for month 2, ($9,626) for month 3, ($6,910) for months 4-12
Interest Expense: $0 for months 1-12
Taxes Incurred: $0 for months 1-12
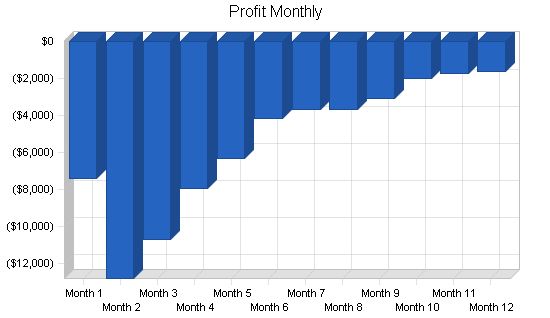
Net Profit: ($7,383) for month 1, ($12,788) for month 2, ($10,659) for month 3, ($7,943) for months 4-12
Net Profit/Sales: 0.00% for months 1-2, -161.77% for month 3, -43.11% for month 4, -29.40% for month 5, -16.37% for month 6, -14.11% for month 7, -13.94% for month 8, -11.28% for month 9, -6.75% for month 10, -5.89% for month 11, -5.41% for month 12
Pro Forma Cash Flow
| Month 1 | Month 2 | Month 3 | Month 4 | Month 5 | Month 6 | Month 7 | Month 8 | Month 9 | Month 10 | Month 11 | Month 12 | ||
| Cash Received | |||||||||||||
| Cash Sales | $0 | $0 | $1,647 | $4,607 | $5,355 | $6,332 | $6,540 | $6,555 | $6,818 | $7,319 | $7,423 | $7,481 | |
| Cash from Receivables | $0 | $0 | $0 | $165 | $5,238 | $13,895 | $16,162 | $19,018 | $19,621 | $19,692 | $20,505 | $21,967 | |
| Subtotal Cash from Operations | $0 | $0 | $1,647 | $4,771 | $10,592 | $20,227 | $22,702 | $25,573 | $26,440 | $27,011 | $27,928 | $29,447 | |
| Additional Cash Received | |||||||||||||
| Sales Tax, VAT, HST/GST Received | 0.00% | $0 | $0 | $0 | $0 | $0 | $0 | $0 | $0 | $0 | $0 | $0 | |
| New Current Borrowing | $0 | $0 | $0 | $0 | $0 | $0 | $0 | $0 | $0 | $0 | $0 | $0 | |
| New Other Liabilities (interest-free) | $0 | $0 | $0 | $0 | $0 | $0 | $0 | $0 | $0 | $0 | $0 | $0 | |
| New Long-term Liabilities | $0 | $0 | $0 | $0 | $0 | $0 | $0 | $0 | $0 | $0 | $0 | $0 | |
| Sales of Other Current Assets | $0 | $0 | $0 | $0 | $0 | $0 | $0 | $0 | $0 | $0 | $0 | $0 | |
| Sales of Long-term Assets | $0 | $0 | $0 | $0 | $0 | $0 | $0 | $0 | $0 | $0 | $0 | $0 | |
| New Investment Received | $0 | $0 | $0 | $0 | $0 | $0 | $0 | $0 | $0 | $0 | $0 | $0 | |
| Subtotal Cash Received | $0 | $0 | $1,647 | $4,771 | $10,592 | $20,227 | $22,702 | $25,573 | $26,440 | $27,011 | $27,928 | $29,447 | |
| Expenditures | Month 1 | Month 2 | Month 3 | Month 4 | Month 5 | Month 6 | Month 7 | Month 8 | Month 9 | Month 10 | Month 11 | Month 12 | |
| Expenditures from Operations | |||||||||||||
| Cash Spending | $2,000 | $6,700 | $8,000 | $11,300 | $11,300 | $11,300 | $11,300 | $11,300 | $11,300 | $11,300 | $11,300 | $11,300 | |
| Bill Payments | $145 | $4,374 | $5,160 | $8,409 | $14,082 | $15,442 | $17,156 | $17,518 | $17,560 | $18,048 | $18,925 | $19,110 | |
| Subtotal Spent on Operations | $2,145 | $11,074 | $13,160 | $19,709 | $25,382 | $26,742 | $28,456 | $28,818 | $28,860 | $29,348 | $30,225 | $30,410 | |
| Additional Cash Spent | |||||||||||||
| Sales Tax, VAT, HST/GST Paid Out | $0 | $0 | $0 | $0 | $0 | $0 | $0 | $0 | $0 | $0 | $0 | $0 | |
| Principal Repayment of Current Borrowing | $0 | $0 | $0 | $0 | $0 | $0 | $0 | $0 | $0 | $0 | $0 | $0 | |
| Other Liabilities Principal Repayment | $0 | $0 | $0 | $0 | $0 | $0 | $0 | $0 | $0 | $0 | $0 | $0 | |
| Long-term Liabilities Principal Repayment | $0 | $0 | $0 | $0 | $0 | $0 | $0 | $0 | $0 | $0 | $0 | $0 | |
| Purchase Other Current Assets | $0 | $0 | $0 | $0 | $0 | $0 | $0 | $0 | $0 | $0 | $0 | $0 | |
| Purchase Long-term Assets | $0 | $0 | $0 | $0 | $0 | $0 | $0 | $0 | $0 | $0 | $0 | $0 | |
| Dividends | $0 | $0 | $0 | $0 | $0 | $0 | $0 | $0 | $0 | $0 | $0 | $0 | |
| Subtotal Cash Spent | $2,145 | $11,074 | $13,160 | $19,709 | $25,382 | $26,742 | $28,456 | $28,818 | $28,860 | $29,348 | $30,225 | $30,410 | |
| Net Cash Flow | ($2,145) | ($11,074) | ($11,513) | ($14,938) | ($14,790) | ($6,515) | ($5,754) | ($3,245) | ($2,421) | ($2,337) |
Hello!
I’m Andrew Brooks, a seasoned finance consultant from the USA and the mind behind phonenumber247.com.
My career is built on a foundation of helping individuals and businesses thrive financially in an ever-changing economic landscape. At phonenumber247.com, my aim is to demystify the complex world of finance, providing clear, actionable advice that can help you navigate your financial journey with confidence. Whether it’s personal finance management, investment strategies, or understanding the nuances of market dynamics, I’m here to share insights and tools that can propel you towards your financial goals.
Welcome to my digital space, where every piece of advice is a step closer to financial clarity and success!
