Organic Food Store Business Plan
Last Frontier Market offers customers organic and locally grown produce, chemical- and preservative-free groceries, cruelty-free body care, and eco-household products. Our products are healthy alternatives to those found at conventional grocery chains. Located in the heart of the growing Willow Creek section of Richmond, the market serves a community of 25,000 residents. The market was created in response to the growing demand for a local natural food store.
Last Frontier Market benefits from the foot traffic in the Willow Creek retail area, which is home to the Willow Creek Arts and Craft Fair, as well as numerous art and craft shops. The area has a reputation for supporting progressive causes and businesses. The market provides a comfortable place for the community to meet and shop.
Additionally, the market is the most convenient option in the area, as the closest competing natural food store is a twenty-minute drive away.
Last Frontier Market is committed to giving back to the community. We will participate in community projects and host fundraisers for local community services.
Contents
1.1 Objectives
- Provide customers with fresh, organically grown fruits and vegetables.
- Offer foods without artificial colors, flavors, or additives.
- Sell earth-friendly cleansers, natural supplements, and cruelty-free body care products.
- Support organic farms that preserve our earth and water.
1.2 Mission
The Last Frontier Market is committed to providing the highest quality, fresh and natural food, health, and wellness products. Our staff is friendly, eager to serve, and ready to educate.
Company Summary
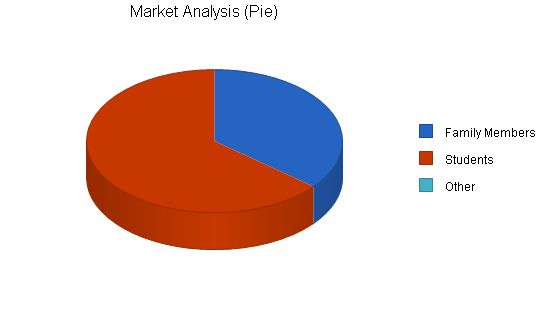
Last Frontier Market is a vegetarian health food store in the Willow Creek section of Richmond. The community of 25,000 residents consists of students attending the State University and families attracted to the new home construction in the area.
Co-owners Josh Wingard and Mary Stevens are opening Last Frontier Market to meet the growing demand in the community for a local food store that offers organic and locally grown produce, chemical and preservative-free groceries, cruelty-free body care, and eco-household products.
2.1 Company Ownership
Last Frontier Market is owned by Josh Wingard and Mary Stevens.
2.2 Start-up Summary
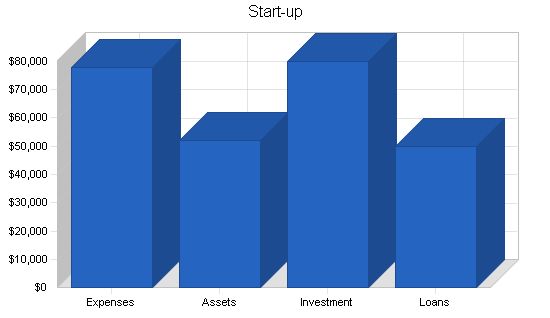
The start-up cost of Last Frontier Market will primarily consist of inventory and display equipment. Josh Wingard and Mary Stevens will invest $80,000 and secure a $50,000 SBA loan.
Start-up Funding
Start-up Expenses to Fund: $77,800
Start-up Assets to Fund: $52,200
Total Funding Required: $130,000
Assets
Non-cash Assets from Start-up: $10,000
Cash Requirements from Start-up: $42,200
Additional Cash Raised: $0
Cash Balance on Starting Date: $42,200
Total Assets: $52,200
Liabilities and Capital
Liabilities
Current Borrowing: $0
Long-term Liabilities: $50,000
Accounts Payable (Outstanding Bills): $0
Other Current Liabilities (interest-free): $0
Total Liabilities: $50,000
Capital
Planned Investment: Josh Wingard and Mary Stevens: $80,000
Other: $0
Additional Investment Requirement: $0
Total Planned Investment: $80,000
Loss at Start-up (Start-up Expenses): ($77,800)
Total Capital: $2,200
Total Capital and Liabilities: $52,200
Total Funding: $130,000
Start-up
Requirements
Start-up Expenses
Legal: $1,000
Insurance: $0
Rent: $1,800
Start-Up Inventory: $40,000
Display Set-Up: $5,000
Cash Reserve for Hiring: $30,000
Advertising: $0
Other: $0
Total Start-up Expenses: $77,800
Start-up Assets
Cash Required: $42,200
Other Current Assets: $0
Long-term Assets: $10,000
Total Assets: $52,200
Total Requirements: $130,000
Products
The Last Frontier Market will offer customers organic and locally grown produce, chemical- and preservative-free groceries, cruelty-free body care, and eco-household products. The products are:
-Free of artificial preservatives
-Free of artificial colors
-Free of chemical additives
-Organically grown, whenever possible
-The least processed or unadulterated version available
-Non-irradiated
-Cruelty-free
Market Analysis Summary
In the past ten years, the Willow Creek section of Richmond has experienced tremendous growth. The growing student community combined with the new families in the area provide a strong customer base for the Last Frontier Market.
Currently, the area is served by two major supermarkets that do not offer the same product lines as the Last Frontier Market. The closest natural food store is a twenty-minute drive away.
Josh Wingard and Mary Stevens believe that a local natural food store in the Willow Creek area would be competitive and provide customers with a product selection that encourages repeat business.
Market Segmentation
The Last Frontier Market will focus on two significant customer groups:
-Families: Many young families are moving into the Willow Creek area due to its unique community environment. The community hosts the Willow Creek Craft Fair, which attracts shoppers each weekend. The proximity to the university also draws young families where one or both parents are university students or employees. These families are a strong customer base for the Last Frontier Market.
-Students: A significant number of students prefer to shop at a natural food store. The Last Frontier Market’s location within walking distance of most area residents and its convenience on the way home from classes makes it an ideal shopping destination.
Market Analysis
| Market Analysis | |||||||
| Year 1 | Year 2 | Year 3 | Year 4 | Year 5 | |||
| Potential Customers | Growth | CAGR | |||||
| Family Members | 15% | 9,000 | 10,350 | 11,903 | 13,688 | 15,741 | 15.00% |
| Students | 10% | 16,000 | 17,600 | 19,360 | 21,296 | 23,426 | 10.00% |
| Other | 0% | 0 | 0 | 0 | 0 | 0 | 0.00% |
| Total | 11.88% | 25,000 | 27,950 | 31,263 | 34,984 | 39,167 | 11.88% |
Strategy and Implementation Summary
The Last Frontier Market will promote the store opening with live music and food in the store’s parking lot for the opening weekend. The Willow Creek Craft Fair is adjacent to our store, ensuring excellent foot traffic for our opening.
We will advertise in the university daily student newspaper and the local area advertising flyer. The advertisements for the market opening will include a 20% off coupon for purchases over twenty dollars. This discount will be available for the first month of operation.
The Last Frontier Market will actively participate in community projects, such as the area’s food bank and community programs for children. We will also host a number of community events, including charity pancake brunches, dog washes benefiting local humane societies, and benefit barbecues.
5.1 Competitive Edge
The Last Frontier Market’s competitive edge includes its location in the heart of the Willow Creek section of Richmond, with strong foot traffic in the area. It is the closest natural food store, only a twenty-minute drive away.
Additionally, The Last Frontier Market is committed to giving back to the community through participation in community projects, charity events, and supporting local humane societies.
To develop effective business strategies, perform a SWOT analysis of your business using our free guide and template.
5.2 Sales Strategy
The sales strategy of The Last Frontier Market focuses on creating a community-friendly store that is easy to navigate, with knowledgeable staff to assist customers. The store will provide a space where customers can comfortably spend time, reading notices on the community bulletin board or chatting with friends.
5.2.1 Sales Forecast
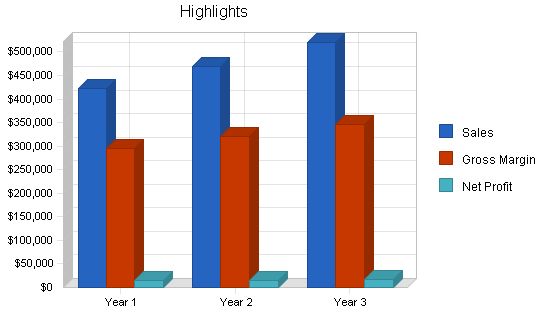
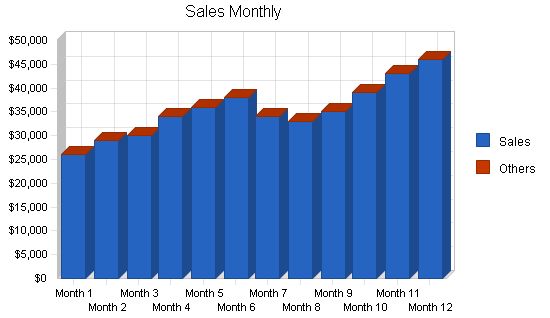
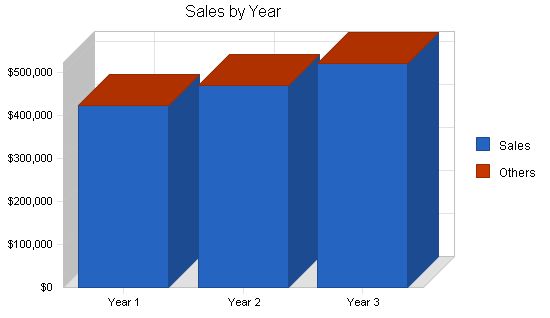
Here is The Last Frontier Market’s sales forecast for three years.
Sales Forecast
Year 1 Year 2 Year 3
Sales $423,000 $470,000 $520,000
Others $0 $0 $0
Total Sales $423,000 $470,000 $520,000
Direct Cost of Sales
Year 1 Year 2 Year 3
Sales $128,220 $150,000 $175,000
Others $0 $0 $0
Subtotal Direct Cost of Sales $128,220 $150,000 $175,000
Management Summary
Co-owners, Josh Wingard and Mary Stevens, have fifteen years of experience working in natural food stores.
Mary Stevens was one of the founding members of the Mason Peak Natural Grocery, 4th and Tyler. The grocery was established in 1992 by the non-profit NEDCO, the Neighborhood Economic Development Corporation, and concerned neighbors to save the historic Mason Peak Market from destruction. Mary started as a cashier and advanced to store manager in 1996. The grocery has grown into a community fixture under her management.
Josh Wingard ran the university’s now defunct Natural Food Collective for three years before the program was defunded. The small on-campus store provided natural food products to student customers. Sales increased by 20% each year under his leadership. Unfortunately, the state budget shortfall impacted the continued funding of the program. Prior to this position, Josh worked at Sunburst Natural Foods for four years. His responsibilities were product ordering and stocking.
6.1 Management Team
Josh Wingard and Mary Stevens are the management team for the Last Frontier Market. Mary will be responsible for staffing and daily operations. Josh will handle product ordering, stocking, and bookkeeping.
6.2 Personnel Plan
Besides Josh Wingard and Mary Stevens, the Last Frontier Market will have a staff of five:
– Three cashiers
– Two produce staff
Personnel Plan
Year 1 Year 2 Year 3
Mary Stevens $33,600 $36,000 $39,000
Josh Wingard $33,600 $36,000 $39,000
Cashiers $84,000 $95,000 $104,000
Produce Staff $48,000 $51,000 $54,000
Total People 7 7 7
Total Payroll $199,200 $218,000 $236,000
The following is the Financial Plan for the Last Frontier Market.
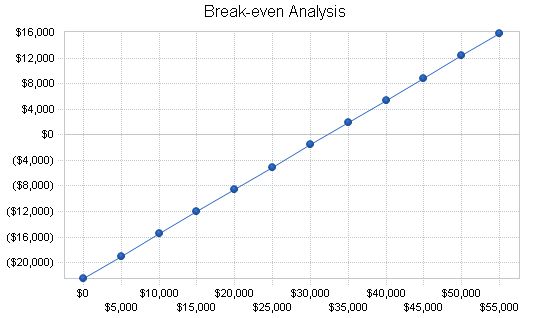
The monthly break-even point is $32,277.
Break-even Analysis:
Monthly Revenue Break-even: $32,277
Assumptions:
– Average Percent Variable Cost: 30%
– Estimated Monthly Fixed Cost: $22,493
7.2 Projected Profit and Loss:
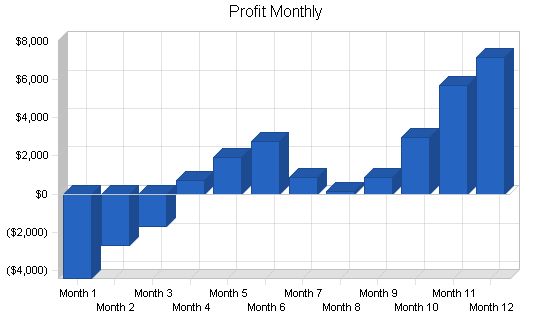
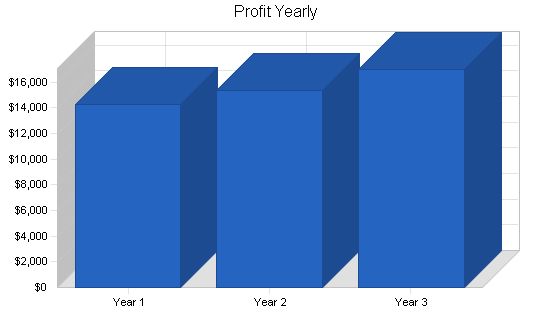
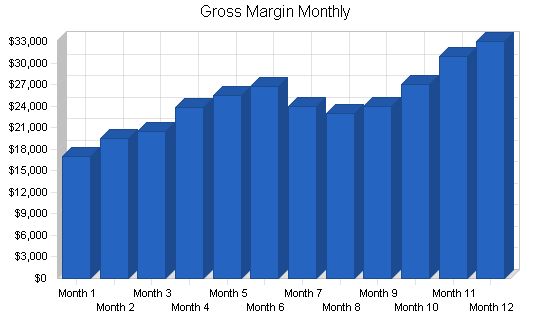
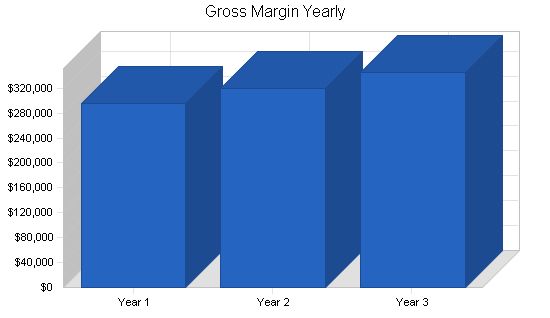
The table and charts below outline the projected profit and loss for three years.
Pro Forma Profit and Loss
Year 1 Year 2 Year 3
Sales $423,000 $470,000 $520,000
Direct Cost of Sales $128,220 $150,000 $175,000
Other Production Expenses $0 $0 $0
Total Cost of Sales $128,220 $150,000 $175,000
Gross Margin $294,780 $320,000 $345,000
Gross Margin % 69.69% 68.09% 66.35%
Expenses
Payroll $199,200 $218,000 $236,000
Sales and Marketing and Other Expenses $7,000 $10,000 $13,000
Depreciation $1,440 $1,440 $1,440
Leased Equipment $0 $0 $0
Utilities $4,800 $4,800 $4,800
Insurance $6,000 $6,000 $6,000
Rent $21,600 $21,600 $21,600
Payroll Taxes $29,880 $32,700 $35,400
Other $0 $0 $0
Total Operating Expenses $269,920 $294,540 $318,240
Profit Before Interest and Taxes $24,860 $25,460 $26,760
EBITDA $26,300 $26,900 $28,200
Interest Expense $4,459 $3,501 $2,501
Taxes Incurred $6,120 $6,588 $7,278
Net Profit $14,281 $15,372 $16,981
Net Profit/Sales 3.38% 3.27% 3.27%
7.3 Projected Cash Flow
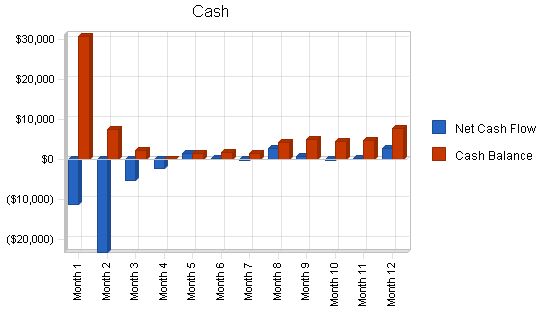
The following table and chart highlight the projected cash flow for three years.
Pro Forma Cash Flow
| Cash Flow | |||
| Year 1 | Year 2 | Year 3 | |
| Cash Received | |||
| Cash from Operations | |||
| Cash Sales | $105,750 | $117,500 | $130,000 |
| Cash from Receivables | $251,575 | $345,203 | $382,237 |
| Subtotal Cash from Operations | $357,325 | $462,703 | $512,237 |
| Additional Cash Received | |||
| Sales Tax, VAT, HST/GST Received | $0 | $0 | $0 |
| New Current Borrowing | $0 | $0 | $0 |
| New Other Liabilities (interest-free) | $0 | $0 | $0 |
| New Long-term Liabilities | $0 | $0 | $0 |
| Sales of Other Current Assets | $0 | $0 | $0 |
| Sales of Long-term Assets | $0 | $0 | $0 |
| New Investment Received | $4,000 | $0 | $0 |
| Subtotal Cash Received | $361,325 | $462,703 | $512,237 |
| Expenditures | Year 1 | Year 2 | Year 3 |
| Expenditures from Operations | |||
| Cash Spending | $199,200 | $218,000 | $236,000 |
| Bill Payments | $186,715 | $237,222 | $263,081 |
| Subtotal Spent on Operations | $385,915 | $455,222 | $499,081 |
| Additional Cash Spent | |||
| Sales Tax, VAT, HST/GST Paid Out | $0 | $0 | $0 |
| Principal Repayment of Current Borrowing | $0 | $0 | $0 |
| Other Liabilities Principal Repayment | $0 | $0 | $0 |
| Long-term Liabilities Principal Repayment | $9,996 | $9,996 | $9,996 |
| Purchase Other Current Assets | $0 | $0 | $0 |
| Purchase Long-term Assets | $0 | $0 | $0 |
| Dividends | $0 | $0 | $0 |
| Subtotal Cash Spent | $395,911 | $465,218 | $509,077 |
| Net Cash Flow | ($34,586) | ($2,515) | $3,160 |
| Cash Balance | $7,614 | $5,099 | $8,259 |
7.4 Projected Balance Sheet
The projected balance sheet for three years is shown below:
| Balance Sheet | |||
| Year 1 | Year 2 | Year 3 | |
| Assets | |||
| Current Assets | |||
| Cash | $7,614 | $5,099 | $8,259 |
| Accounts Receivable | $65,675 | $72,972 | $80,735 |
| Other Current Assets | $0 | $0 | $0 |
| Total Current Assets | $73,289 | $78,071 | $88,994 |
| Long-term Assets | |||
| Long-term Assets | $10,000 | $10,000 | $10,000 |
| Accumulated Depreciation | $1,440 | $2,880 | $4,320 |
| Total Long-term Assets | $8,560 | $7,120 | $5,680 |
| Total Assets | $81,849 | $85,191 | $94,674 |
| Liabilities and Capital | Year 1 | Year 2 | Year 3 |
| Current Liabilities | |||
| Accounts Payable | $21,364 | $19,331 | $21,828 |
| Current Borrowing | $0 | $0 | $0 |
| Other Current Liabilities | $0 | $0 | $0 |
| Subtotal Current Liabilities | $21,364 | $19,331 | $21,828 |
| Long-term Liabilities | $40,004 | $30,008 | $20,012 |
| Total Liabilities | $61,368 | $49,339 | $41,840 |
| Paid-in Capital | $84,000 | $84,000 | $84,000 |
| Retained Earnings | ($77,800) | ($63,519) | ($48,147) |
| Earnings | $14,281 | $15,372 | $16,981 |
| Total Capital | $20,481 | $35,853 | $52,834 |
| Total Liabilities and Capital | $81,849 | $85,191 | $94,674 |
| Net Worth | $20,481 | $35,853 | $52,834 |
7.5 Business Ratios
The following table shows the business ratios for the years of this plan, with industry profile ratios for comparison.
| Ratio Analysis | ||||
| Year 1 | Year 2 | Year 3 | Industry Profile | |
| Sales Growth | 0.00% | 11.11% | 10.64% | 4.60% |
| Percent of Total Assets | ||||
| Accounts Receivable | 80.24% | 85.66% | 85.28% | 33.30% |
| Other Current Assets | 0.00% | 0.00% | 0.00% | 20.90% |
| Total Current Assets | 89.54% | 91.64% | 94.00% | 80.20% |
| Long-term Assets | 10.46% | 8.36% | 6.00% | 19.80% |
| Total Assets | 100.00% | 100.00% | 100.00% | 100.00% |
| Current Liabilities | 26.10% | 22.69% | 23.06% | 45.20% |
| Long-term Liabilities | 48.88% | 35.22% | 21.14% | 10.00% |
| Total Liabilities | 74.98% | 57.92% | 44.19% | 55.20% |
| Net Worth | 25.02% | 42.08% | 55.81% | 44.80% |
| Percent of Sales | ||||
| Sales | 100.00% | 100.00% | 100.00% | 100.00% |
| Gross Margin | 69.69% | 68.09% | 66.35% | 44.10% |
| Selling, General & Administrative Expenses | 66.31% | 64.81% | 63.08% | 26.70% |
| Advertising Expenses | 1.65% | 2.13% | 2.50% | 0.70% |
| Profit Before Interest and Taxes | 5.88% | 5.42% | 5.15% | 0.80% |
Hello!
I’m Andrew Brooks, a seasoned finance consultant from the USA and the mind behind phonenumber247.com.
My career is built on a foundation of helping individuals and businesses thrive financially in an ever-changing economic landscape. At phonenumber247.com, my aim is to demystify the complex world of finance, providing clear, actionable advice that can help you navigate your financial journey with confidence. Whether it’s personal finance management, investment strategies, or understanding the nuances of market dynamics, I’m here to share insights and tools that can propel you towards your financial goals.
Welcome to my digital space, where every piece of advice is a step closer to financial clarity and success!
