Contents
Musical Instrument Store Business Plan
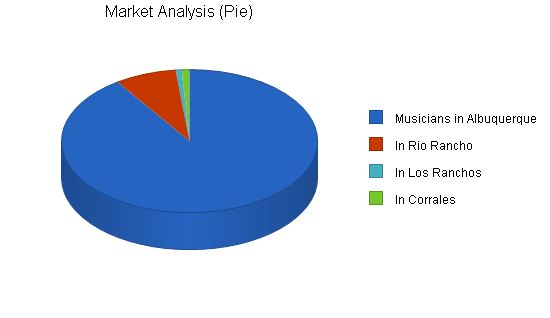
There is an exciting opportunity for a full-service musical instrument retailer in Albuquerque. While there are several musical instrument retailers in this city of over 500,000 people, there are only three small school band and orchestral instrument dealers with limited selections and hours. On the other hand, big chains with a focus on guitars and electrical instruments are competing on prices, neglecting customer service.
MusicWest will provide a superior shopping experience with a vast selection of school band and orchestra instruments, as well as guitars, keyboards, and accessories, at reasonable prices. Our products will be backed by skilled repair services and a knowledgeable and friendly staff who prioritize customer education. We will stand out from our competitors by offering ongoing music community events, such as free lessons, music clubs, and after-sale follow-ups to cultivate long-term customer relationships. Our unique marketing schemes include “You Play, We Pay” (donating a portion of instrument sales and rentals to local school band programs) and “100% Money Back” trade-up programs, allowing customers to upgrade their instruments within a year by receiving 100% of their purchase price as credit.
MusicWest will cater to the novice, hobbyist, and semi-professional musicians who value customer service, knowledgeable assistance, and affordable options when making significant purchases. By differentiating ourselves from competitors, we will quickly gain a sizable market share. Our branding will be established through superior service, an inviting retail environment, interactive merchandising, and a compelling motto: Stop Dreaming, Start Playing. Once customers experience our store, they will want to return for the exceptional treatment they won’t find elsewhere.
Co-owner, David Moore, brings over seven years of experience as a store manager at two successful local music stores. He has firsthand knowledge of missed opportunities due to lack of follow-through or planning and understands the needs of local customers.
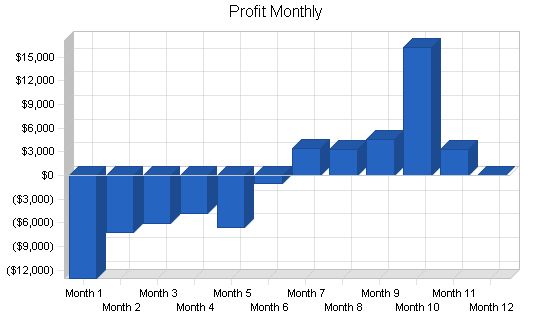
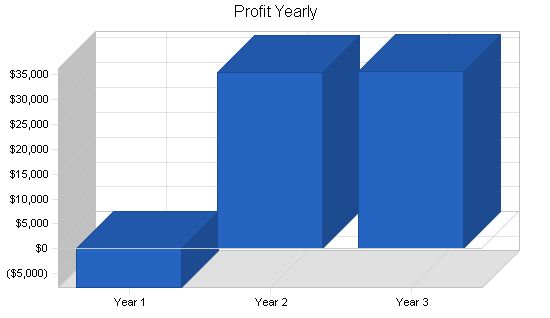
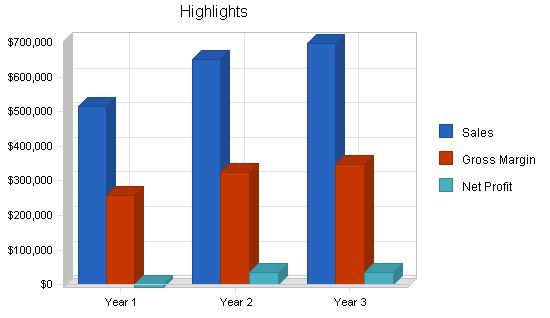
Based on experience at other local music stores, David Moore conservatively projects sales of over $500,000 in the first year, increasing to nearly $700,000 by year three. We anticipate generating a profit starting in September, with increasing profits thereafter.
Although MusicWest may not become the largest, our goal is to become a “Must-Shop Destination” for anyone looking to buy a new or used musical instrument in Albuquerque!
MusicWest is a musical instrument retailer in Albuquerque’s Westside. We set ourselves apart from competitors by providing personal attention and educating customers about our products. We also offer loyalty programs and on-site repair services. Our goal is to have the largest selection of School Band and Orchestral instruments in New Mexico.
Start-up Expenses:
– Legal: $1,000
– Stationery etc.: $500
– Space Renovation/Preparation/Signage: $20,000
– Miscellaneous Expenses: $1,500
– Insurance: $500
– Rent & Deposits: $4,000
– Pre-Opening Salaries: $4,000
– Phone System: $2,500
– Other: $0
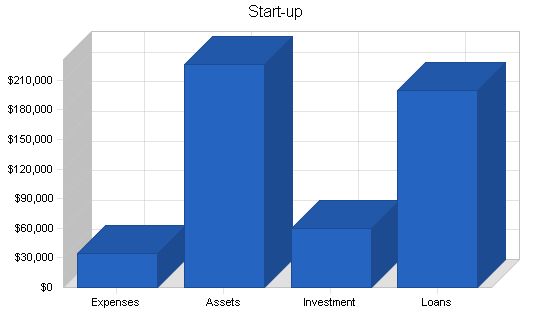
– Total Start-up Expenses: $34,000
Start-up Assets:
– Cash Required: $68,500
– Start-up Inventory: $150,000
– Other Current Assets: $0
– Long-term Assets: $7,500
– Total Assets: $226,000
Total Requirements: $260,000
Start-up Funding:
– Start-up Expenses to Fund: $34,000
– Start-up Assets to Fund: $226,000
– Total Funding Required: $260,000
Assets:
– Non-cash Assets from Start-up: $157,500
– Cash Requirements from Start-up: $68,500
– Additional Cash Raised: $0
– Cash Balance on Starting Date: $68,500
– Total Assets: $226,000
Liabilities and Capital:
– Liabilities:
– Current Borrowing: $0
– Long-term Liabilities: $200,000
– Accounts Payable (Outstanding Bills): $0
– Other Current Liabilities (interest-free): $0
– Total Liabilities: $200,000
– Capital:
– Planned Investment
– Investment by Dave & Kayle Moore: $50,000
– Investment by Ray Himes: $10,000
– Additional Investment Requirement: $0
– Total Planned Investment: $60,000
– Loss at Start-up (Start-up Expenses): ($34,000)
– Total Capital: $26,000
– Total Capital and Liabilities: $226,000
– Total Funding: $260,000
Company Locations and Facilities:
We have chosen a site at Ladera Shopping Center on Coors Blvd. near I-40 for several reasons:
– Close proximity to Interstate 40.
– Safe and plentiful parking area.
– Near high-traffic tenants such as Home Depot and Staples, and anchored by a WalMart Supercenter.
– Beneficial demographics: over 150,000 households within a 5-mile radius, 85,000+ cars per day on the two cross-streets, and no direct competitors within 10 miles.
– All of the above qualities are consistent with MusicWest’s goal of providing a fresh approach to musical instrument retailing. We are looking at leasing approximately 3,500 sq.ft. of space, which will allow sufficient room for up to six lesson studios, a repair area, and necessary storage and office space. We expect usable selling space to end up being around 2,400 sq.ft.
Company Ownership:
MusicWest will be a partnership. The principles of the business are Kayle and David Moore. Kayle Moore will assume the position of President/Office Manager, while David Moore will assume the duties of Store Manager.
Products and Services:
MusicWest will sell new and used musical instruments and accessories. Our primary items will be new band and orchestral instruments, electric and acoustic guitars, amplifiers, and electronic keyboards. In addition, we will have a full-service, on-site repair and customization department (band instruments, guitars, and electronics).
We will offer a music lesson program featuring top degreed instructors, including private and group lessons. We will also develop music clubs geared towards children and seniors to serve our local community.
Although offering school band and orchestral instruments, service and lessons will be our main competitive advantage. Guitars will remain the primary revenue producer for musical instrument stores.
Product and Service Description:
MusicWest will offer several name brand instruments such as a large selection of band instruments by Selmer/Bach, Yamaha, and Leblanc with an emphasis on the intermediate level instruments. In addition to complete repair services, we will emphasize upgrades and customization items to develop other income streams. We will always pursue the product that best suits our client’s interest.
Competitive Comparison:
MusicWest is different from its competitors in several key areas. Our three largest competitors do not carry band and orchestral instruments, one of our primary focuses. We must offer varied services and product mixes and be competitively priced as well, in order to survive. Accessories are the highest profit center for the store, and we must keep our department well-stocked to take advantage of our competitors’ flaws and avoid this pitfall ourselves.
Fulfillment:
MusicWest will buy its inventory directly from the manufacturer when feasible to obtain the lowest price possible. We will frequently compare prices of distributors to ensure we are getting the best price per item. MusicWest will always put the quality/value of the product ahead of price. We intend to buy key items in bulk to obtain a pricing advantage over our direct competitors. Common discounts in the industry consist of free freight, repayment term incentives, additional free merchandise, or incremental percentage discounts on quantity purchases. We should not risk over-stocking new or unproven merchandise just to get a small advantage in price over competitors.
Technology:
The Music Industry is currently riding a trend toward high-tech electronics, notably in guitar related effects and multi-track recording hard/software. Digital keyboards are also seeing increased market share as technology becomes more accessible. However, prices in this industry are dropping sharply, so we must bundle products together as packages to increase profits and build sales.
Future Products and Services:
MusicWest will rotate its stock to ensure new products are always available. We will institute programs such as the “Weekend Warrior” program to raise income opportunities.
MusicWest is a leading musical instrument retailer in Albuquerque, catering to novices, hobbyists, and semi-professionals. Our goal is to provide top-notch service and support to our customers, creating an educational and enjoyable shopping experience. We stand out from our competitors by offering a wide selection of instruments, fair pricing, and excellent customer service. With our unique programs like the "100% of purchase price trade-up guarantee" and "You play, we pay" incentives, we aim to exceed our customers’ expectations and build long-term relationships with them. MusicWest is dedicated to bringing back the local market and providing a one-stop shopping experience for all musicians in the area.
For our target clientele, MusicWest will provide a complete one-stop shopping experience that addresses all the needs of aspiring musicians. Offering repairs and unique marketing programs like our "You play, we pay" and our "100% of purchase price trade-up policy," we aim to exceed the expectations of the local client base. Unlike our competitors, MusicWest will selectively stock products with value in mind, not just the lowest price, and we will strive to provide the highest level of attention to customers to gain their trust and purchasing power.
MusicWest operates under the assumption that any customer entering our store is a potential customer of our competitors. We give each client our utmost attention and try to accommodate their needs in a low-pressure relaxed atmosphere. Through modern eye-catching displays designed to maximize impulse buying, we stimulate their senses. MusicWest caters to professionals, novices, parents, and children alike. Our goal is to obtain the largest market share and we will do anything in our power to achieve it.
In short, nobody walks out unless we are satisfied we did everything possible to gain their business today or in the future!
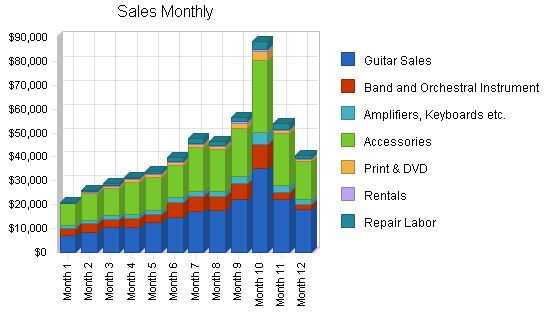
Our sales projections are mainly based on Dave Moore’s experiences as manager of King Music and Marc’s Guitar Center. We believe we can easily meet the projected sales figures for the first year and may be conservative in our projections for the following two years. With only two weak band instrument dealers in our targeted territory, we have a great opportunity to establish instant credibility in the market. Mr. Moore has a list of over 4,000 musicians he has helped, allowing us to draw in proven customers for the store’s opening and operate from an established client base during the initial months.
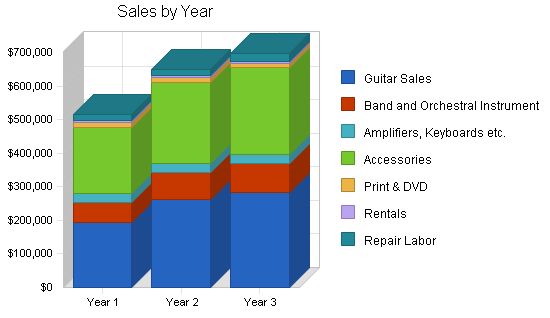
| Sales Forecast | |||
| Year 1 | Year 2 | Year 3 | |
| Sales | |||
| Guitar Sales | $195,000 | $263,500 | $283,000 |
| Band and Orchestral Instruments | $58,144 | $79,000 | $85,000 |
| Amplifiers, Keyboards etc. | $27,600 | $26,200 | $27,500 |
| Accessories | $196,274 | $243,000 | $259,000 |
| Print & DVD | $15,550 | $13,500 | $14,000 |
| Rentals | $4,950 | $4,950 | $5,900 |
| Repair Labor | $17,260 | $20,000 | $22,500 |
| Total Sales | $514,778 | $650,150 | $696,900 |
| Direct Cost of Sales | Year 1 | Year 2 | Year 3 |
| Guitar Sales | $117,000 | $158,100 | $169,800 |
| Band and Orchestral Instruments | $29,072 | $39,500 | $42,500 |
| Amplifiers, Keyboards etc. | $16,560 | $15,720 | $16,500 |
| Accessories | $78,510 | $97,200 | $103,600 |
| Print & DVD | $9,330 | $8,100 | $8,400 |
| Rentals | $4,950 | $4,950 | $5,900 |
| Repair Labor | $2,589 | $3,000 | $3,375 |
| Subtotal Direct Cost of Sales | $258,011 | $326,570 | $350,075 |
5.5.2 Sales Programs
MusicWest offers programs to increase sales and reward customer loyalty:
- MusicWest’s “100% Of Purchase Price Trade Up Policy” on fretted instruments. Within the first year of purchase, MusicWest will give a consumer 100% of what they paid for a fretted instrument less tax toward a step-up instrument that is currently in stock. The trade can have normal wear and tear. MusicWest will be the sole judge of what qualifies as a step-up instrument.
5.6 Strategic Alliances
MusicWest becomes a member of N.A.M.M. (National Association of Music Merchants). This organization plans events throughout the year, such as “International Guitar Month.” MusicWest will follow this group’s promotion schedule and tie it in to our own advertising campaigns. No local storefront currently takes full advantage of these offerings. By taking advantage of this trade organization’s expertise, we can save time and money on developing an effective advertisement campaign from day one. Some manufacturers also have advertising co-ops that we will use when feasible. Additionally, these manufacturers provide nationally known musicians on a fee basis to their dealers, for informational/instructional clinics and to drive additional sales opportunities.
Web Plan Summary
MusicWest will have an informational website containing hyperlinks to our main manufacturers’ home pages. We will also offer promotional coupons to entice Web surfers to visit our storefront. We have purposely chosen to avoid a sales engine, as we believe our major Web competitors could easily beat our local price. The User Interface we envision will be easy to page through, with exciting graphics, and geared toward steering visitors to our storefront. We will work with an outside website design and hosting service to create and maintain our website.
Management Summary
MusicWest will initially maintain a small staff of experienced employees to take advantage of the higher overhead of our key competitors. We will operate with four full-time employees and one to three part-time employees as needed. Each employee should be empowered to make crucial decisions on the spot for customer satisfaction. This staffing approach allows for only one manager for day-to-day decisions, keeping hierarchy to a minimum. MusicWest will be selective in future hiring and will reward employees as the store prospers in future years. It is crucial to keep employee turnover at a minimum, as consumers in this business like to develop long-term relationships with their sales representative. Our key employees will be experienced musicians known in the community.
7.1 Organizational Structure
MusicWest requires its staff to be multi-skilled. Each employee will likely oversee many aspects of the business on a given day. The main divisions will be Sales, Service, and Administration. Our focus on customer service depends on all employees knowing as much about each area of the business as possible. A complete book of structures and policies, along with successful actions, will be created and maintained from the date of opening to streamline the process of adding new employees as they become necessary. Ongoing training for all employees will be necessary to keep our edge on the competition.
7.2 Management Team
Kayle Moore – Co-Owner
Operations Manager
Kayle is a 16-year veteran of the wholesale jewelry industry. Over her 16-year tenure, Kayle took the company from 60 to over 300 employees and from $1 to over $15 million dollars in sales. Kayle’s strengths are writing and carrying out sales programs, and keeping a company within its financial limitations. Kayle, who plays the clarinet, has had a lifelong interest in music and plans to translate that enthusiasm, along with her management skills, into making MusicWest a successful long-term investment.
Related Management Strengths:
- CEO/COO level responsibility.
- Ability to get others to produce to their potential.
- Writing sales programs to generate and maintain consistent sales goals.
- Excellent communication skills.
- Maintains mutually beneficial vendor relations.
- Ability to anticipate and adapt to changing economic conditions.
- Experience negotiating complex sales contracts, including financing and shipment options with large corporate clients such as Wal-Mart and Target.
- Implemented the use of EDT computerized ordering software with clients to streamline the ordering process and allow the manufacturer to stock less raw inventory, simultaneously reducing overhead and increasing profits.
David Moore – Co-Owner
Store Manager
Dave is currently the Store Manager of Marc’s Guitar Center in Albuquerque. Dave was previously Store Manager for King Music’s Westside location, where he was able to turn around a declining location and outsell the company’s flagship store for two years straight, despite fewer customers and staff. Dave has been a musician for over 23 years and toured professionally in the 80’s. Dave has been involved in sales and sales management since the age of eight. Dave has taken many sales/management courses and has had full profit and loss experience. Dave was the co-owner of a 7,500 sq.ft. retail furniture store in the early 1980’s.
Related, industry-specific strengths:
- Music Store Management. (7 years +)
- Direct purchasing of up to $400,000 in inventory annually.
- Top sales producer in the musical instrument combo department, in addition to his full-time management responsibilities at both music stores where he has worked.
- Outstanding employee relations, with lower-than-industry-average turnover.
- Excellent relations with vendors.
- Vast knowledge of Musical Instruments and the Musical Instrument Industry locally and nationally.
- Superior customer interaction/retention skills.
- Sales, Sales Manager, and Finance Manager in the automotive industry.
- Trade show management and Sales in the Wholesale Jewelry Trade.
- Certified computer skills.
C. Ray Himes
Service Department – Manager
- Graduate of the prestigious Roberto Venn School of Luthiery in Phoenix, Arizona.
- Trained in all aspects of fretted instrument repair, including re-frets, neck resets, crack repair, wiring, and modification work.
- Completely versed in the new construction of electric and acoustic guitars.
- Instructed in all phases of managing a full-service repair shop.
- Trained personally by Dave Moore in guitar sales and accessory sales.
- Good at improvising and solving difficult problems.
- Good woodworking skills essential to this position.
- Ongoing commitment to furthering his skills and knowledge of fretted instruments.
- Plays in a local band: “Tanuki.”
7.3 Management Team Gaps
We believe we have assembled an excellent team of employees that will complement each other’s knowledge and skill levels. We feel weakest in the band instrument repair department. As soon as finances permit, a knowledgeable repairman with this background would be highly desirable. We already know of one excellent candidate, currently working for Albuquerque public schools. The addition of this person will be a huge benefit for our store.
7.4 Personnel Plan
The personnel plan highlights our intent to hire as few employees as possible to keep control over how our customers are treated during the crucial first stages of our business. We will have two full-time salespeople and two to three part-time employees to call upon as traffic demands. In addition, all key employees have agreed to work at lower pay structures to keep personnel costs at a minimum during the critical first two years.
| Personnel Plan | |||
| Year 1 | Year 2 | Year 3 | |
| Dave Moore | $31,000 | $31,000 | $35,000 |
| Kayle Moore | $31,000 | $31,000 | $35,000 |
| C. Ray Himes | $26,400 | $27,000 | $32,000 |
| Full-time Employee #1 | $20,400 | $22,000 | $25,000 |
| Full-time Employee #2 | $20,400 | $22,000 | $25,000 |
| Part-time Employee #1 | $6,600 | $6,800 | $7,200 |
| Part-time Employee #2 | $6,600 | $6,800 | $7,200 |
| Seasonal Employee #1 | $1,750 | $2,350 | $2,450 |
| Total People | 7 | 8 | 8 |
| Total Payroll | $144,150 | $148,950 | $168,850 |
Financial Plan
We expect revenues and sales to increase dramatically between the second and fourth years of operation. After that high-growth period, we expect growth to be steady and stable for the foreseeable future. This industry is very susceptible to consumers’ judgments about the store based on inventory, brands offered, pricing, and staffing. It is crucial that we generate sufficient cash reserves during the growth years to be able to jump on future opportunities, allowing us to increase our market share.
8.1 Important Assumptions
The financial plan depends on certain assumptions, most of which are shown in the following table. The key assumptions are:
- Economy proceeding, as in recent trends, of 2 to 4% annual growth.
- No new major band and orchestral competitors on a large scale within the next two years in our direct vicinity.
- No unforeseen changes with our major vendors in regards to lines carried.
- No major change in our relationship with China or other foreign governments that would hinder product supply.
| General Assumptions | |||
| Year 1 | Year 2 | Year 3 | |
| Plan Month | 1 | 2 | 3 |
| Current Interest
Pro Forma Profit and Loss: |
|||
| Pro Forma Profit and Loss | |||
| Year 1 | Year 2 | Year 3 | |
| Sales | $514,778 | $650,150 | $696,900 |
| Direct Cost of Sales | $258,011 | $326,570 | $350,075 |
| Other Production Expenses | $0 | $0 | $0 |
| Total Cost of Sales | $258,011 | $326,570 | $350,075 |
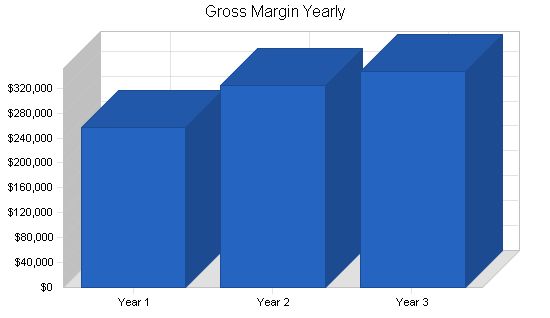
| Gross Margin | $256,767 | $323,580 | $346,825 |
| Gross Margin % | 49.88% | 49.77% | 49.77% |
| Expenses | |||
| Payroll | $144,150 | $148,950 | $168,850 |
| Sales and Marketing and Other Expenses | $51,200 | $55,400 | $58,900 |
| Depreciation | $0 | $0 | $0 |
| Accountant Expense | $5,200 | $5,500 | $6,000 |
| Utilities | $17,120 | $18,000 | $19,000 |
| Insurance | $4,800 | $5,200 | $5,700 |
| Rent | $30,000 | $30,000 | $30,000 |
| Payroll Taxes | $0 | $0 | $0 |
| Website Maintenance | $300 | $325 | $350 |
| Total Operating Expenses | $252,770 | $263,375 | $288,800 |
| Profit Before Interest and Taxes | $3,997 | $60,205 | $58,025 |
| EBITDA | $3,997 | $60,205 | $58,025 |
| Interest Expense | $11,746 | $9,526 | $7,210 |
| Taxes Incurred | $0 | $15,204 | $15,244 |
| Net Profit | ($7,748) | $35,475 | $35,570 |
| Net Profit/Sales | -1.51% | 5.46% | 5.10% |
8.3 Break-even Analysis:
For break-even analysis purposes, the assumed monthly running costs are shown below. Payroll alone constitutes a significant portion of these costs. The break-even assumptions rely on the personal experience of co-owner David Moore, gleaned from his time as manager of King Music Centers, Inc., and Marc’s Guitar Center. We expect to achieve above-average margins by selectively choosing products that enable these margins and by employing value-added marketing strategies for these products and related services.
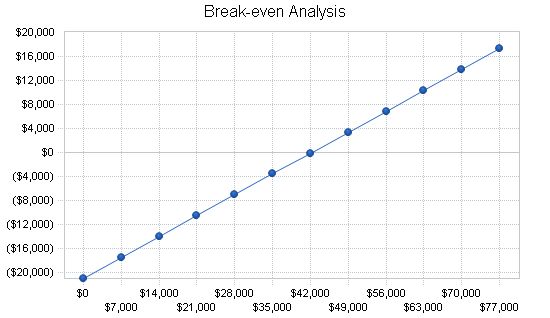
Break-even Analysis:
Monthly Revenue Break-even: $42,230.
Assumptions:
– Average Percent Variable Cost: 50%
– Estimated Monthly Fixed Cost: $21,064.
8.4 Projected Cash Flow:
Our cash flow projections indicate a slight negative cash flow. However, our existing funds are sufficient to cover this without relying on additional credit financing. We expect to maintain a positive cash balance going forward.
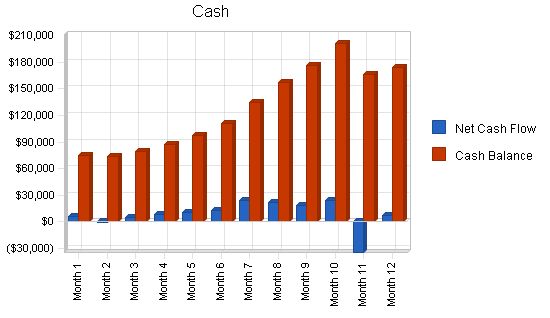
Pro Forma Cash Flow
| Pro Forma Cash Flow | |||
| Year 1 | Year 2 | Year 3 | |
| Cash Received | |||
| Cash from Operations | |||
| Cash Sales | $514,778 | $650,150 | $696,900 |
| Subtotal Cash from Operations | $514,778 | $650,150 | $696,900 |
| Additional Cash Received | |||
| Sales Tax, VAT, HST/GST Received | $0 | $0 | $0 |
| New Current Borrowing | $0 | $0 | $0 |
| New Other Liabilities (interest-free) | $0 | $0 | $0 |
| New Long-term Liabilities | $0 | $0 | $0 |
| Sales of Other Current Assets | $0 | $0 | $0 |
| Sales of Long-term Assets | $0 | $0 | $0 |
| New Investment Received | $0 | $0 | $0 |
| Subtotal Cash Received | $514,778 | $650,150 | $696,900 |
| Expenditures | Year 1 | Year 2 | Year 3 |
| Expenditures from Operations | |||
| Cash Spending | $144,150 | $148,950 | $168,850 |
| Bill Payments | $229,463 | $454,298 | $492,649 |
| Subtotal Spent on Operations | $373,613 | $603,248 | $661,499 |
| Additional Cash Spent | |||
| Sales Tax, VAT, HST/GST Paid Out | $0 | $0 | $0 |
| Principal Repayment of Current Borrowing | $0 | $0 | $0 |
| Other Liabilities Principal Repayment | $0 | $0 | $0 |
| Long-term Liabilities Principal Repayment | $35,628 | $35,628 | $35,628 |
| Purchase Other Current Assets | $0 | $0 | $0 |
| Purchase Long-term Assets | $0 | $0 | $0 |
| Dividends | $0 | $0 | $0 |
| Subtotal Cash Spent | $409,241 | $638,876 | $697,127 |
| Net Cash Flow | $105,537 | $11,274 | ($227) |
| Cash Balance | $174,037 | $185,311 | $185,084 |
8.5 Projected Balance Sheet
The projections in the balance sheet are solid. We anticipate no trouble meeting our debt obligations if we follow through with the plans and strategies outlined in this business plan.
| Pro Forma Balance Sheet | |||
| Year 1 | Year 2 | Year 3 | |
| Assets | |||
| Current Assets | |||
| Cash | $174,037 | $185,311 | $185,084 |
| Inventory | $22,460 | $28,429 | $30,475 |
| Other Current Assets | $0 | $0 | $0 |
| Total Current Assets | $196,498 | $213,740 | $215,559 |
| Long-term Assets | |||
| Long-term Assets | $7,500 | $7,500 | $7,500 |
| Accumulated Depreciation | $0 | $0 | $0 |
| Total Long-term Assets | $7,500 | $7,500 | $7,500 |
| Total Assets | $203,998 | $221,240 | $223,059 |
| Liabilities and Capital | Year 1 | Year 2 | Year 3 |
| Current Liabilities | |||
| Accounts Payable | $21,374 | $38,769 | $40,646 |
| Current Borrowing | $0 | $0 | $0 |
| Other Current Liabilities | $0 | $0 | $0 |
| Subtotal Current Liabilities | $21,374 | $38,769 | $40,646 |
| Long-term Liabilities | $164,372 | $128,744 | $93,116 |
| Total Liabilities | $185,746 | $167,513 | $133,762 |
| Paid-in Capital | $60,000 | $60,000 | $60,000 |
| Retained Earnings | ($34,000) | ($41,748) | ($6,273) |
| Earnings | ($7,748) | $35,475 | $35,570 |
| Total Capital | $18,252 | $53,727 | $89,297 |
| Total Liabilities and Capital | $203,998 | $221,240 | $223,059 |
| Net Worth | $18,252 | $53,727 | $89,297 |
8.6 Business Ratios
The following table shows industry relevant ratios for Musical Instrument Stores (SIC code 5736).
| Ratio Analysis | ||||
| Year 1 | Year 2 | Year 3 | Industry Profile | |
| Sales Growth | 0.00% | 26.30% | 7.19% | 4.64% |
| Percent of Total Assets | ||||
| Inventory | 11.01% | 12.85% | 13.66% | 37.97% |
| Other Current Assets | 0.00% | 0.00% | 0.00% | 27.27% |
| Total Current Assets | 96.32% | 96.61% | 96.64% | 79.90% |
| Long-term Assets | 3.68% | 3.39% | 3.36% |
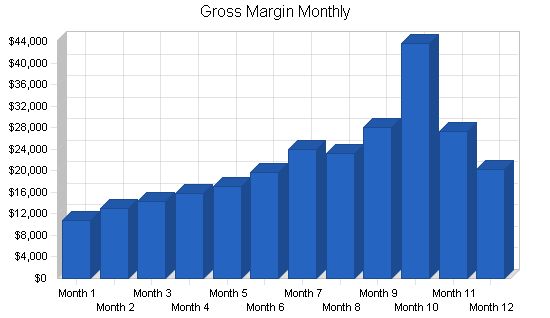
Dave Moore: 0%, $2,500, $2,500, $2,500, $2,500, $2,500, $2,500, $2,500, $2,500, $2,500, $2,500, $3,500, $2,500, $2,500 Kayle Moore: 0%, $2,500, $2,500, $2,500, $2,500, $2,500, $2,500, $2,500, $2,500, $2,500, $2,500, $3,500, $2,500, $2,500 C. Ray Himes: 0%, $2,200, $2,200, $2,200, $2,200, $2,200, $2,200, $2,200, $2,200, $2,200, $2,200, $2,200, $2,200, $2,200 Full-time Employee #1: 0%, $1,700, $1,700, $1,700, $1,700, $1,700, $1,700, $1,700, $1,700, $1,700, $1,700, $1,700, $1,700, $1,700 Full-time Employee #2: 0%, $1,700, $1,700, $1,700, $1,700, $1,700, $1,700, $1,700, $1,700, $1,700, $1,700, $1,700, $1,700, $1,700 Part-time Employee #1: 0%, $450, $450, $450, $450, $450, $450, $450, $550, $750, $950, $750, $450 Part-time Employee #2: 0%, $450, $450, $450, $450, $450, $450, $450, $550, $750, $950, $750, $450 Seasonal Employee #1: 0%, $0, $0, $0, $0, $0, $0, $0, $0, $0, $700, $700, $350, $0 Total People: 7, 7, 7, 7, 7, 7, 7, 7, 7, 8, 8, 8, 7 Total Payroll: $11,500, $11,500, $11,500, $11,500, $11,500, $11,500, $11,500, $11,700, $12,800, $15,200, $12,450, $11,500 General Assumptions Plan Month: 1, 2, 3, 4, 5, 6, 7, 8, 9, 10, 11, 12 Current Interest Rate: 6.50%, 6.50%, 6.50%, 6.50%, 6.50%, 6.50%, 6.50%, 6.50%, 6.50%, 6.50%, 6.50%, 6.50%, 6.50% Long-term Interest Rate: 6.50%, 6.50%, 6.50%, 6.50%, 6.50%, 6.50%, 6.50%, 6.50%, 6.50%, 6.50%, 6.50%, 6.50%, 6.50% Tax Rate: 30.00%, 30.00%, 30.00%, 30.00%, 30.00%, 30.00%, 30.00%, 30.00%, 30.00%, 30.00%, 30.00%, 30.00%, 30.00% Other: 0, 0, 0, 0, 0, 0, 0, 0, 0, 0, 0, 0, 0 Pro Forma Profit and Loss Sales: $21,050, $25,854, $28,676, $31,496, $34,105, $39,676, $47,547, $46,490, $56,600, $88,500, $54,100, $40,684 Direct Cost of Sales: $10,353, $12,777, $14,404, $15,647, $17,111, $20,018, $23,578, $23,351, $28,645, $44,925, $26,785, $20,419 Other Production Expenses: $0, $0, $0, $0, $0, $0, $0, $0, $0, $0, $0, $0, $0 Total Cost of Sales: $10,353, $12,777, $14,404, $15,647, $17,111, $20,018, $23,578, $23,351, $28,645, $44,925, $26,785, $20,419 Gross Margin: $10,698, $13,077, $14,272, $15,849, $16,994, $19,658, $23,969, $23,139, $27,955, $43,575, $27,315, $20,265 Gross Margin %: 50.82%, 50.58%, 49.77%, 50.32%, 49.83%, 49.55%, 50.41%, 49.77%, 49.39%, 49.24%, 50.49%, 49.81% Expenses Payroll: $11,500, $11,500, $11,500, $11,500, $11,500, $11,500, $11,500, $11,700, $12,800, $15,200, $12,450, $11,500 Sales and Marketing and Other Expenses: $6,400, $3,400, $3,400, $3,400, $5,900, $3,400, $3,400, $2,400, $4,500, $5,700, $5,900, $3,400 Depreciation: $0, $0, $0, $0, $0, $0, $0, $0, $0, $0, $0, $0 Accountant Expense: $800, $400, $400, $400, $400, $400, $400, $400, $400, $400, $400, $400, $400 Utilities: $1,040, $1,040, $1,130, $1,380, $1,790, $1,460, $1,370, $1,460, $1,760, $2,210, $1,400, $1,080 Insurance: $400, $400, $400, $400, $400, $400, $400, $400, $400, $400, $400, $400, $400 Rent: $2,500, $2,500, $2,500, $2,500, $2,500, $2,500, $2,500, $2,500, $2,500, $2,500, $2,500, $2,500 Payroll Taxes: 15%, $0, $0, $0, $0, $0, $0, $0, $0, $0, $0, $0, $0 Website Maintenance: $25, $25, $25, $25, $25, $ Pro Forma Cash Flow: |
| Pro Forma Cash Flow | |||||||||||||
| Month 1 | Month 2 | Month 3 | Month 4 | Month 5 | Month 6 | Month 7 | Month 8 | Month 9 | Month 10 | Month 11 | Month 12 | ||
| Cash Received | |||||||||||||
| Cash from Operations | |||||||||||||
| Cash Sales | $21,050 | $25,854 | $28,676 | $31,496 | $34,105 | $39,676 | $47,547 | $46,490 | $56,600 | $88,500 | $54,100 | $40,684 | |
| Subtotal Cash from Operations | $21,050 | $25,854 | $28,676 | $31,496 | $34,105 | $39,676 | $47,547 | $46,490 | $56,600 | $88,500 | $54,100 | $40,684 | |
| Additional Cash Received | |||||||||||||
| Sales Tax, VAT, HST/GST Received | 0.00% | $0 | $0 | $0 | $0 | $0 | $0 | $0 | $0 | $0 | $0 | $0 | |
| New Current Borrowing | $0 | $0 | $0 | $0 | $0 | $0 | $0 | $0 | $0 | $0 | $0 | $0 | |
| New Other Liabilities (interest-free) | $0 | $0 | $0 | $0 | $0 | $0 | $0 | $0 | $0 | $0 | $0 | $0 | |
| New Long-term Liabilities | $0 | $0 | $0 | $0 | $0 | $0 | $0 | $0 | $0 | $0 | $0 | $0 | |
| Sales of Other Current Assets | $0 | $0 | $0 | $0 | $0 | $0 | $0 | $0 | $0 | $0 | $0 | $0 | |
| Sales of Long-term Assets | $0 | $0 | $0 | $0 | $0 | $0 | $0 | $0 | $0 | $0 | $0 | $0 | |
| New Investment Received | $0 | $0 | $0 | $0 | $0 | $0 | $0 | $0 | $0 | $0 | $0 | $0 | |
| Subtotal Cash Received | $21,050 | $25,854 | $28,676 | $31,496 | $34,105 | $39,676 | $47,547 | $46,490 | $56,600 | $88,500 | $54,100 | $40,684 | |
| Expenditures | Month 1 | Month 2 | Month 3 | Month 4 | Month 5 | Month 6 | Month 7 | Month 8 | Month 9 | Month 10 | Month 11 | Month 12 | |
| Expenditures from Operations | |||||||||||||
| Cash Spending | $11,500 | $11,500 | $11,500 | $11,500 | $11,500 | $11,500 | $11,500 | $11,700 | $12,800 | $15,200 | $12,450 | $11,500 | |
| Bill Payments | $408 | $12,118 | $8,819 | $8,898 | $9,220 | $11,923 | $9,168 | $9,466 | $21,860 | $45,992 | $73,103 | $18,487 | |
| Subtotal Spent on Operations | $11,908 | $23,618 | $20,319 | $20,398 | $20,720 | $23,423 | $20,668 | $21,166 | $34,660 | $61,192 | $85,553 | $29,987 | |
| Additional Cash Spent | |||||||||||||
| Sales Tax, VAT, HST/GST Paid Out | $0 | $0 | $0 | $0 | $0 | $0 | $0 | $0 | $0 | $0 | $0 | ||
| Principal Repayment of Current Borrowing | $0 | $0 | $0 | $0 | $0 | $0 | $0 | $0 | $0 | $0 | $0 | $0 | |
| Other Liabilities Principal Repayment | $0 | $0 | $0 | $0 | $0 | $0 | $0 | $0 | $0 | $0 | $0 | $0 | |
| Long-term Liabilities Principal Repayment | $2,969 | $2,969 | $2,969 | $2,969 | $2,969 | $2,969 | $2,969 | $2,969 | $2,969 | $2,969 | $2,969 | $2,969 | |
| Purchase Other Current Assets | $0 | $0 | $0 | $0 | $0 | $0 | $0 | $0 | $0 | $0 | $0 | $0 | |
| Purchase Long-term Assets | $0 | $0 | $0 | $0 | $0 | $0 | $0 | $0 | $0 | $0 | $0 | $0 | |
| Dividends | $0 | $0 | $0 | $0 | $0 | $0 | $0 | $0 | $0 | $0 | $0 | $0 | |
| Subtotal Cash Spent | $14,877 | $26,587 | $23,288 | $23,367 | $23,689 | $26,392 | $23,637 | $24,135 | $37,629 | $64,161 | $88,522 | $32,956 | |
| Net Cash Flow | $6,173 | ($733) | $5,388 | $8,129 | $10,416 | $13,284 | $23,910 | $22,355 | $18,971 | $24,339 | ($34,422) | $7,728 | |
| Cash Balance | $74,673 | $73,940 | $79,328 | $87,457 | $97,873 | $111,157 | $135,067 | $157,422 | $176,392 | $200,732 | $166,310 | $174,037 | |
Pro Forma Balance Sheet:
| Pro Forma Balance Sheet | |||||||||||||
| Month 1 | Month 2 | Month 3 | Month 4 | Month 5 | Month 6 | Month 7 | Month 8 | Month 9 | Month 10 | Month 11 | Month 12 | ||
| Assets | Starting Balances | ||||||||||||
| Current Assets | |||||||||||||
| Cash | $68,500 | $74,673 | $73,940 | $79,328 | $87,457 | $97,873 | $111,157 | $135,067 | $157,422 | $176,392 | $200,732 | $166,310 | $174,037 |
| Inventory | $150,000 | $139,648 | $126,871 | $112,467 | $96,820 | $79,710 | $59,692 | $36,114 | $25,686 | $31,510 | $49,418 | $29,464 | $22,460 |
Hello!
I’m Andrew Brooks, a seasoned finance consultant from the USA and the mind behind phonenumber247.com.
My career is built on a foundation of helping individuals and businesses thrive financially in an ever-changing economic landscape. At phonenumber247.com, my aim is to demystify the complex world of finance, providing clear, actionable advice that can help you navigate your financial journey with confidence. Whether it’s personal finance management, investment strategies, or understanding the nuances of market dynamics, I’m here to share insights and tools that can propel you towards your financial goals.
Welcome to my digital space, where every piece of advice is a step closer to financial clarity and success!

